Search Results for pie chart
Explore AI generated designs, images, art and prompts by top community artists and designers.
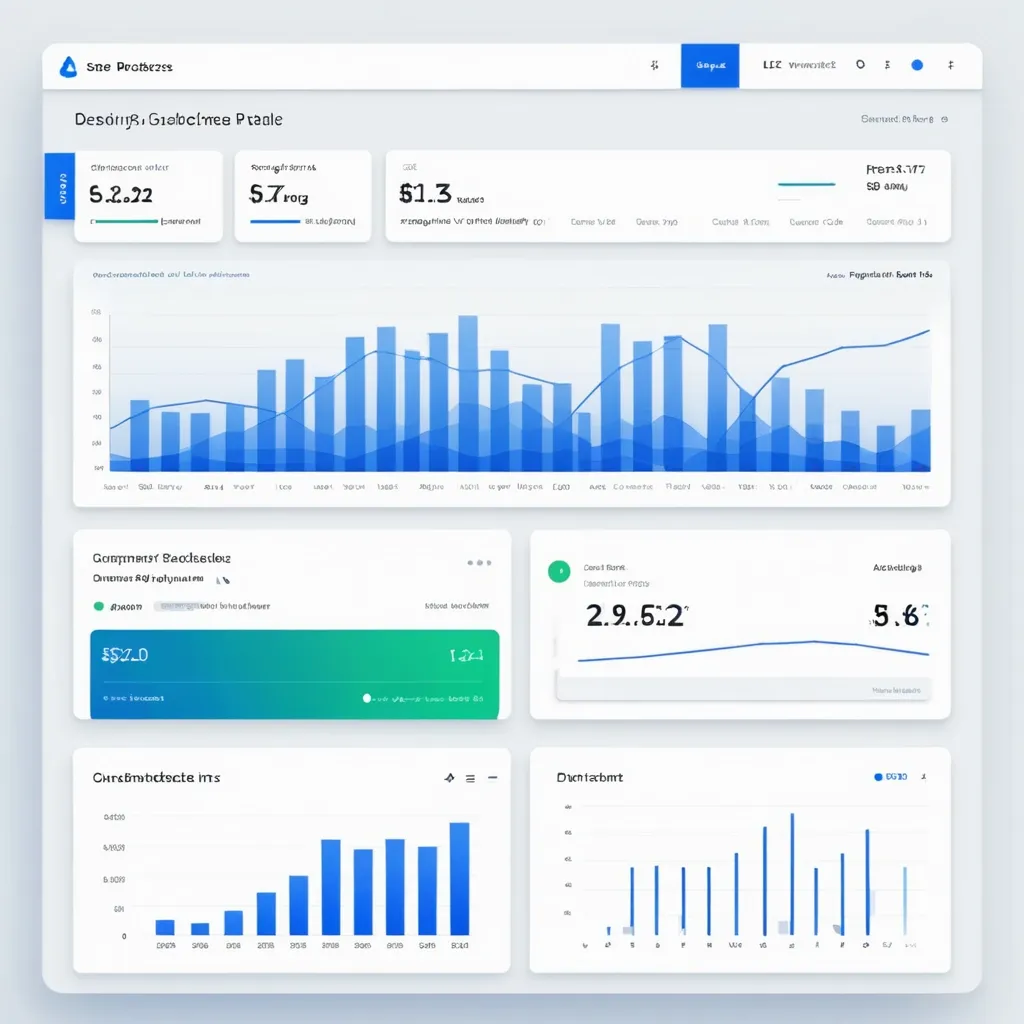

Design a clean , professional Analytics Page for the SynCloud Customer Portal. The page should focus on usage insights and billing alerts. Include the following features: Overview Cards (Top Section) Total API Requests (count) Total Compute Tokens used Current Billing Cycle Usage (percentage of quota consumed) Last Request Timestamp Budget Threshold Alerts Show colored alert bars at 50% , 80% , and 100% usage. Example: Green (50%) , Orange (80%) , Red (100%). Notifications panel showing recent alerts. Charts & Graphs Line chart: Daily API requests (last 7 days). Bar chart: Token consumption per week. Pie chart: Requests by service type (Playground , API , Agent). Detailed Usage History (Table) Columns: Date , Time , Request Type , Tokens Used , Status (Success/Failed). Search and filter by date range , request type. Option to export data as CSV/PDF. UX Considerations Sidebar navigation link highlighted: Analytics. Responsive layout (desktop + mobile). Minimal color palette with blue/white gradients and soft shadows. Tooltips on graphs for detailed insights. ,
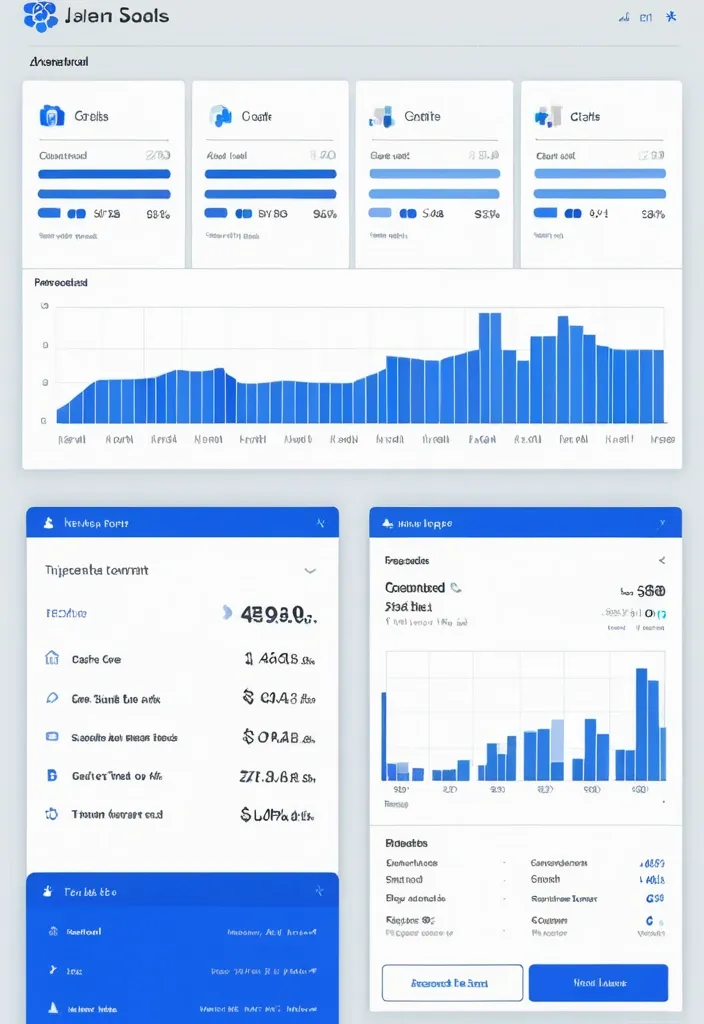
"Design a modern analytics dashboard for SynCloud Customer Portal. Show top stat cards: Total API Requests , Compute Tokens Used , Billing Cycle % with 50/80/100% alerts , and Last Request. Add visual charts: line chart for daily requests , bar chart for weekly token usage , pie chart for requests by service type. Include a usage history table with Date , Request Type , Tokens Used , Status , plus filters and export option. Clean SaaS style , sidebar navigation with Analytics highlighted , responsive design , blue/white theme , minimal and professional." ,

A 3D model of a golden pie chart with three sectors , around which seven devices are located: a computer , a quadcopter , a telephone , a satellite , a leveling device , a laptop , and a system unit. Each device is connected to the diagram by a thick arrow. The background is a beautiful translucent landscape. ,

A 3D model of a golden pie chart with three sectors , around which seven devices are located: a computer , a quadcopter , a telephone , a satellite , a leveling device , a laptop , and a system unit. Each device is connected to the diagram by a thick arrow. The background is a beautiful translucent landscape. ,

A carefully organized array of multicolored bar graphs and pie charts stretches out across a meticulously designed landscape , resembling an intricate , isometric technical drawing. Each element of the illustration represents specific numerical data points from a savings account , the visual language of the image trading specificity for a sense of vastness. A sense of awe and wonder pervades the piece as the viewer is invited to explore the colorful , coded information , a hidden story revealed within the layers. [prompt] - [isometric technical drawing] ,

In the center of the image , place a large internet icon representing the internet as the foundation of the digital economy. Radiating from the internet icon , depict multiple curves extending towards the periphery , symbolizing the penetration of the internet's influence into various industries. At the end of each curve , add small icons or symbols representing different industries such as finance , retail , healthcare , education , etc. , to demonstrate the impact of the digital economy on each industry. At the top and bottom of the image , use arrows to represent the sustained impact and promotion of the digital economy on the economy. The arrows can point upwards to indicate economic development or downwards to indicate economic influence. On the entire background of the image , incorporate stylized charts and data visualization elements such as line graphs , bar charts , pie charts , etc. , to emphasize the importance of the digital economy and the role of data within it. ,
A carefully organized array of multicolored bar graphs and pie charts stretches out across a meticulously designed landscape , resembling an intricate , isometric technical drawing. Each element of the illustration represents specific numerical data points from a savings account , the visual language of the image trading specificity for a sense of vastness. A sense of awe and wonder pervades the piece as the viewer is invited to explore the colorful , coded information , a hidden story revealed within the layers. ,