Search Results for retail
Explore AI generated designs, images, art and prompts by top community artists and designers.


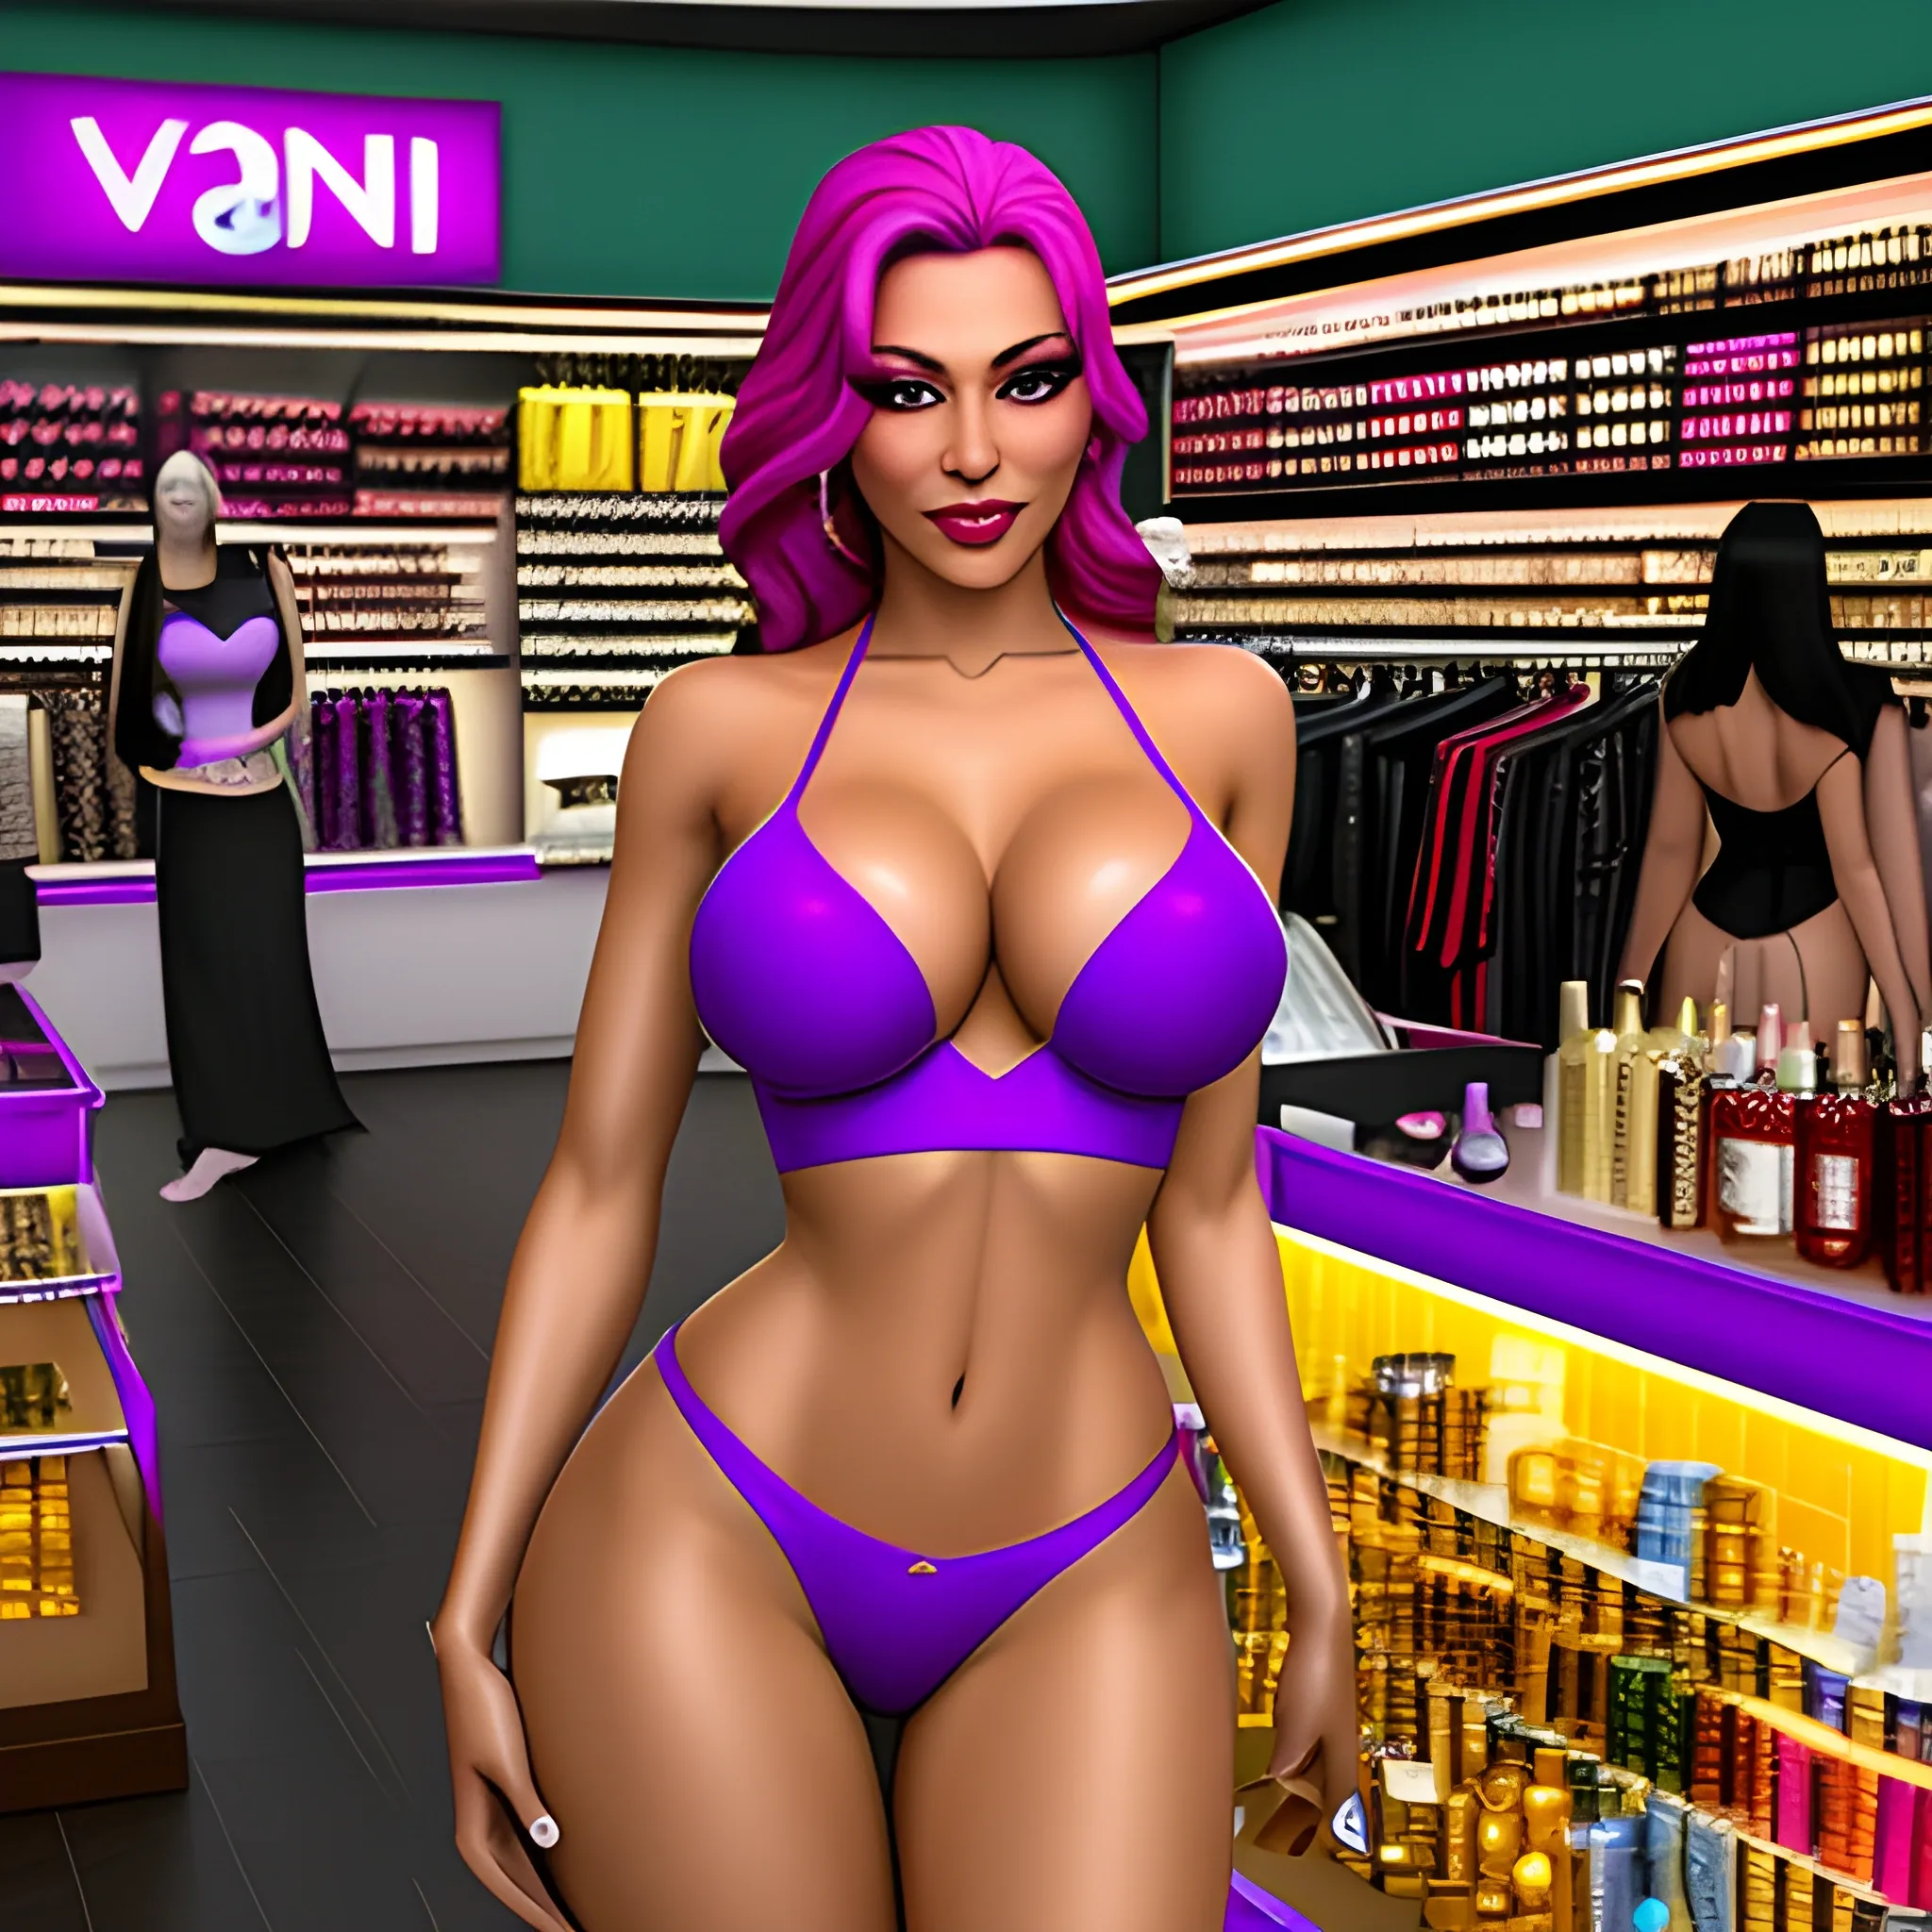
8K photorealistic portrait of a young Indian woman , light skin , dark brown wavy hair on one shoulder. Small red bindi , sindoor , subtle makeup , red lips , red nails. Wearing a bright aqua blue sheer saree , white paisley embroidery , silver border , sleeveless beaded beige/blue blouse. Gold mangalsutra , hoop earrings , nose stud , aqua bangles. Pose: standing gracefully angled , left hand on waist drape , right arm extended relaxed. Brightly lit retail store background with a glass storefront. ,
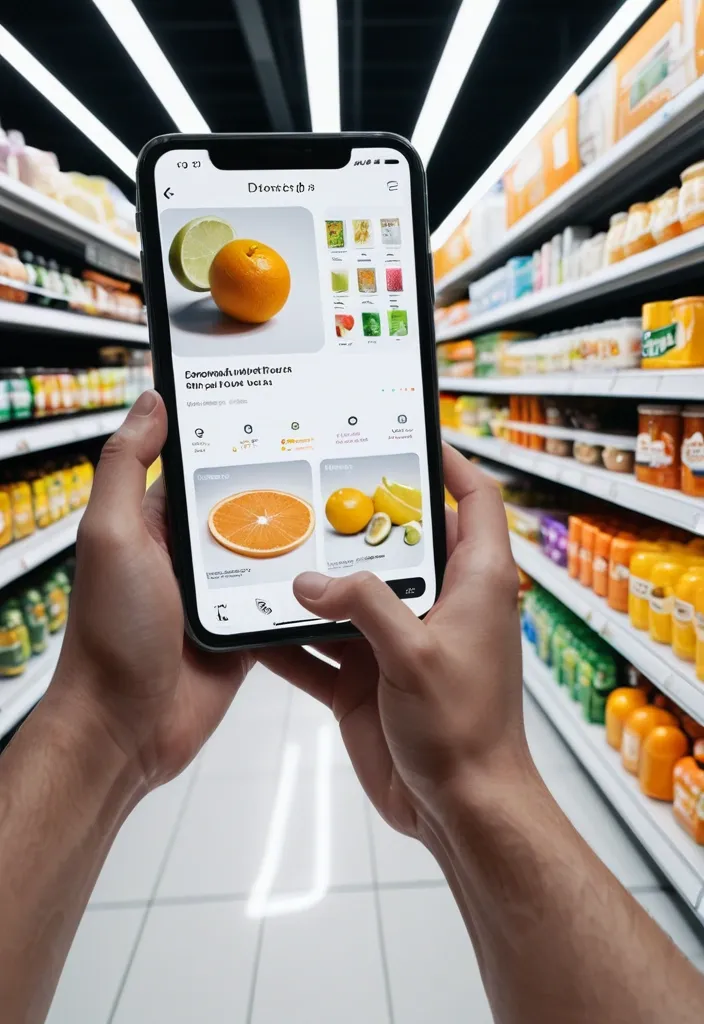
First-person perspective inside a brightly lit supermarket aisle or section. Realistic human hands are holding Limonia close to the camera. The product’s [key visual traits: color , texture , packaging , freshness details] are clearly visible under natural store lighting. The Limonia is surrounded by a multi-layered holographic augmented reality interface displaying relevant product information , including [nutritional or product data such as calories , protein/sugar/caffeine , vitamins , freshness indicator , origin , expiration date , usage or recipe suggestions]. The AR UI elements smoothly shift and reorganize based on the viewer’s gaze direction , as if dynamically responding to user focus. In the left peripheral vision , a vertical semi-transparent shopping list is visible with checked-off items , where Limonia is highlighted as the currently active selection. Hyper-realistic mixed reality , clean futuristic AR design , glass-like UI panels , soft ambient glow , realistic lighting and shadows , natural depth of field , immersive first-person interface , showcasing next-generation retail technology. ,
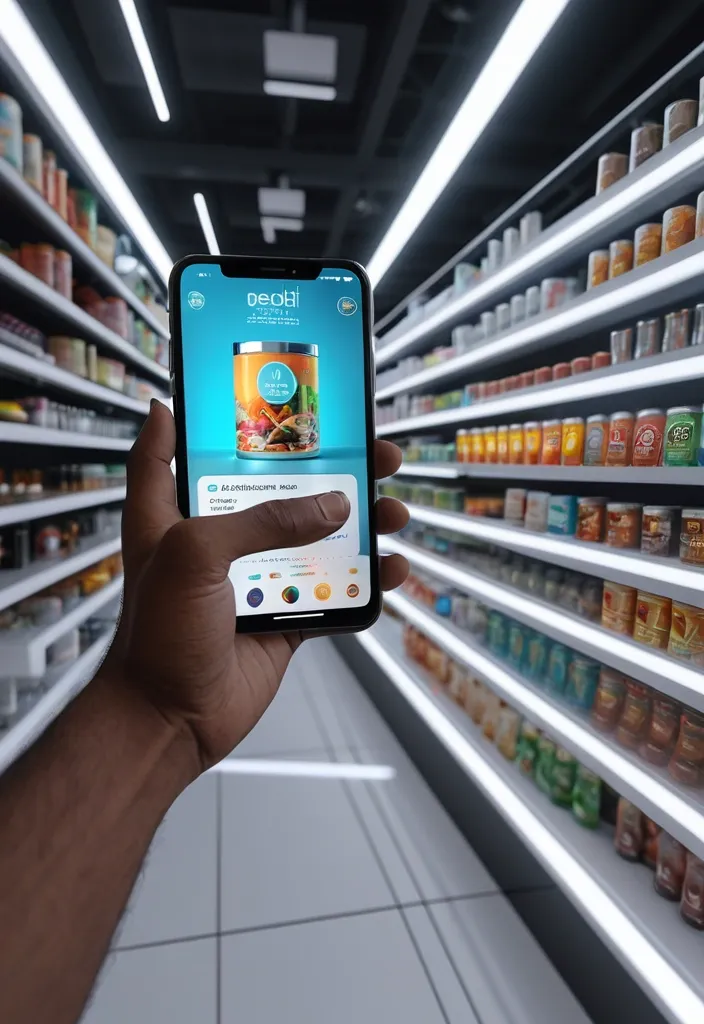
First-person perspective at a brightly lit beach aisle. Realistic human hands are holding a Desi Bidi of Indian smoking product to the camera. The vivid smoking product in its iconic branded Bidi is surrounded by a multi-layered holographic augmented reality interface displaying nutritional data , including calorie count , Tobeco content , caffeine level , freshness indicator , expiration date , and recommended refreshing ingredients and cocktails based on DESI. The UI elements smoothly shift and reorganize based on the viewer’s gaze direction , as if dynamically responding to user focus. In the left peripheral vision , a vertical semi-transparent shopping list is visible with checked-off items , where Desi is highlighted as the currently active selection. Hyper-realistic mixed reality , clean futuristic AR design , glass-like UI panels , soft ambient glow , realistic lighting and shadows , natural depth of field , immersive first-person interface , showcasing next-generation retail technology. ,
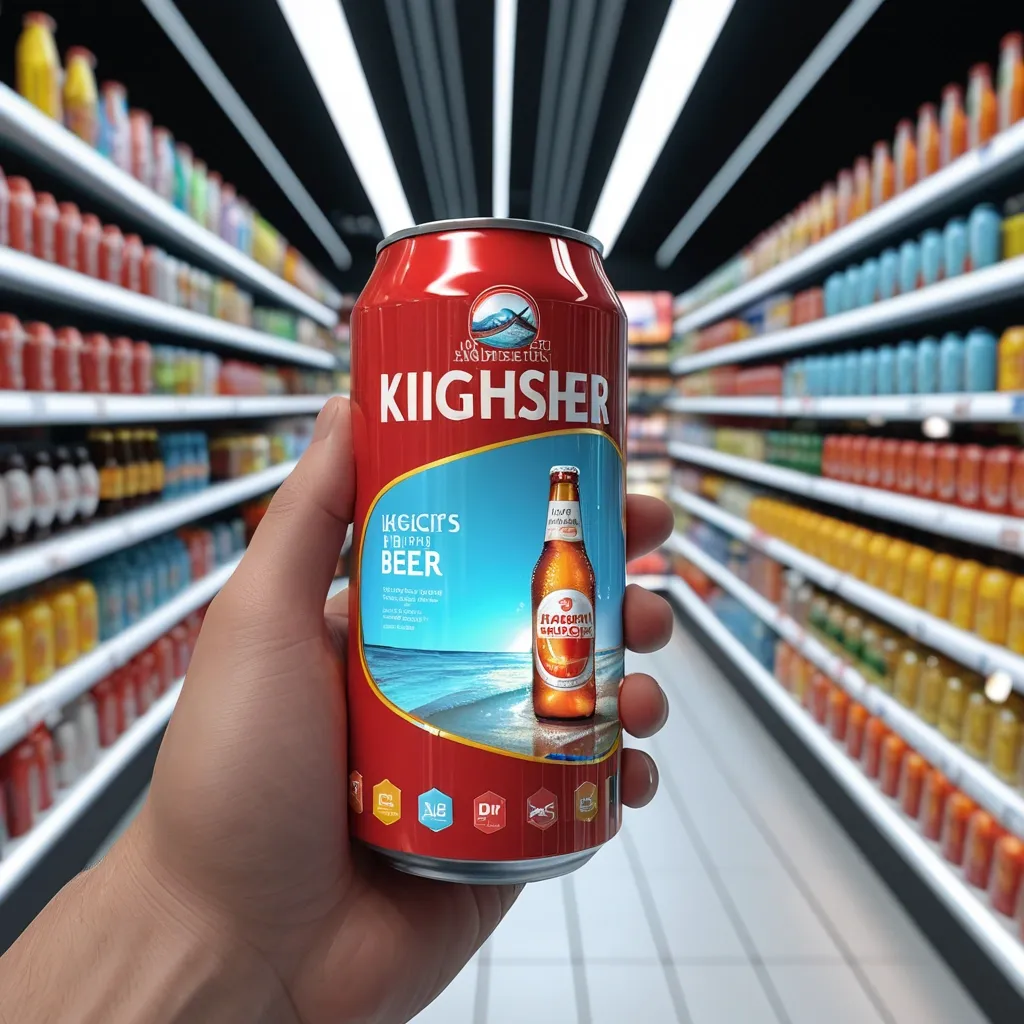
First-person perspective at a brightly lit beach aisle. Realistic human hands are holding a tin of kingfisher beer close to the camera. The vivid beer drink in its iconic branded red tin is surrounded by a multi-layered holographic augmented reality interface displaying nutritional data , including calorie count , alcohol content , caffeine level , freshness indicator , expiration date , and recommended refreshing recipes and cocktails based on Kingfisher. The UI elements smoothly shift and reorganize based on the viewer’s gaze direction , as if dynamically responding to user focus. In the left peripheral vision , a vertical semi-transparent shopping list is visible with checked-off items , where Kingfisher is highlighted as the currently active selection. Hyper-realistic mixed reality , clean futuristic AR design , glass-like UI panels , soft ambient glow , realistic lighting and shadows , natural depth of field , immersive first-person interface , showcasing next-generation retail technology. ,
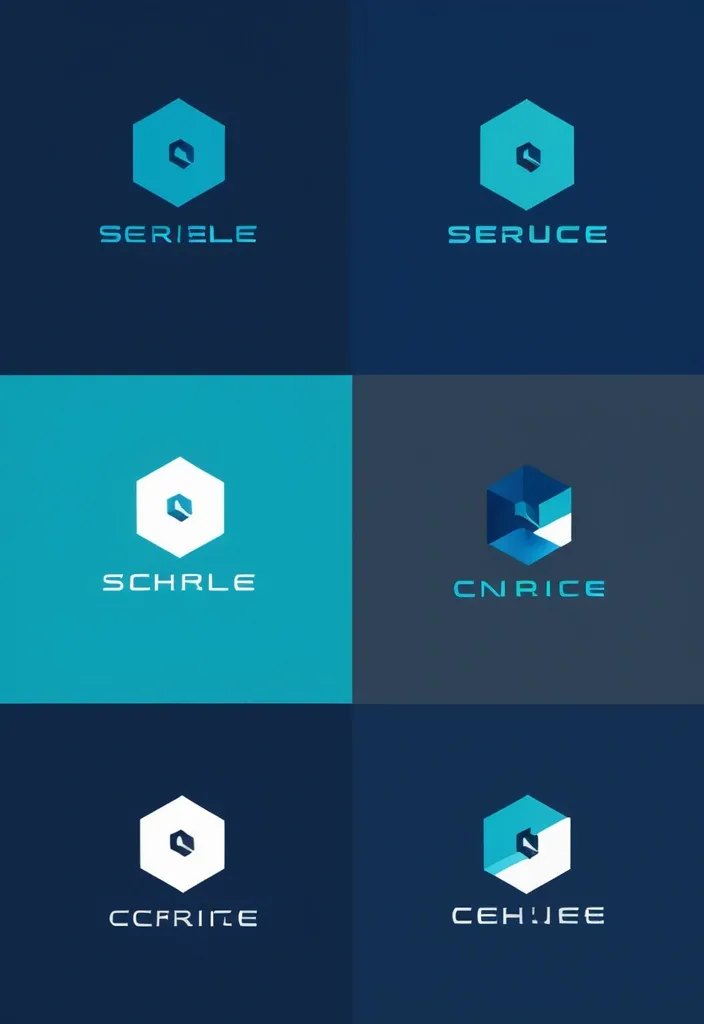
Design a modern and sleek logo for a digital trading platform. The core shape should be a hexagon , symbolizing strength , stability , and connectivity. The logo should convey trust , innovation , and speed — key traits of a cutting-edge trading environment. Incorporate subtle references to charts , graphs , or digital lines to hint at financial markets and data flow. Use a cool tech color palette (like navy , teal , silver , or electric blue) , and aim for a minimalist , professional style that appeals to both retail and institutional traders ,

Fairness means ensuring your analysis doesn't create or reinforce bias. This can be challenging , but if the analysis is not objective , the conclusions can be misleading and even harmful. In this reading , you’re going to explore some best practices you can use to guide your work toward a more fair analysis! Consider fairness Following are some strategies that support fair analysis: Best practice Explanation Example Consider all of the available data Part of your job as a data analyst is to determine what data is going to be useful for your analysis. Often there will be data that isn’t relevant to what you’re focusing on or doesn’t seem to align with your expectations. But you can’t just ignore it; it’s critical to consider all of the available data so that your analysis reflects the truth and not just your own expectations. A state’s Department of Transportation is interested in measuring traffic patterns on holidays. At first , they only include metrics related to traffic volumes and the fact that the days are holidays. But the data team realizes they failed to consider how weather on these holidays might also affect traffic volumes. Considering this additional data helps them gain more complete insights. Identify surrounding factors As you’ll learn throughout these courses , context is key for you and your stakeholders to understand the final conclusions of any analysis. Similar to considering all of the data , you also must understand surrounding factors that could influence the insights you’re gaining. A human resources department wants to better plan for employee vacation time in order to anticipate staffing needs. HR uses a list of national bank holidays as a key part of the data-gathering process. But they fail to consider important holidays that aren’t on the bank calendar , which introduces bias against employees who celebrate them. It also gives HR less useful results because bank holidays may not necessarily apply to their actual employee population. Include self-reported data Self-reporting is a data collection technique where participants provide information about themselves. Self-reported data can be a great way to introduce fairness in your data collection process. People bring conscious and unconscious bias to their observations about the world , including about other people. Using self-reporting methods to collect data can help avoid these observer biases. Additionally , separating self-reported data from other data you collect provides important context to your conclusions! A data analyst is working on a project for a brick-and-mortar retailer. Their goal is to learn more about their customer base. This data analyst knows they need to consider fairness when they collect data; they decide to create a survey so that customers can self-report information about themselves. By doing that , they avoid bias that might be introduced with other demographic data collection methods. For example , if they had sales associates report their observations about customers , they might introduce any unconscious bias the employees had to the data. Use oversampling effectively When collecting data about a population , it’s important to be aware of the actual makeup of that population. Sometimes , oversampling can help you represent groups in that population that otherwise wouldn’t be represented fairly. Oversampling is the process of increasing the sample size of nondominant groups in a population. This can help you better represent them and address imbalanced datasets. A fitness company is releasing new digital content for users of their equipment. They are interested in designing content that appeals to different users , knowing that different people may interact with their equipment in different ways. For example , part of their user-base is age 70 or older. In order to represent these users , they oversample them in their data. That way , decisions they make about their fitness content will be more inclusive. Think about fairness from beginning to end To ensure that your analysis and final conclusions are fair , be sure to consider fairness from the earliest stages of a project to when you act on the data insights. This means that data collection , cleaning , processing , and analysis are all performed with fairness in mind. A data team kicks off a project by including fairness measures in their data-collection process. These measures include oversampling their population and using self-reported data. However , they fail to inform stakeholders about these measures during the presentation. As a result , stakeholders leave with skewed understandings of the data. Learning from this experience , they add key information about fairness considerations to future stakeholder presentations. ,

tgv from paris , brand new lego set ( 2 0 2 1 ) , retail price 4 5 0 , ultra realistic , uhd , 8 ka view from a mountain in Canada , green grass , Indian Summer , leafs falling , fog , warm light , fine details , high definition , realism , sunrise , raytracing , spectacular light , HD , 8k , it starts snowing ,

tgv from paris , brand new lego set ( 2 0 2 1 ) , retail price 4 5 0 , ultra realistic , uhd , 8 ka view from a mountain in Canada , green grass , Indian Summer , leafs falling , fog , warm light , fine details , high definition , realism , sunrise , raytracing , spectacular light , HD , 8k , it starts snowing ,

tgv from paris , brand new lego set ( 2 0 2 1 ) , retail price 4 5 0 , ultra realistic , uhd , 8 ka view from a mountain in Canada , green grass , Indian Summer , leafs falling , fog , warm light , fine details , high definition , realism , sunrise , raytracing , spectacular light , HD , 8k , it starts snowing ,
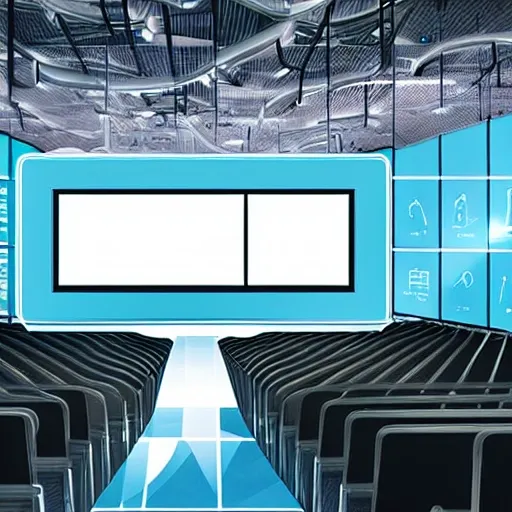
Create an illustration that captures a modern conference setting , the stage lit with spotlight , a large screen behind displaying a stylized AI icon. On stage , a speaker gestures towards the screen , the audience attentively listening. Intermingle the crowd with AI symbols such as robots or holographic screens , suggesting AI's integration into the work environment. The backdrop could subtly incorporate elements like a factory , an office , and a retail store to represent various sectors where AI is making a significant impact. Use a futuristic color scheme with bright blues and silvers to emphasize the high-tech theme. ,

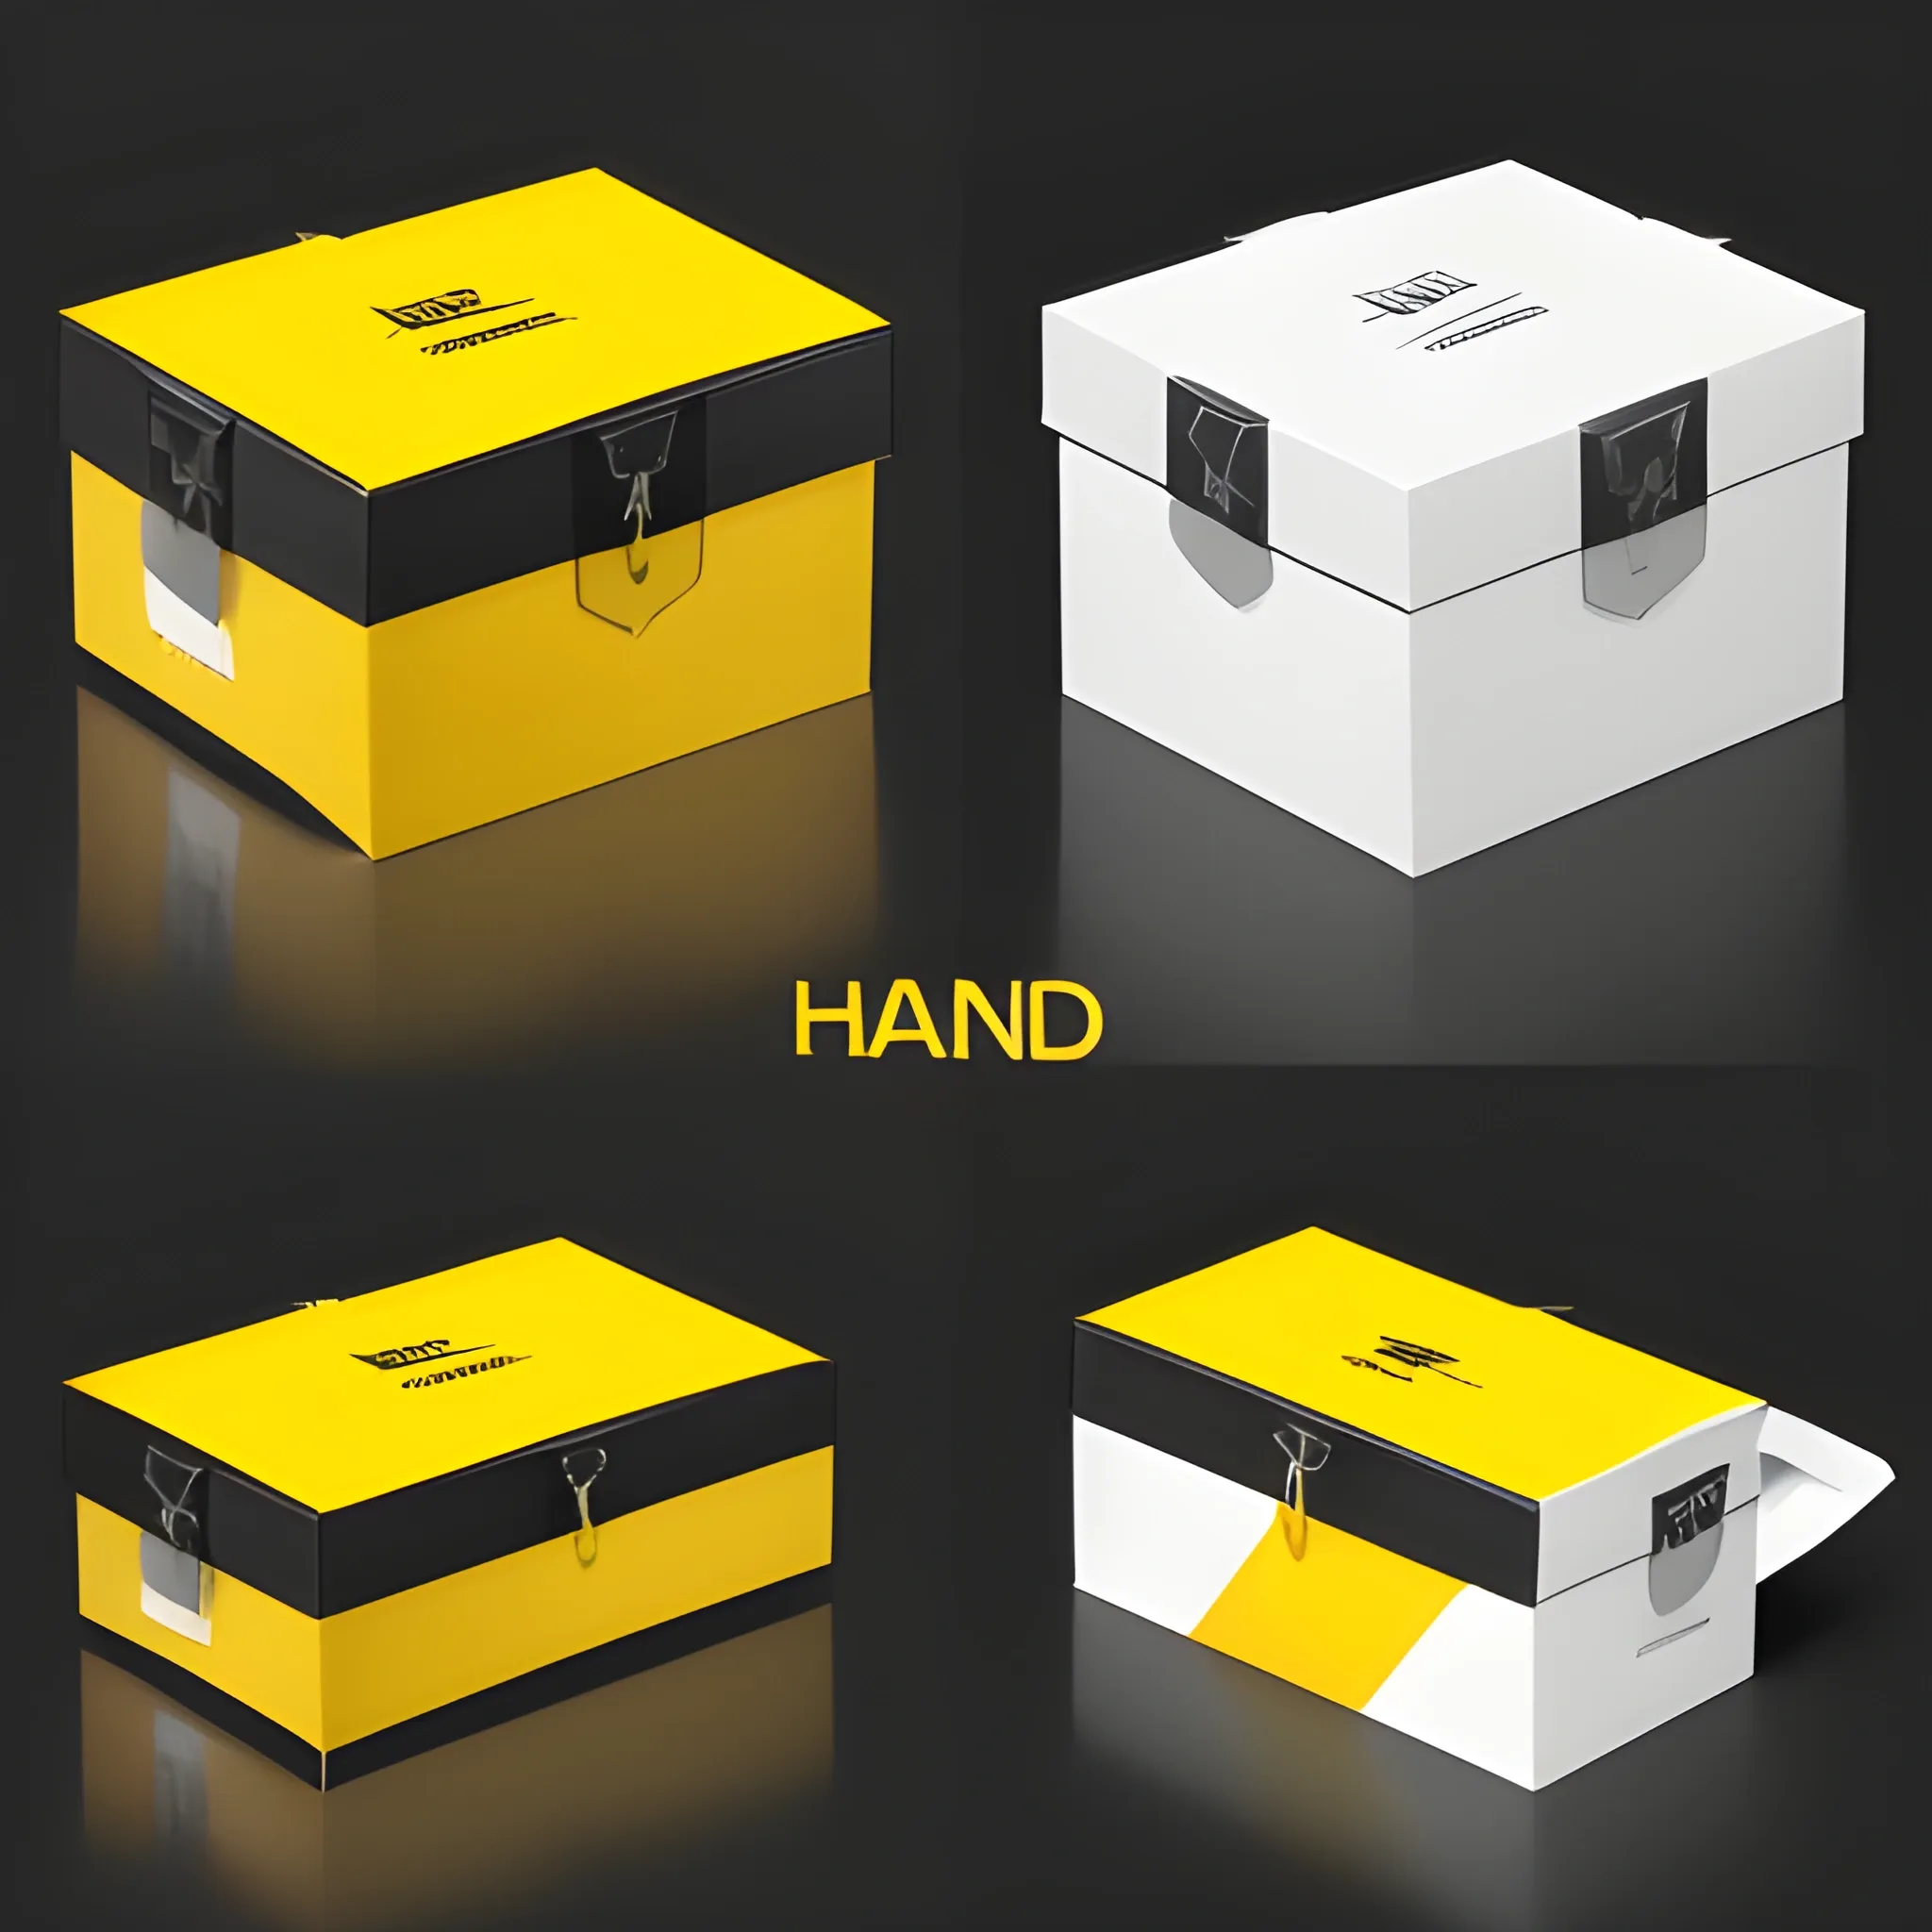
A refined and stylish packaging box design for 'HBK BAND' self-adhesive aluminum repair tape. The design should maintain the original logo with the red and black segmented layout , ensuring the yellow color in the logo is bright and not gold. The box should have a sleek black background. Place the 'HBK BAND' logo prominently at the top , preserving its exact form and colors. Use brand colors: bright yellow , red , black , and white throughout the design. Include clear , sharp text to highlight product features such as 'Flexible Aluminum of Latest Generation' , 'Cold Application' , and 'High Adhesion'. Display technical details like thickness , adhesion strength , and application temperature on the back of the box in a neat and readable format. The design should also feature an image of the aluminum tape roll , emphasizing its metallic texture. Ensure the overall design is elegant , modern , and suitable for retail shelves , with no blurriness in the text or graphics ,

tgv from paris , brand new lego set ( 2 0 2 1 ) , retail price 4 5 0 , ultra realistic , uhd , 8 ka view from a mountain in Canada , green grass , Indian Summer , leafs falling , fog , warm light , fine details , high definition , realism , sunrise , raytracing , spectacular light , HD , 8k , it starts snowing , 3D ,
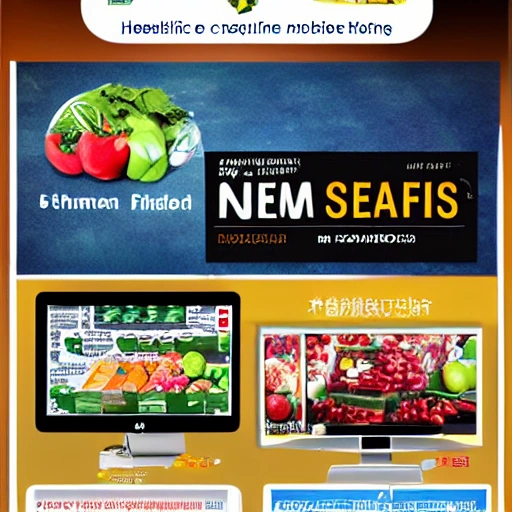
Hema Fresh is a new retail fresh supermarket brand under the Alibaba Group , which debuted in 2015. Hema Fresh is committed to providing consumers with high-quality , fresh , healthy , and safe food and fresh products through digital technology and intelligent supply chains , as well as offering fast delivery and convenient online shopping experience. Hema Fresh has stores across the country and provides online sales services through mobile applications and e-commerce platforms. need 5th Anniversary Celebration Poster in chinese. , Water Color , ,

In the center of the image , place a large internet icon representing the internet as the foundation of the digital economy. Radiating from the internet icon , depict multiple curves extending towards the periphery , symbolizing the penetration of the internet's influence into various industries. At the end of each curve , add small icons or symbols representing different industries such as finance , retail , healthcare , education , etc. , to demonstrate the impact of the digital economy on each industry. At the top and bottom of the image , use arrows to represent the sustained impact and promotion of the digital economy on the economy. The arrows can point upwards to indicate economic development or downwards to indicate economic influence. On the entire background of the image , incorporate stylized charts and data visualization elements such as line graphs , bar charts , pie charts , etc. , to emphasize the importance of the digital economy and the role of data within it. ,