Search Results for API
Explore AI generated designs, images, art and prompts by top community artists and designers.

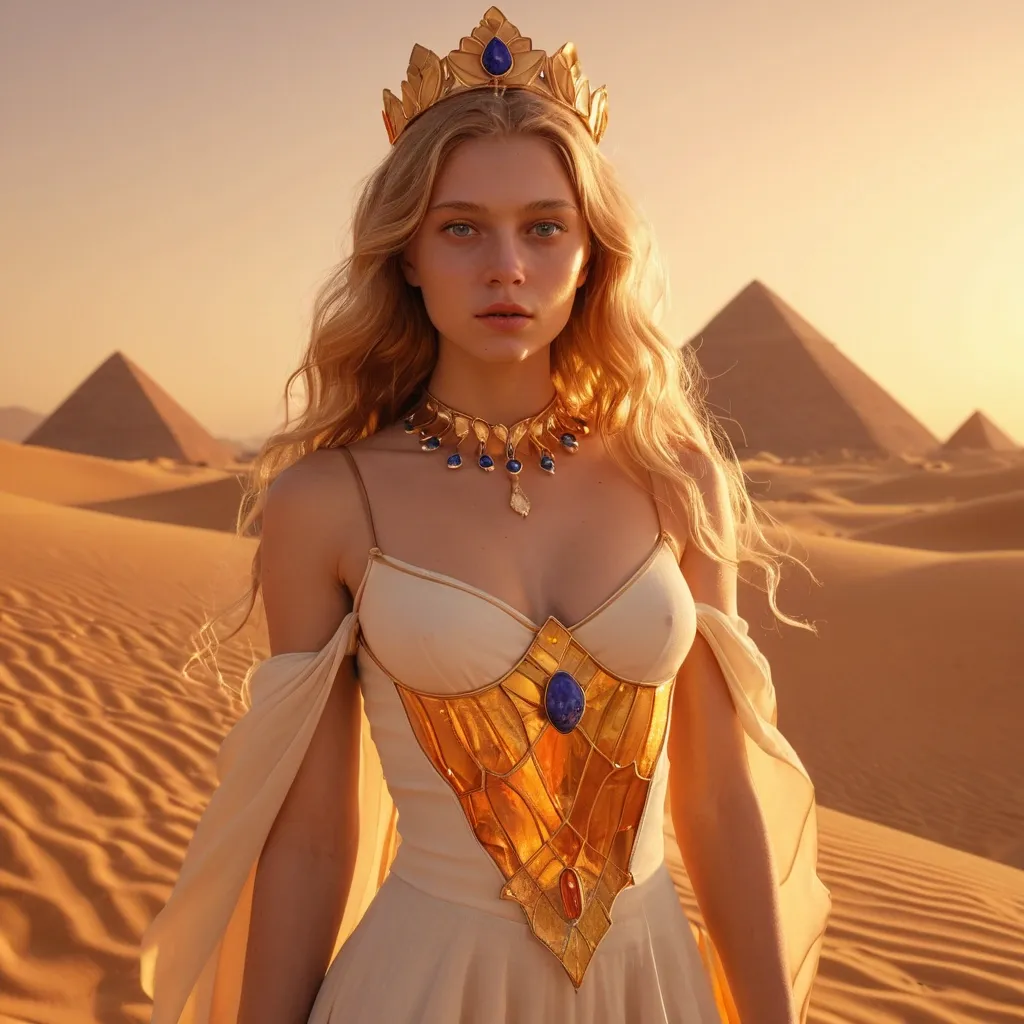
beautiful woman with wide ice-blue eyes , honey-blonde waves , porcelain skin with natural rose tones , honey gold in natural waves sun-lightened at the tips in warm light , luminous warm skin with natural healthy glow , striking feminine beauty , the warm striking gaze of someone in complete natural command , wearing royal court dress of layered white and gold linen wide gold and carnelian girdle spectacular pectoral of lapis and gold gold ear cuffs white lotus crown , set in desert at golden hour with the Sphinx visible behind her sand dunes glowing amber and sienna sky gradient rose to violet oil lamps flickering in the warm foreground , rich amber torchlight from dozens of oil lamps filling the space with warm gold , a single orange traffic cone visible in the extreme far background , dramatic low angle full body architecture as background full figure rising , full body head to feet entirely visible , hyperrealistic CGI render subsurface skin scattering warm volumetric light vibrant tones 8K ,

Ultra-realistic cinematic miniature photography , a vertical spiral notebook lying on a rustic wooden desk , clean lined paper filled with realistic pencil sketches. Eight different humorous scenes featuring the same tiny realistic man (finger-sized , identical face in every scene , consistent proportions) naturally interacting with hand-drawn doodles that appear alive. He climbs a hand-drawn ladder emerging from a sketched hole in the notebook , as if escaping into another world. Perfect blend between reality and graphite illustrations , macro photography , cinematic storytelling , ultra-detailed textures , soft natural lighting , shallow depth of field , RAW DSLR quality , 8K , no text , no watermark. ,
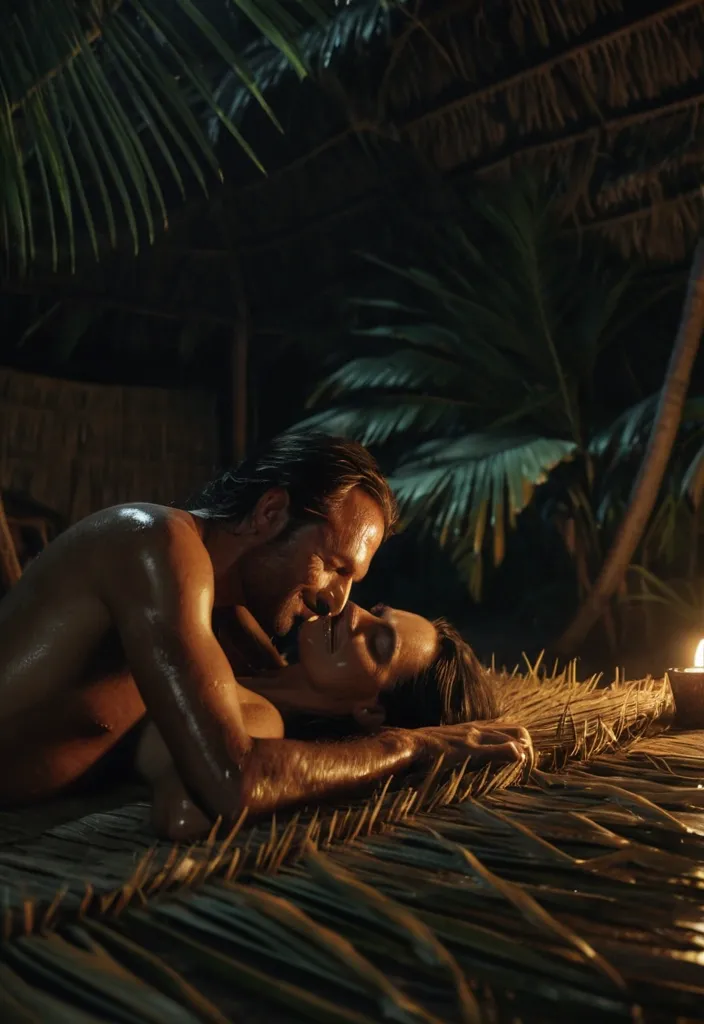
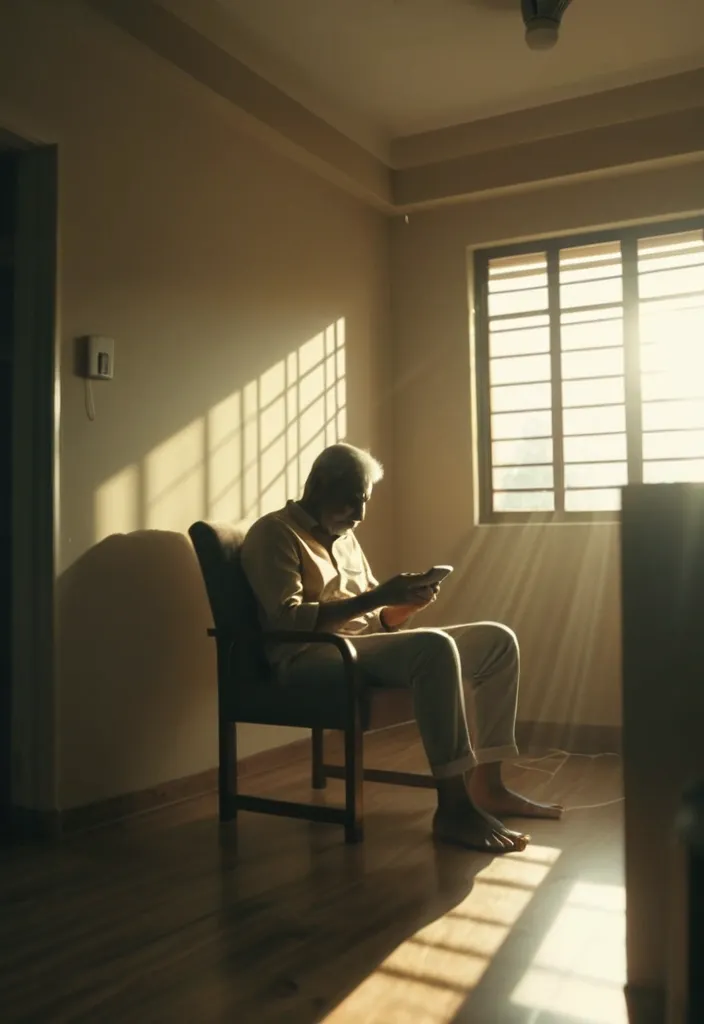
Medium close-up , inside a dilapidated thatched hut , sweltering summer night , mosquitoes buzzing. A young girl sleeping peacefully on a straw mat , a boy sitting beside her gently fanning her with a large palm leaf. Sweat beading on his forehead , but a contented smile on his lips. Silent protection and sacrifice. Warm candlelight , chiaroscuro , cinematic , photorealistic , 8K , tender moment. ,
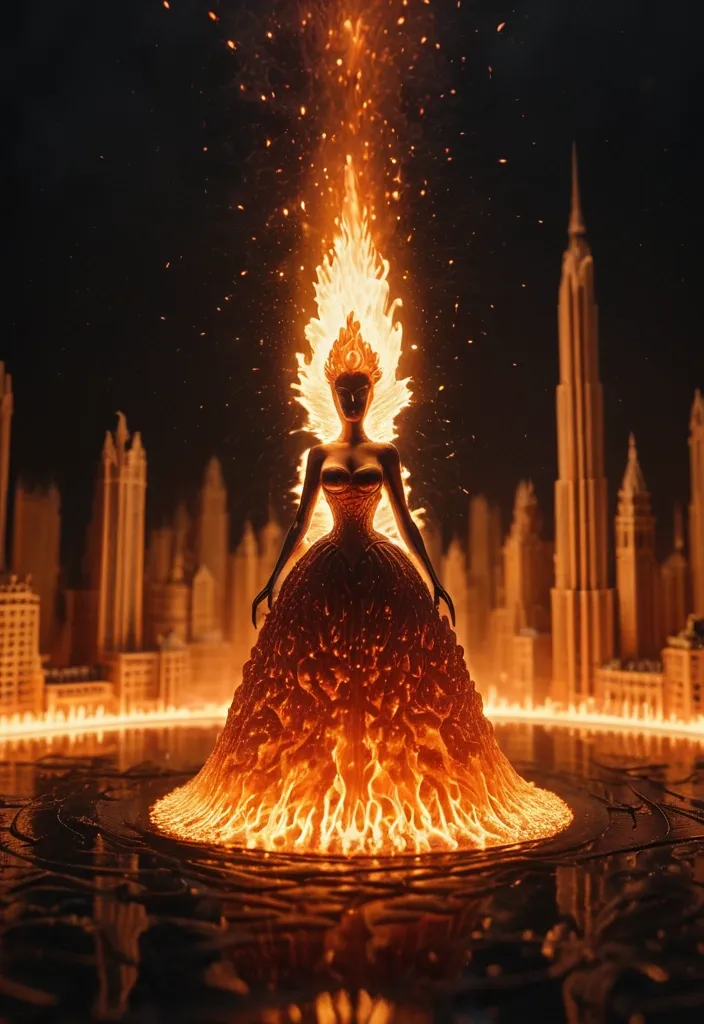
Extreme macro shot of a single candle wick with a flame above it , meticulously shaped to resemble a thick flamed female face , a female in dress standing pose entirely through stippling , in a dark room. The background is black , silent , intimate. Wax melts slowly down the candle , forming translucent golden rivers. Opening frame: the camera pushes closer into the flame until the flickering fire fills the entire frame. At the 2-second mark , buildings become visible inside the flame. A tiny city exists within the fire , skyscrapers made of light , streets made of glowing embers , crowds moving like sparks through golden avenues. The camera enters the flame and becomes part of this miniature burning metropolis. Inside , the city is alive and unstable. Towers bend with every flicker. Roads flare and vanish. People made of fire move through the streets , leaving trails of smoke behind them. The sky above is the dark room outside the candle , seen as an infinite black universe. VFX escalation: the candle begins burning faster. Wax rivers flood the city from below like molten glass. Flame-winds tear through streets , reshaping buildings into abstract sculptures of heat and light. Velocity ramp: a burning tower collapses in slow motion , its sparks suspended mid-air like golden snow. Final moment: the camera pulls back out of the flame. The candle is nearly extinguished. Just before the flame dies , the tiny city lights flicker one last time. Macro surrealism , miniature city inside fire , molten wax physics , ember particles , extreme shallow depth of field , dark poetic atmosphere , 4K. ,
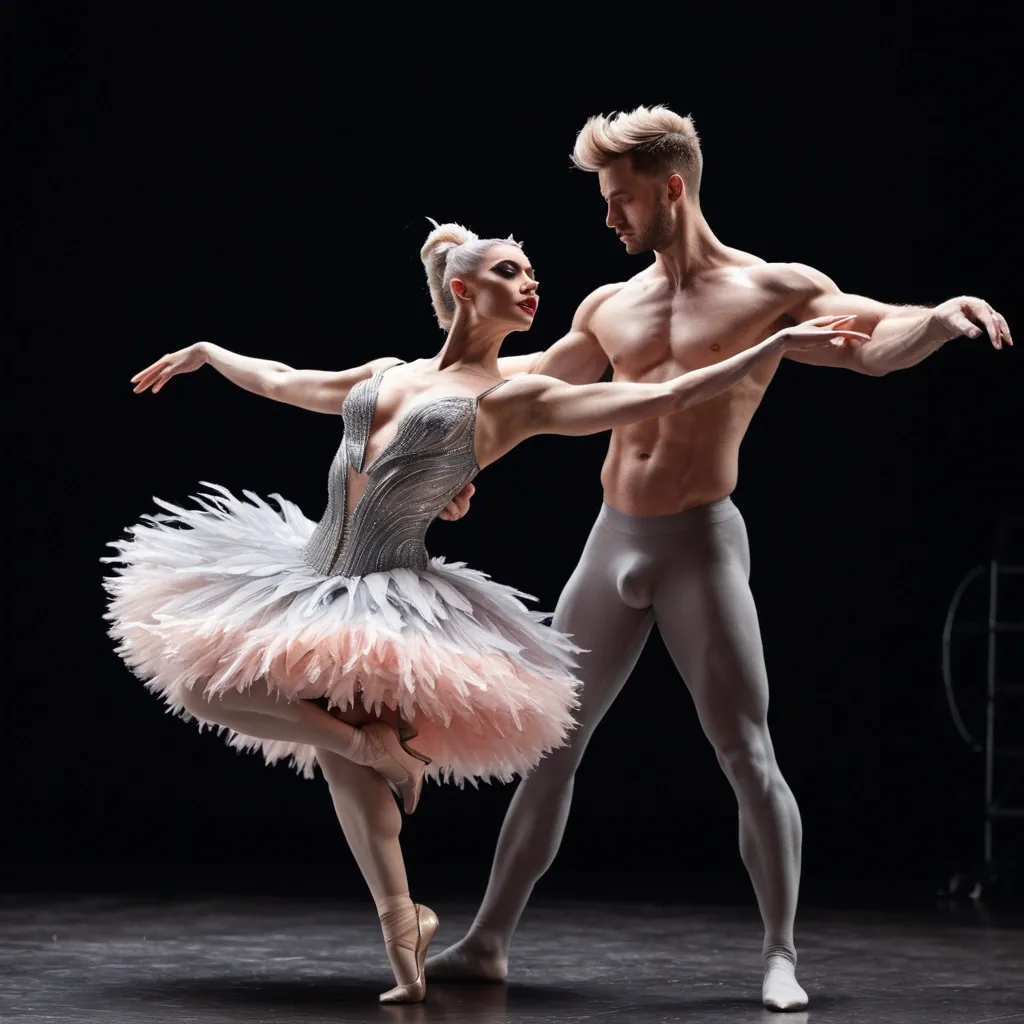
A ballet slim dancer in a sparkling , flamingo feather tutu leans forward beside a fluffy gray cat , both lit by warm , dramatic studio lighting. Main Subject: A person with blonde hair styled in an elaborate , voluminous updo and wearing a tutu with ornate , flamingo feathered like layers is shown in a side profile pose. The person is standing on pointed shoes with one leg bent and lifted behind , the other leg supporting their balance , and their arms are held close to their body. Their eyes are downcast and their face is turned toward a gray , fluffy cat sitting on the floor. The cat has upright ears , a rounded fluffy body , and a small open mouth positioned near the dancer’s face as if the cat is sniffing or reaching toward her. Setting: The scene appears to be indoors in a studio-style environment , with a dark , plain background and a wooden floor visible at the bottom. Lighting is warm and focused , creating soft shadows and a glowing effect around the dancer’s hair and costume. Visual Details: The dancer’s tutu is flamingo feathers with layered , translucent-looking elements , including hanging or draping strands. The dancer wears a toned bodice with feathers embellishments and a high level of sparkle. Their pointed shoes are light-colored with visible straps , and the overall costume includes fine glitter and chain-like details. The cat’s fur is light gray with darker shading , and it stands out clearly against the darker background. The camera angle is slightly elevated and turned toward the dancer’s side , emphasizing the extended pose and the closeness between the dancer and the cat. ,
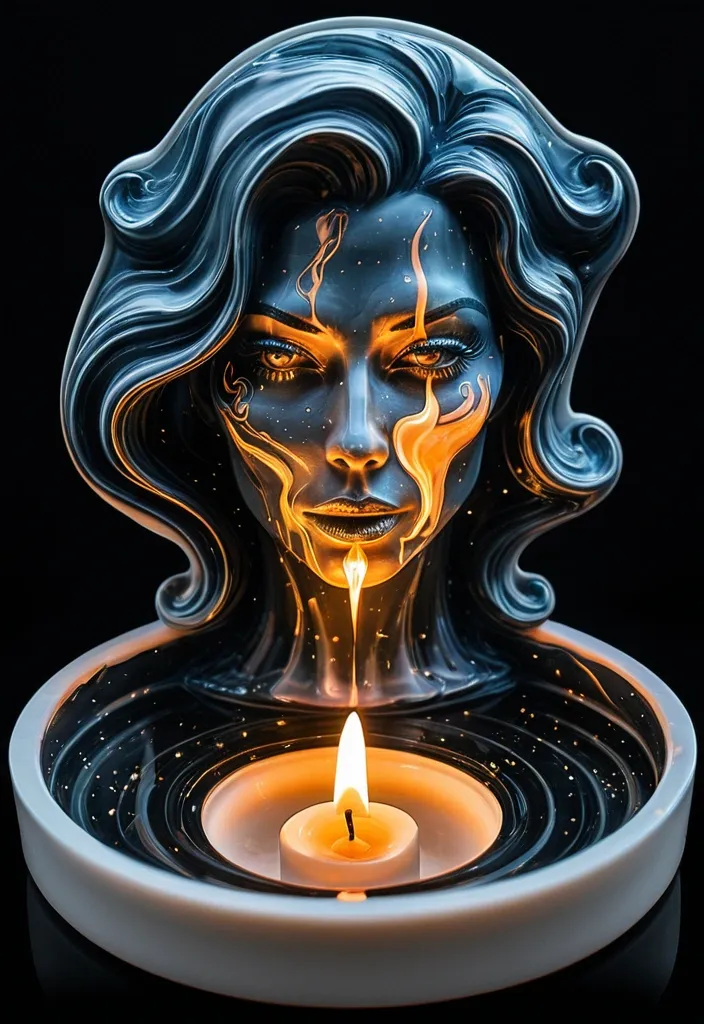
create silky porcelain glass close-up double exposure of a portal into the City landscaping blending in the glowing in the joint in an ashtray , single candle wick with a small flame above it , meticulously shaped to resemble a thick flamed female's face , in the Hand , hand skin color wisps contrasting with the black background , comic Milky Way , 25d rendering , embossed ,
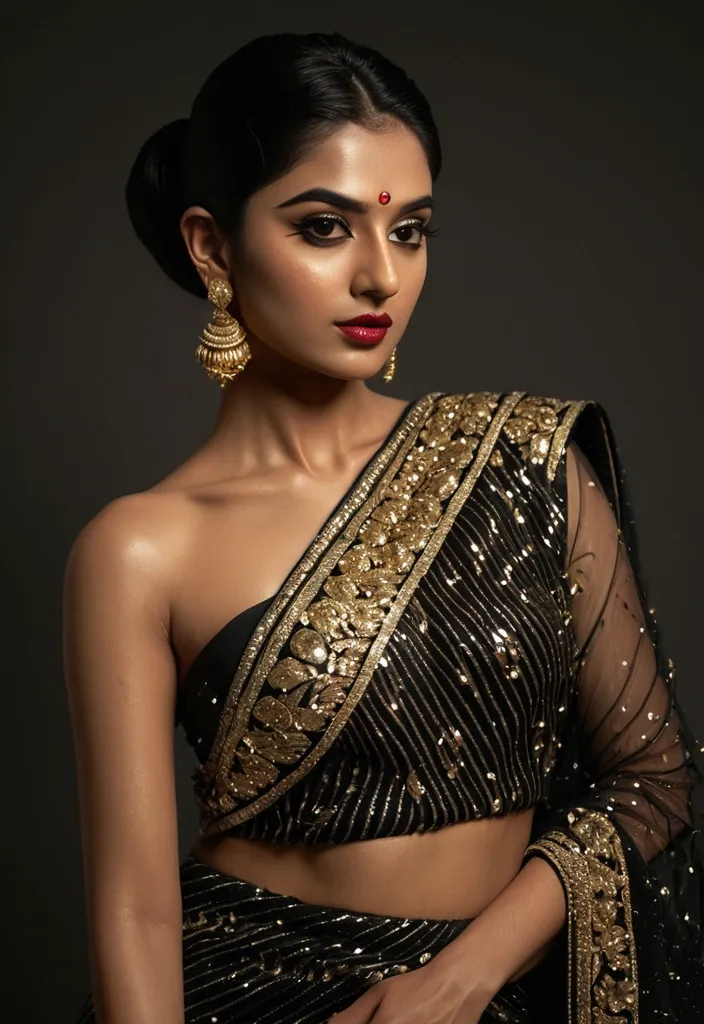
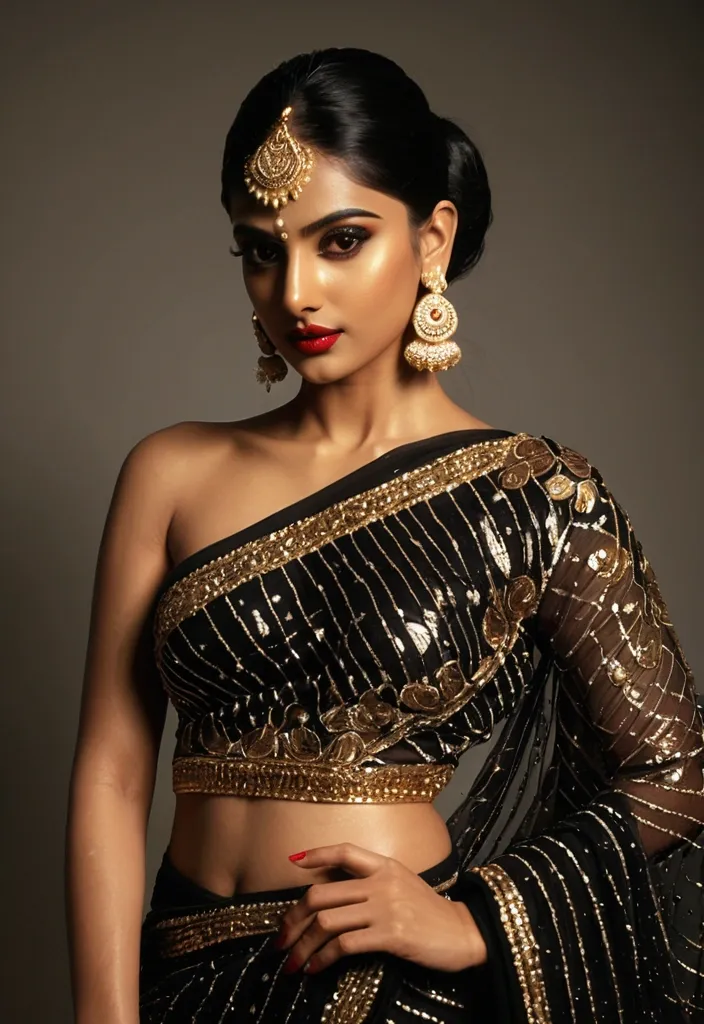
"Beautiful fair Indian model showcasing Sidhidata black net embroidered sequin saree with heavy sequence work , modern draping style revealing one shoulder. She has radiant skin , perfect winged eyeliner , vibrant matte red lipstick , and oversized golden jhumka earrings that sway elegantly. Soft studio lighting making the sequins shimmer , minimal jewelry , sleek bun hairstyle , elegant and graceful pose , cinematic fashion photography , highly detailed , photorealistic" ,
"Beautiful fair Indian model showcasing Sidhidata black net embroidered sequin saree with heavy sequence work , modern draping style revealing one shoulder. She has radiant skin , perfect winged eyeliner , vibrant matte red lipstick , and oversized golden jhumka earrings that sway elegantly. Soft studio lighting making the sequins shimmer , minimal jewelry , sleek bun hairstyle , elegant and graceful pose , cinematic fashion photography , highly detailed , photorealistic" ,

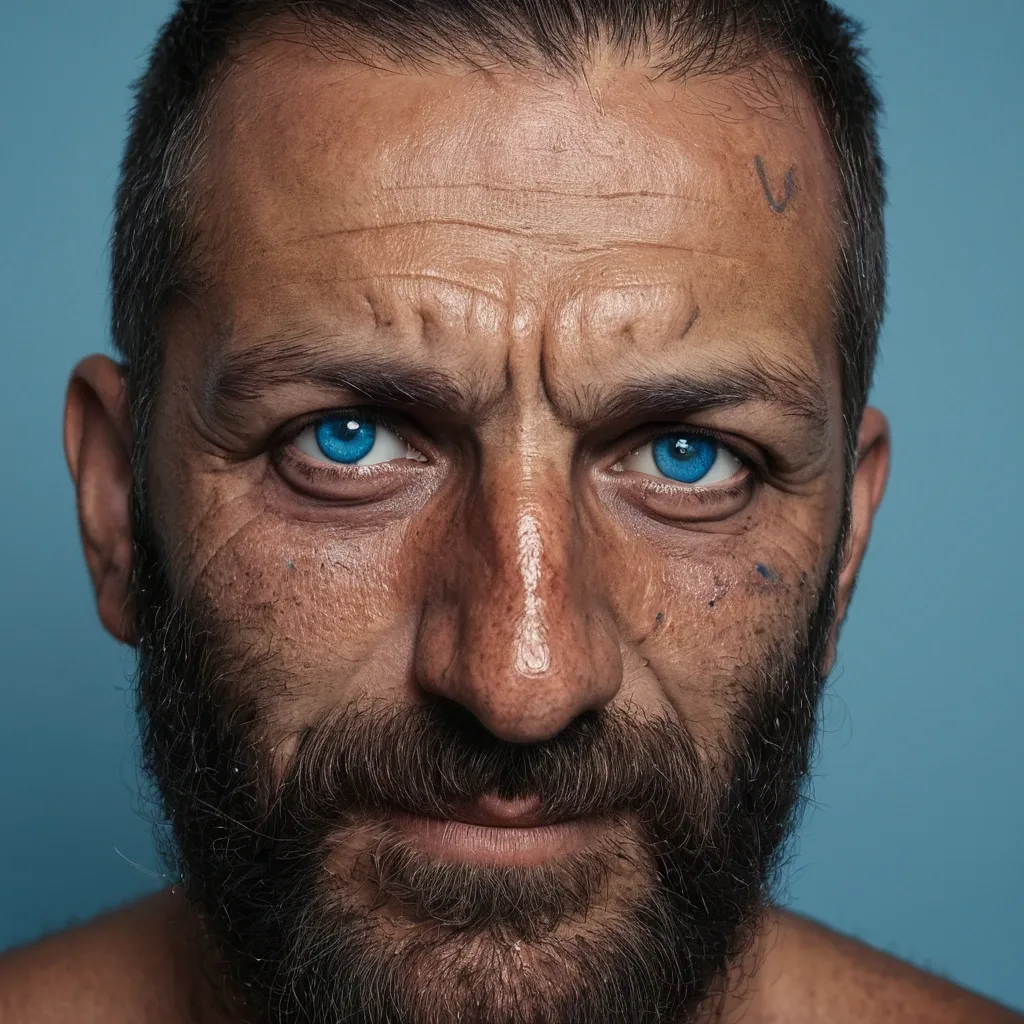
picture of a sexy girl , in alace Corset lace Tops sheer , perfect face , satin translucent micro skirt sheer , star trek Enterprise micro dress , red stiletto high heels tan , thigh high stockings , symmetrical eyes , legs open , A spunky vivacious young woman , on deck of the starship enterprise , leaning on the captain's chair both hands looking back at camera , is a junior officer , with curly bouncy long blond hair , with body of , Megan Fox , in white satin translucent micro mini sheer , star trek Enterprise micro mini dress , red stiletto high heels tan thigh high stockings , symmetrical eyes , legs open , beautiful symmetrical face , revealing chest open sheer translucent low cut silk shirt , cherry red full lips sheer short translucent silk sheer micro mini dress , with slit on both sides , full body shot , , Photorealistic portrait of a beautiful woman. Photograph , Hyper realistic , Photorealistic , Photorealism , body symmetrical anatomy.zoomed out , full body portrait , photorealistic skin , Persian hauntingly beautiful symmetrical face with hypnotic deep dark blue eyes , f 5.6 85mm , extremely detailed , maximum texture , maximum details , dramatic clair obscur , ultra-realistic , soft shadows RHADS , low angle shot fan cam , cinematic lighting , epic cinematic angle , visual clarity , 85mm , UHD , 32k , 16k , 8k , 3D shading , Tone Mapping , Ray Tracing Global Illumination , Diffraction Grating , Crystalline , Lumen Reflections , Super-Resolution , gigapixel , color grading , retouch , enhanced , PBR , Blender , V-ray , Procreate , zBrush , Unreal Engine 5 , Cinema 4D , ROMM RGB , Adobe After Effects , 3DCG , VFX , SFX , FXAA , SSAO , 3D , high fantasy , cinematic lighting , romantic--ar3:2 --v 4 --q 2 full body shot ,

Kinetic motion graphics animation. The 3D logo layers drop down instantly from the top frame , hitting the center with an elastic , snappy bounce. The text 'LayerAssets' pops into view letter-by-letter with a rapid spring scale effect. Fast start , heavy cushioned easing at the end. Solid black background. ,

Kinetic motion graphics animation. The 3D logo layers drop down instantly from the top frame , hitting the center with an elastic , snappy bounce. The text 'LayerAssets' pops into view letter-by-letter with a rapid spring scale effect. Fast start , heavy cushioned easing at the end. Solid black background. ,

Kinetic motion graphics animation. The 3D logo layers drop down instantly from the top frame , hitting the center with an elastic , snappy bounce. The text 'LayerAssets' pops into view letter-by-letter with a rapid spring scale effect. Fast start , heavy cushioned easing at the end. Solid black background. ,
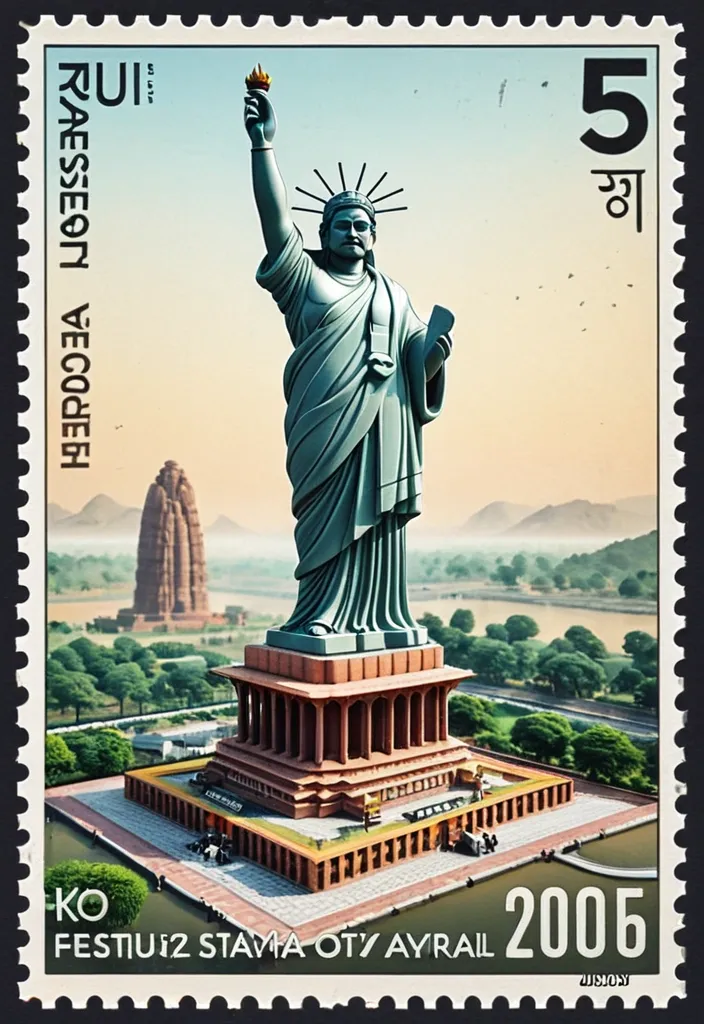
A hyper-realistic macro photography shot of a giant , freestanding vintage postage stamp from Statue of Unity , Ekta Nagar in the Narmada district of Gujarat , standing upright against a seamless , soft , color-coordinated pastel studio background. The stamp features an intricately detailed 3D diorama of the most iconic and recognizable landmark from Statue of Unity that pops out and actively breaks the perforated borders , extending outward into the physical space. Lush flora and fauna native to Statue of Unity grows and spills out from the bottom right corner of the stamp's frame. A tiny , miniature figurine of a person wearing recognizable traditional cultural attire from Statue of Unitystands on the ground at the bottom left , looking up in awe at the massive stamp , establishing a striking miniature world scale. The stamp's design includes the word "Statue of Unity" in classic serif typography , subtext in the local language , a realistic local currency denomination , and a stamped black ink cancellation postmark in the top right corner featuring the capital city of Statue of Unity and a realistic date. Soft , diffused , magical studio lighting with a tilt-shift lens effect and shallow depth of field. Gently floating botanical elements native to Statue of Unity drift through the air around the scene. 8k resolution , octane render , highly detailed miniature art. ,
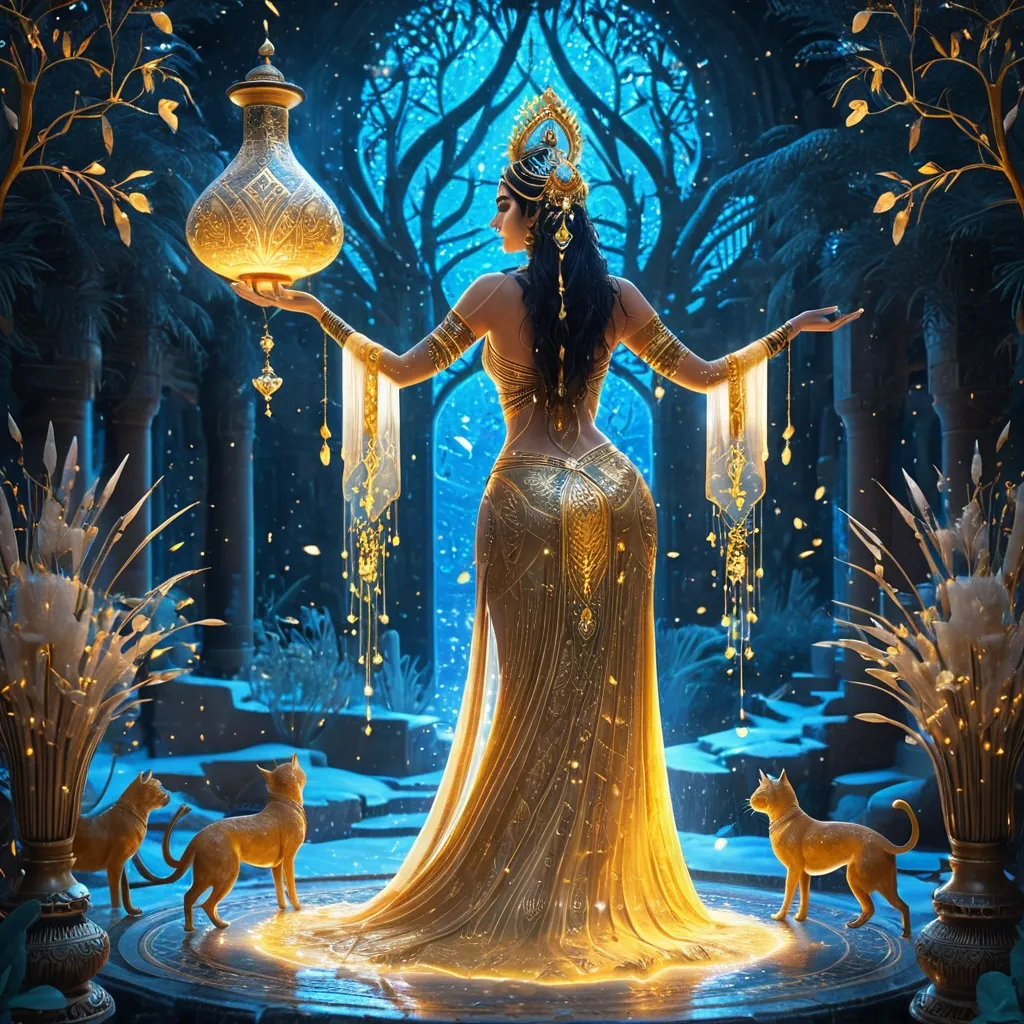
Backside view on Seductive hourglass figure of a persian female beauty as Anahita goddess of Persia , wearing flowing liquid gold dress and sheer flowing veil. She is wearing golden intricate diadem with a intricate lapis lazuli on her forehead. She is dancing in the Persian kitchen while pouring swirling mist of sparkling cuneiforms from a silver vase. Surrounded by vibrant reeds , small lions and cats , and glowing cuneiform , she emanates a divine , ethereal light that illuminates the entire landscape. , . Floating Persian cuneiform , bird morphing into jewelry , Huluppu Tree swaying above her , glowing skin with glowing cuneiforms. , , Dreamlike cinematic digital painting with realistic translucency; ethereal volumetric glow and glittering particles; high-fidelity texture on the ice; subtle painterly detail in the flowers and foliage. 8k , ultra detailed , masterpiece , best quality , intricate details , sharp focus. ,
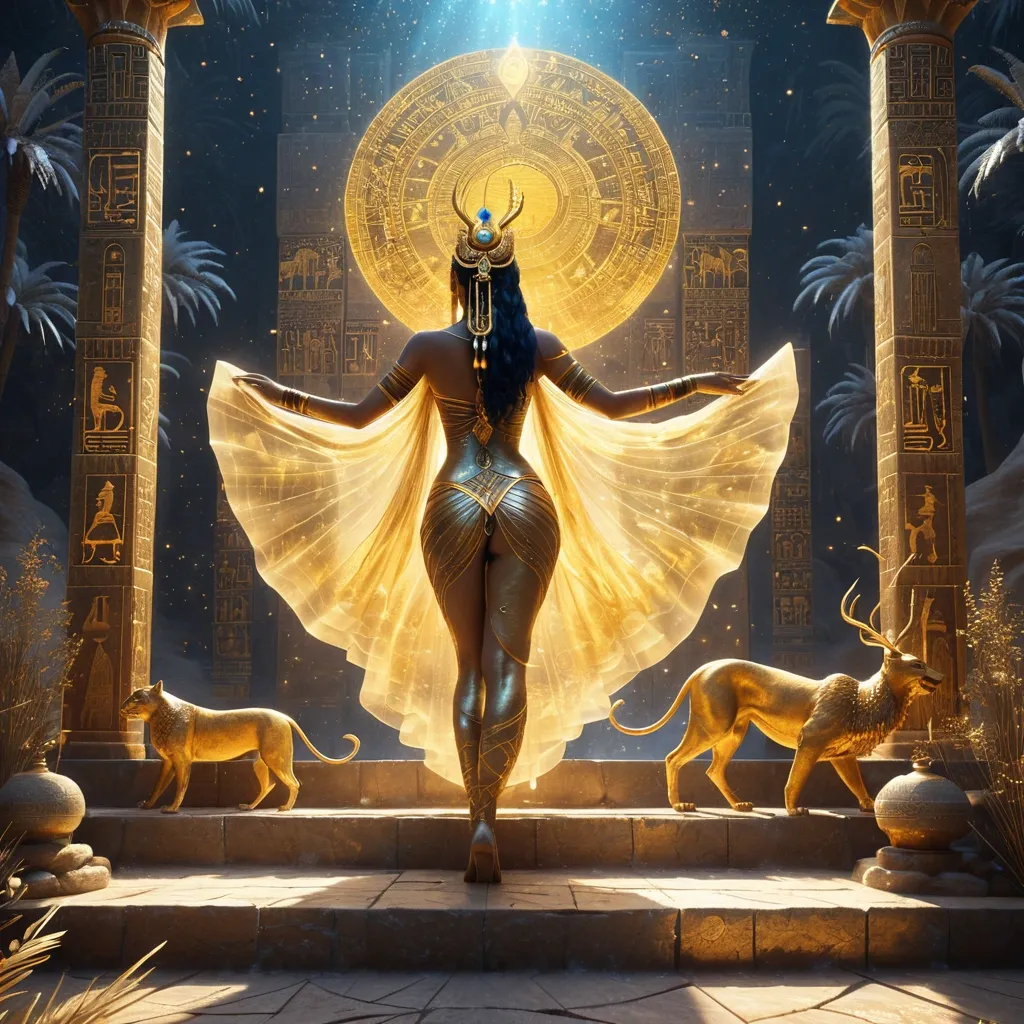
Backside view on Seductive hourglass figure of a persian female beauty as Inanna goddess of Mesopotamia , wearing flowing liquid gold kaunakes and sheer flowing fabrics. She is wearing golden horn with a intricate lapis lazuli on her forehead. She is dancing at the steps of ziggurats Tower of Babel while pouring swirling mist of sparkling cuneiforms from a golden Tuppi simati. Surrounded by vibrant reeds , small lions and cats , and glowing cuneiform , she emanates a divine , ethereal light that illuminates the entire landscape. , . Floating Mesopotamian cuneiform , bird morphing into jewelry , Huluppu Tree swaying above her , glowing skin with glowing cuneiforms. , , Dreamlike cinematic digital painting with realistic translucency; ethereal volumetric glow and glittering particles; high-fidelity texture on the ice; subtle painterly detail in the flowers and foliage. 8k , ultra detailed , masterpiece , best quality , intricate details , sharp focus. ,
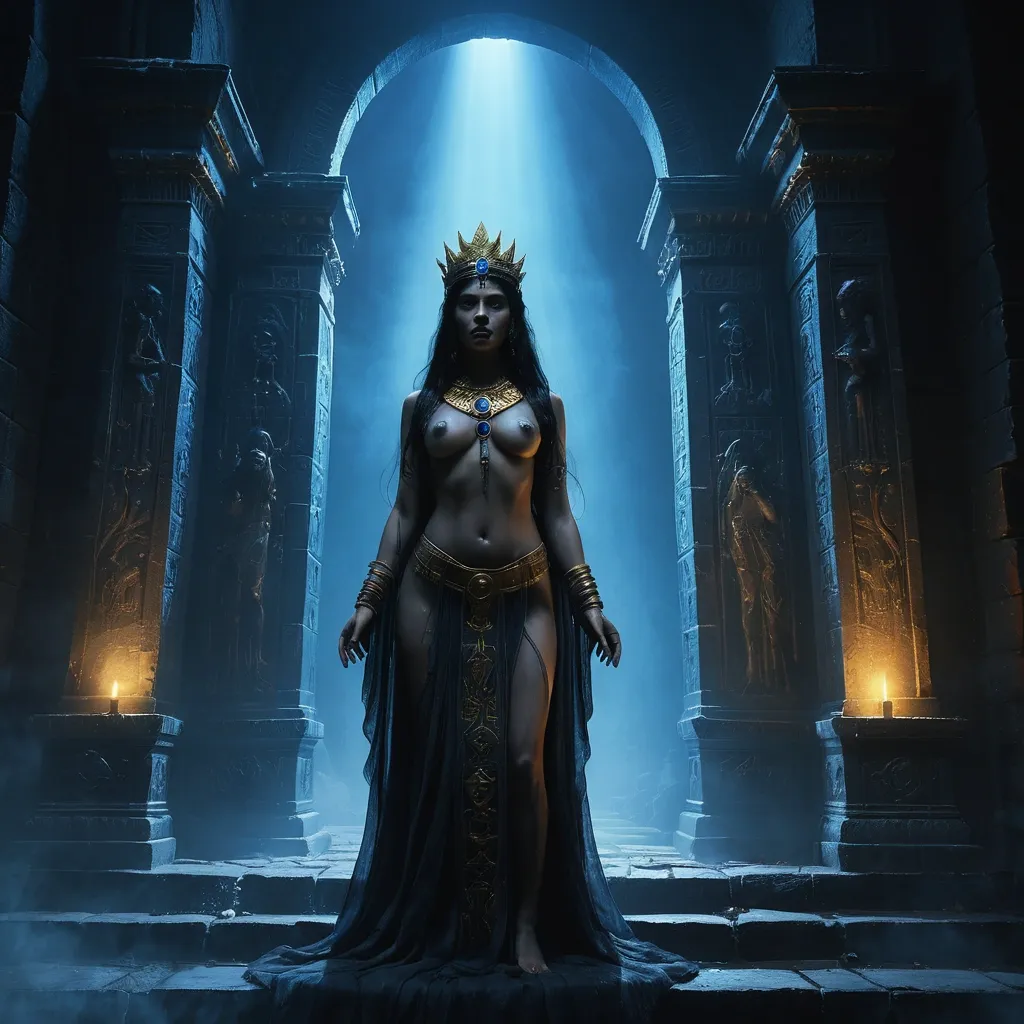
Subject: Photorealistic epic scene , the goddess Ishtar standing defiantly before the massive lapis lazuli gates of the Underworld , The strikingly beautiful and alluring Mesopotamian goddess with dark kohled eyes , full lips , olive skin , long black hair adorned with gold ornaments , wearing layered sheer ceremonial robes that flow around her curves , jeweled collar and golden bracelets catching the light , gates carved with demonic bas-reliefs towering above her , eerie cold blue light emanating from beyond the threshold contrasting with her warm golden divine glow , atmospheric fog at ground level , her crown of eight-pointed stars casting subtle radiance , intense dramatic chiaroscuro lighting , cinematic composition , hyperrealistic skin and fabric textures , ancient myth as documentary photography , 8K ultra-detailed. , dark against a glowing background. Setting: Steps of yellow sandstone , gates carved with demonic bas-reliefs towering above her , eerie cold blue light emanating from beyond , atmospheric fog at ground level , Vertical structure in objects and foliage for compositional rhythm. Color Palette: Deep charcoal and black. One source of golden amber light source from herself , Another source of cold blue light glowing from beyond and below. , blooming through deep shadow. Style: Rembrandt-inspired chiaroscuro and tenebrism creating luminous light emerging from deep velvety darkness — darkness rendered with velvety depth and luminous quality rather than flat black. Painterly glazing with confident calligraphic brushwork , spontaneous economy of strokes , and ink-wash atmosphere. Dramatic light-dark contrast , soft atmospheric bloom , and expressive brush energy. Strong rim illumination and subtle backlighting creating a narrow luminous rim along the subject silhouette. ,
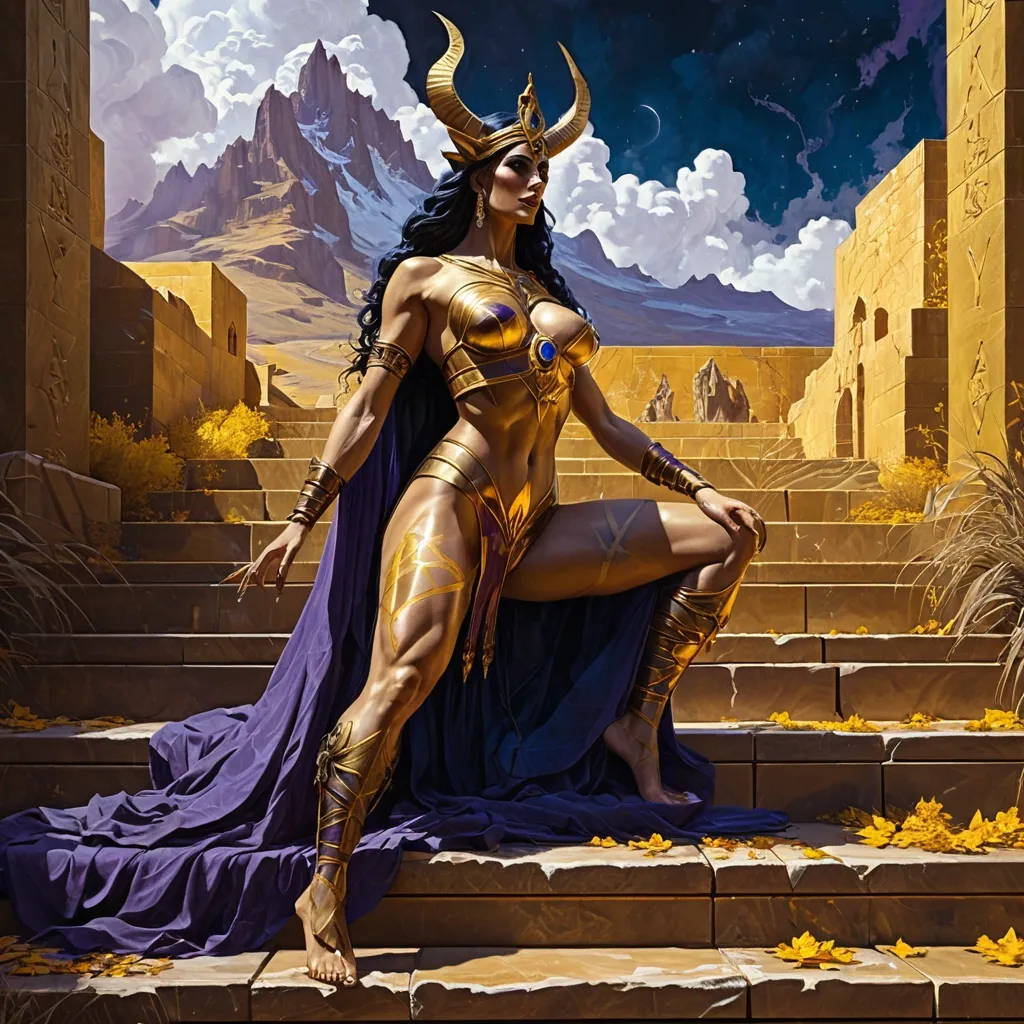
Composition Sideway view. highly detailed in 8k resolution A tenebrism style oil painting of a brunette voluptous Iraqi female as Inanna is a woman with a muscular physique , showcasing toned arms , powerful long legs , and firm , bubble-shaped buttocks that emphasize attraction and athleticism. Inanna is depicted showing compassion to aninjured , soiled small Lion resting on steps of ziggurat. Her horned helmet with a central crown gemstone lapis lazuli was dropped on the ground. Inanna wear gold and deep blue short robe , with arcane cuneiforms subtle woven in , and eight point star. This poignant scene , rendered with the sfumato , chiaroscuro , and impasto thick brush techniques , captures atmospheric perspective and depth of field to evoke a sense of depth and transcendence. The dramatic lighting , akin to the light and dark contrasts seen in the art style from the renaissance , adds a deeply emotional and theatrical note to the image. painting by Jko , Norman Rockwell and Alex Ross and Gil Elvgren and Artgerm and Simon Dewey making a in full watercolor art style of. Background is yellow sandstone steps and walls of a ziggurath with blooming reeds in water pools. Faraway roiling clouds of thunder cover the mountain peaks. painting by Jko , Norman Rockwell and Alex Ross and Gil Elvgren and Artgerm and Simon Dewey making a in full watercolor art style of , , , a masterpiece , 8k resolution , dark fantasy concept art , by Greg Rutkowski , dynamic lighting , hyperdetailed , intricately detailed , Splash screen art , trending on Artstation , deep color , Unreal Engine , volumetric lighting , Alphonse Mucha , Jordan Grimmer , purple and yellow complementary colours , A stunningly beautiful oil painting masterpiece with a soft autumn color palette and textures. ,
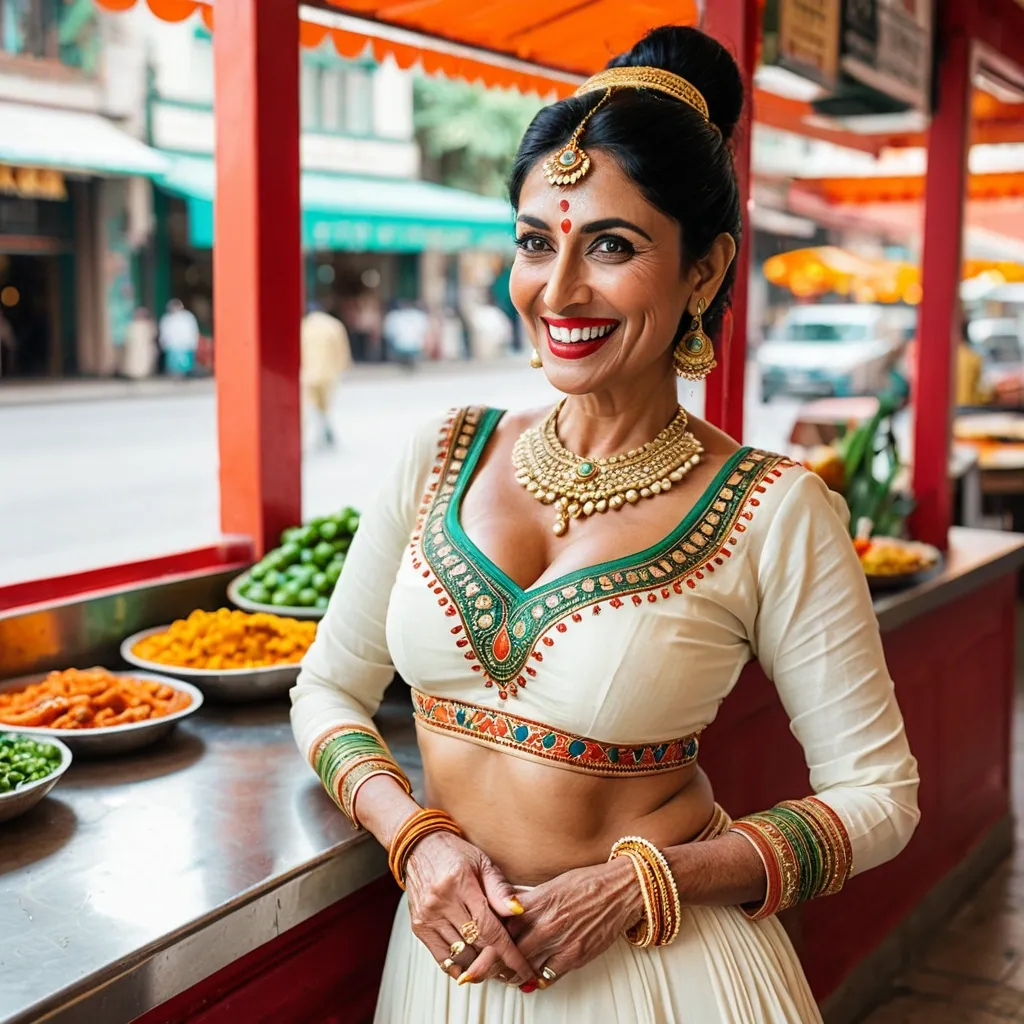
A candid portrait captures a mature woman leaning comfortably against the curved counter of a colorful retro-style indian local vegetables shop. She is positioned slightly left of center , turned toward someone just outside the frame , caught in the middle of a genuine laugh. Her expression is warm and spontaneous , with bright eyes , a broad smile , and slightly flushed cheeks that convey easy happiness and social connection. She wears a Elegant white lehenga-choli with green and orange metallic embroidered borders , fitted long-sleeve blouse with decorative mirror work , matching flowing lehenga , cream-gold dupatta draped over the head , traditional gold necklace , bangles , earrings , maang tikka , small bindi , creating a relaxed bohemian aesthetic. Her dark hair is loosely gathered into a messy topknot , with soft strands escaping around her face and neck. Large hoop earrings add to the casual , free-spirited style. The background is rendered in a creamy blur , emphasizing the shallow depth of field. Out-of-focus patrons occupy market street behind her , while bright red architectural elements and turquoise seating create a lively palette of warm and cool colors. A group of mangos on the counter in the lower left corner , contributing to the casual daytime atmosphere. Natural light pours through windows on the right side of the image , wrapping softly around her face and shoulders and creating a bright , welcoming mood. ,
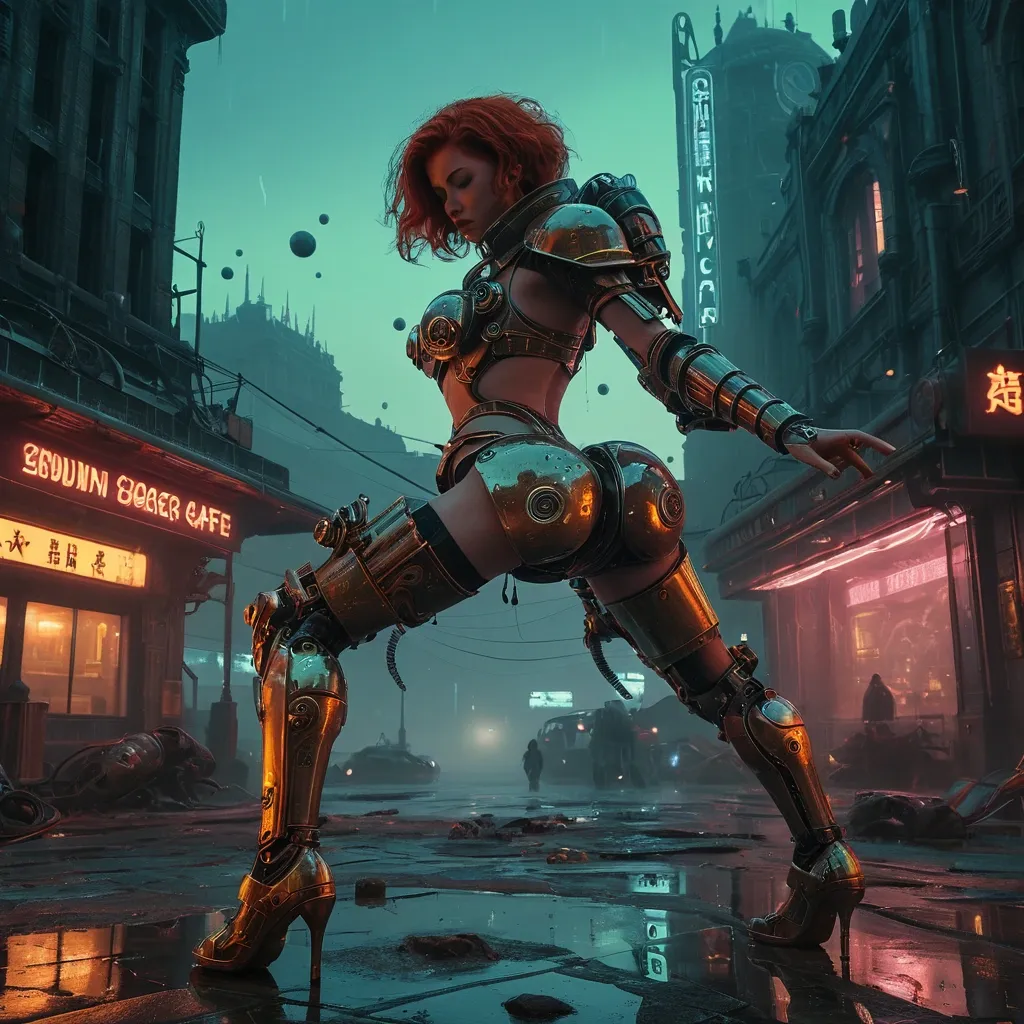
On the right side A majestic mechanical scorpion , gears whirring and steam hissing , traverses terrain. Intricate clockwork details adorn its exoskeleton , with glowing amber optics scanning the horizon. The style is a fusion of steampunk aesthetics , industrial design , and cinematic concept art , with a palette of warm neonpink and metallic silvers. On the left side , Extreme close-up , dramatic chiaroscuro oil painting featuring a woman with red-haired windswept hairstyle and a voluptous physique , showcasing highly defined , toned powerful legs , and firm , bubble-shaped buttocks that emphasize strength and athleticism. in a full-body staggard position with hands wide , , in skimpy , tattered black revealing robes blowing in the wind , eyes glaring in concentration , focus on face , tattered robes covered in subt circuittry , amidst fallen robotic bodies in fear with ravens pecking; atmospheric fog and shadows; The scene is set with her dynamically leaping forward to the camera left knees up while wielding a red futuristic gauntlet , in her right hand wearing bulky futuristic wristcom lunging at the camera outside an old iron and stone cafe among A towering retro-futuristic metropolis at twilight , Hovering drones cast sharp , futuristic lights onto the desolate landscape , reflecting off puddles of toxic rain. The sky is a perpetual twilight , choked with smog and illuminated by the distant glow of a dying star. Inspired by the gritty realism of post-apocalyptic art and the sharp lines of cyberpunk aesthetics , rendered with hyperrealistic detail. The architecture is a blend of art deco grandeur and advanced , impossible geometries. , A retro-futuristic [subject] , melancholic pop-surrealism , structured Art Deco elegance. Neon green-orange highlights , soft yellow-purple shadows , deep blue & red undertones , cinematic lighting , 8k resolution , photorealistic masterpiece ,
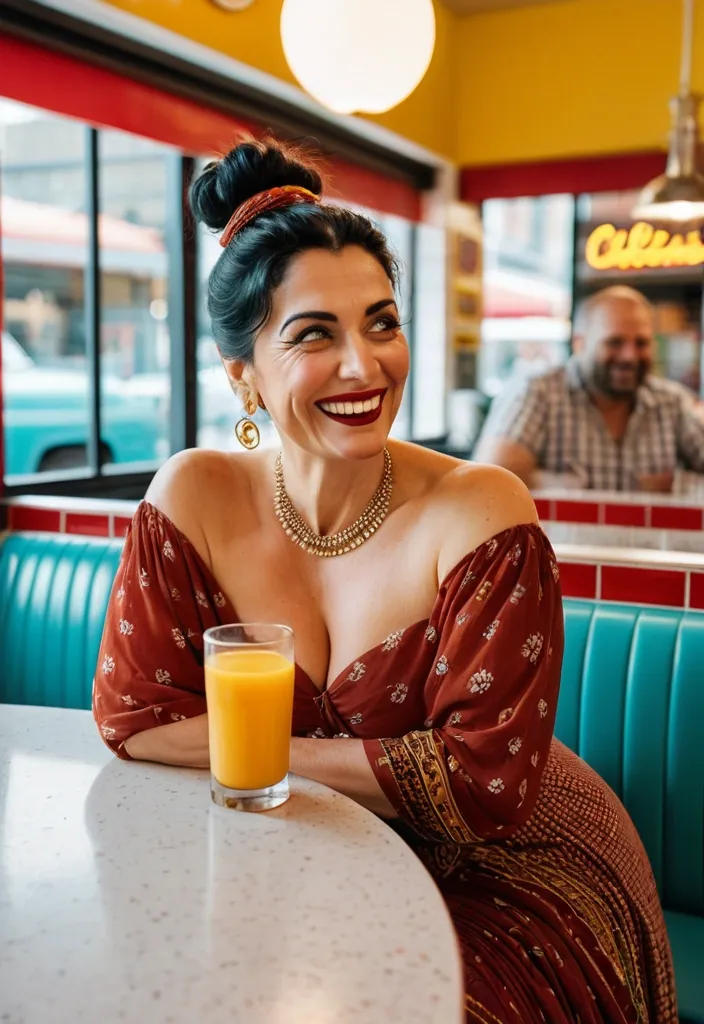
A candid portrait captures a young woman leaning comfortably against the curved counter of a colorful retro-style diner or café. She is positioned slightly left of center , turned toward someone just outside the frame , caught in the middle of a genuine laugh. Her expression is warm and spontaneous , with bright eyes , a broad smile , and slightly flushed cheeks that convey easy happiness and social connection. She wears a flowing mustard-yellow off-the-shoulder blouse with long gathered sleeves and a tied front that reveals a small portion of her midriff. Layered necklaces rest against a deep red patterned bandhani style saree , creating a relaxed bohemian aesthetic. Her dark hair is loosely gathered into a messy topknot , with soft strands escaping around her face and neck. Large hoop earrings add to the casual , free-spirited style. The background is rendered in a creamy blur , emphasizing the shallow depth of field. Out-of-focus patrons occupy diner stools and tables behind her , while bright red architectural elements and turquoise seating create a lively palette of warm and cool colors. A glass of orange-colored juice sits on the counter in the lower left corner , contributing to the casual daytime atmosphere. Natural light pours through windows on the right side of the image , wrapping softly around her face and shoulders and creating a bright , welcoming mood. The overall scene feels intimate and authentic , like a fleeting moment of laughter shared among friends during a relaxed afternoon gathering. ,
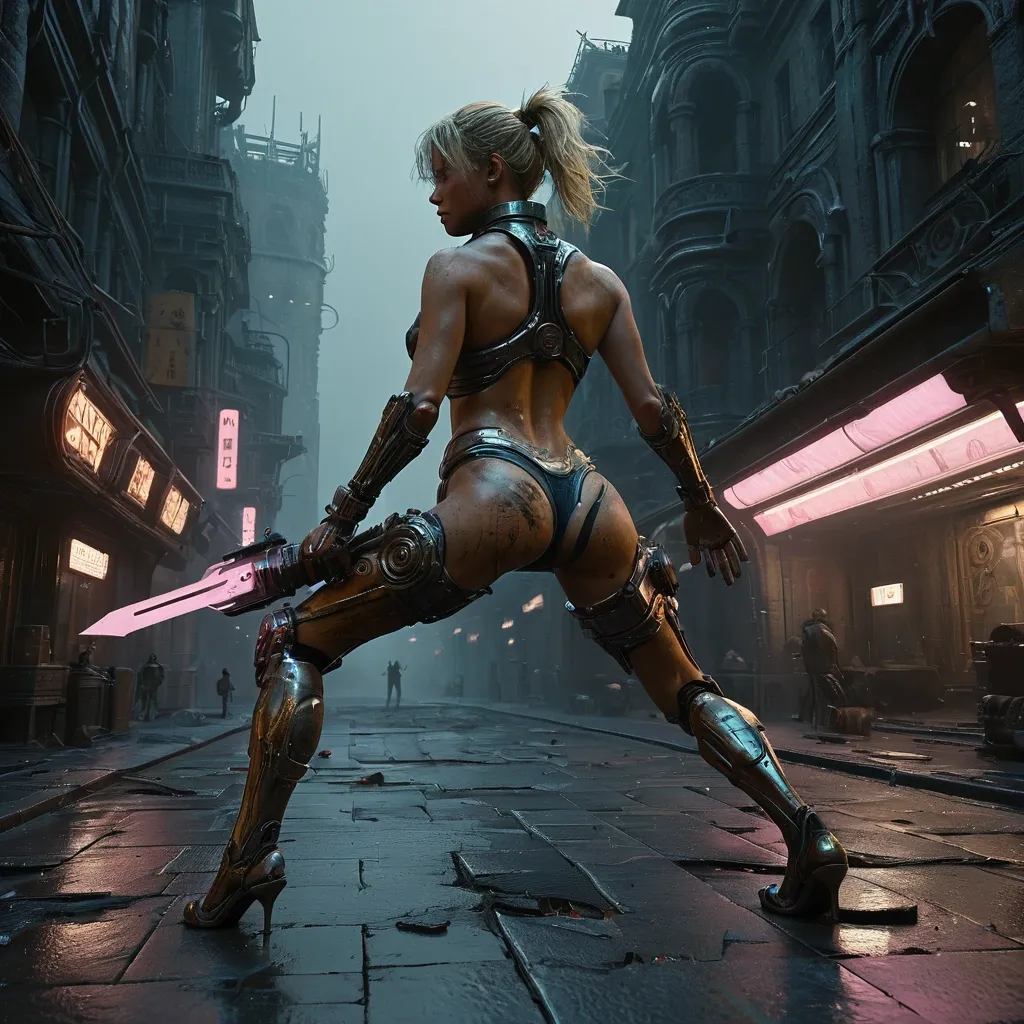
On the right side A majestic mechanical scorpion , gears whirring and steam hissing , traverses terrain. Intricate clockwork details adorn its exoskeleton , with glowing amber optics scanning the horizon. The style is a fusion of steampunk aesthetics , industrial design , and cinematic concept art , with a palette of warm neonpink and metallic silvers. On the left side , Extreme close-up , dramatic chiaroscuro oil painting featuring a woman with blonde windswept hairstyle and a muscular physique , showcasing highly defined , sculpted back muscles , toned arms , powerful legs , and firm , bubble-shaped buttocks that emphasize strength and athleticism. in a full-body staggard position with hands wide , with kintsugi black cracks in her skin , in skimpy , tattered black revealing robes blowing in the wind , eyes glaring in anger , fury on face , tattered robes covered in arcane hieroglyphs , amidst fallen robotic bodies in fear with ravens pecking; atmospheric fog and shadows; The scene is set with her dynamically leaping forward to the camera left knees up while wielding a red futuristic gauntlet , in her right hand wearing bulky futuristic wristcom lunging at the camera outside an old iron and stone cafe among A towering retro-futuristic metropolis at twilight , she is both tantalizing and terrifying , layered mixed-media aesthetic on aged cracked plaster and parchment surface , distressed patina with peeling paint and weathered grain , painterly impasto with palette knife texture and soft edge blending , semi-abstract realism balance , warm–cool tonal harmony integration , controlled colour bleed and pigment bloom , atmospheric haze and soft diffusion , tactile surface depth , fine noise and paper fibre detail , gentle vignette , cinematic lighting with soft highlights and muted shadows , cohesive composition , no clean digital finish , no sharp vector edges , maintain organic irregularities and handcrafted imperfections , layered mixed-media aesthetic on aged cracked plaster and parchment surface , subtle embedded microtext and ghosted typography throughout background , distressed patina with peeling paint and weathered grain , painterly impasto with palette knife texture and soft edge blending , semi-abstract realism balance , warm–cool tonal harmony integration , controlled colour bleed and pigment bloom , atmospheric haze and soft diffusion , tactile surface depth , fine noise and paper fibre detail , gentle vignette , cinematic lighting with soft highlights and muted shadows , cohesive composition , no clean digital finish , no sharp vector edges , maintain organic irregularities and handcrafted imperfections , Sleek , chrome-plated robots patrol the rain-slicked streets below , their optical sensors scanning the urban sprawl. The architecture is a blend of art deco grandeur and advanced , impossible geometries. Rendered in the style of highly detailed concept art with influences from Moebius and Syd Mead , utilizing a dark fantasy color palette with vibrant , contrasting highlights.. The style is ethereal and epic , with emotional brushstrokes and atmospheric depth , rendered with exquisite detail in 8k. Dramatic chiaroscuro lighting with a color palette of blue , black , white , and gold , optimized for Unreal Engine 5 , intricate mech details , ground level shot , 8K resolution , Cinema 4D , Behance HD , polished metal , , cyberpunk 2099 blade runner 2049 neon , cyberpunk 2099 blade runner 2049 neon ,
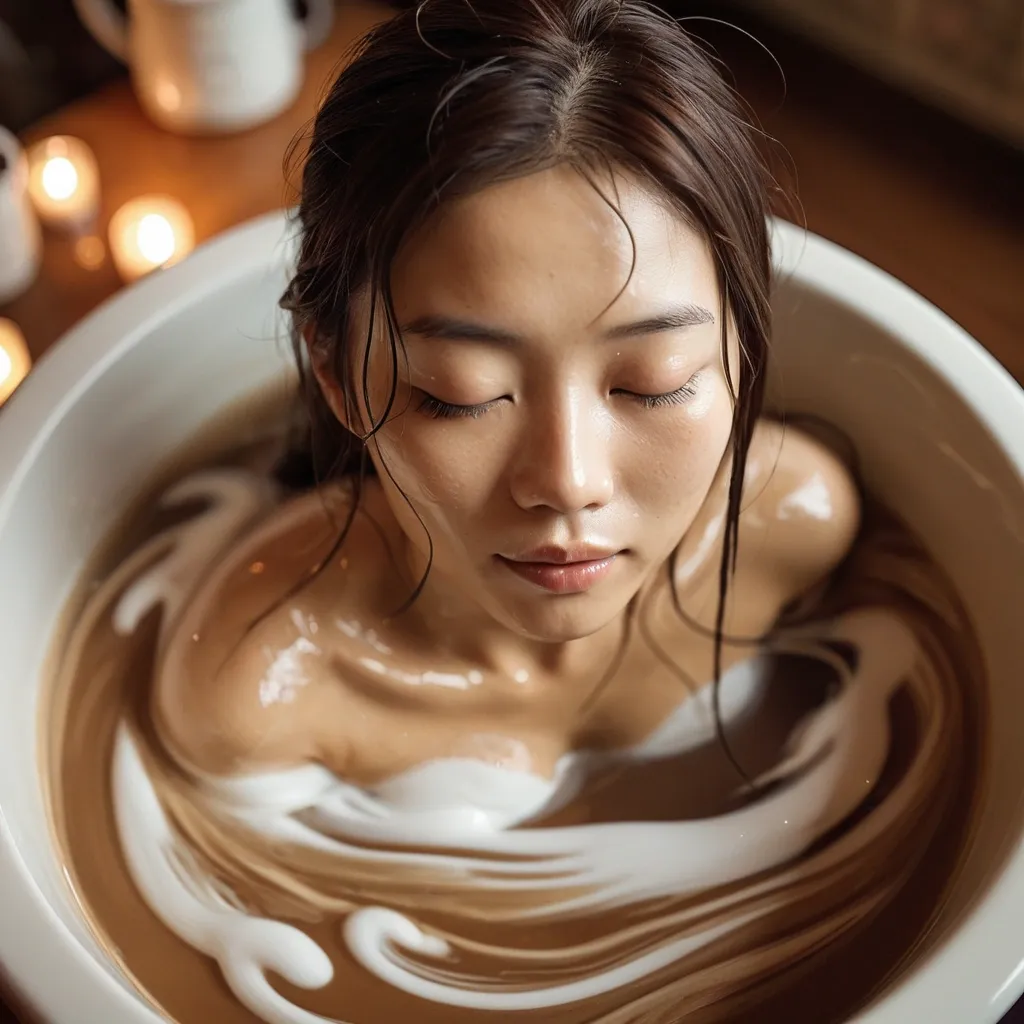
Top-down view of an Asian woman , appearing to be in her early thirties , delicately bathing within a colossal , steaming cup of cappuccino. Her skin is fair , with a subtle blush. She is seated comfortably , long legs drawn up slightly , most of her body buried under the foam. her posture conveying serene relaxation. Her hair , a rich black , is loosely tied back , with a few strands artfully escaping to frame her face. Her expression is one of pure bliss , eyes gently closed , a faint smile gracing her lips. The cappuccino itself is immense , its surface a creamy , frothy expanse of latte art , resembling an abstract , swirling landscape. The rich brown of the coffee forms the deep , inviting pool around her. Surrounding this surreal bathing scene is a heavily blurred , out-of-focus environment , suggesting a miniature , diorama-like setting. The lighting is warm and diffused , mimicking the cozy ambiance of a café , with soft highlights glinting off the coffee's surface and the woman's skin. The color palette is dominated by creamy beiges , warm browns , and soft whites , creating an intimate and whimsical atmosphere. The overall mood is one of tranquil indulgence and playful fantasy , captured with a shallow depth of field and a macro lens effect. Style: Whimsical , surreal , miniature photography. , Hyperrealistic , splash art , concept art , mid shot , intricately detailed , color depth , dramatic , 2/3 face angle , side light , colorful background ,
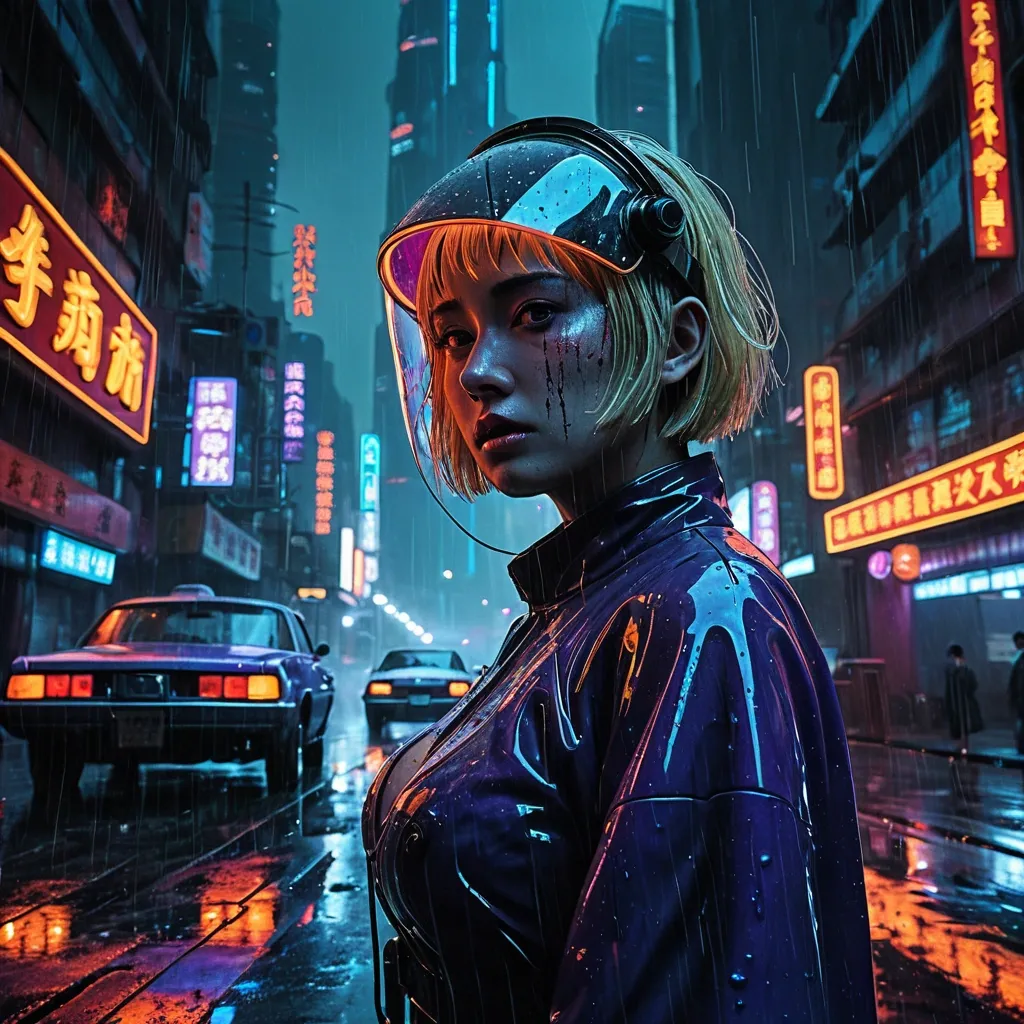
Hourglass Figure bob-hairstyle Blonde Woman in android costume stands alone on a rain-slicked , neon-drenched street in a dystopian metropolis. Her face looking up , expression sad , raindrop splattered on her face and her visor. Ultradetailed focus on her face. Red clouds roiling with thunders. Towering , oppressive skyscrapers loom overhead , casting long , distorted shadows. A vintage car idles nearby , its headlights cutting through the perpetual twilight. The neon sign "Shanghai" and "Hongkong" flicker through the rains. The scene is rendered in a gritty , high-contrast concept art style , reminiscent of Blade Runner's visual aesthetic , with influences from Syd Mead and Moebius. Moody , atmospheric lighting with a deep color palette of blues , purples , and oranges. , intricate details , HDR , beautifully shot , hyperrealistic , sharp focus , 64 megapixels , perfect composition , high contrast , cinematic , atmospheric , moody ,
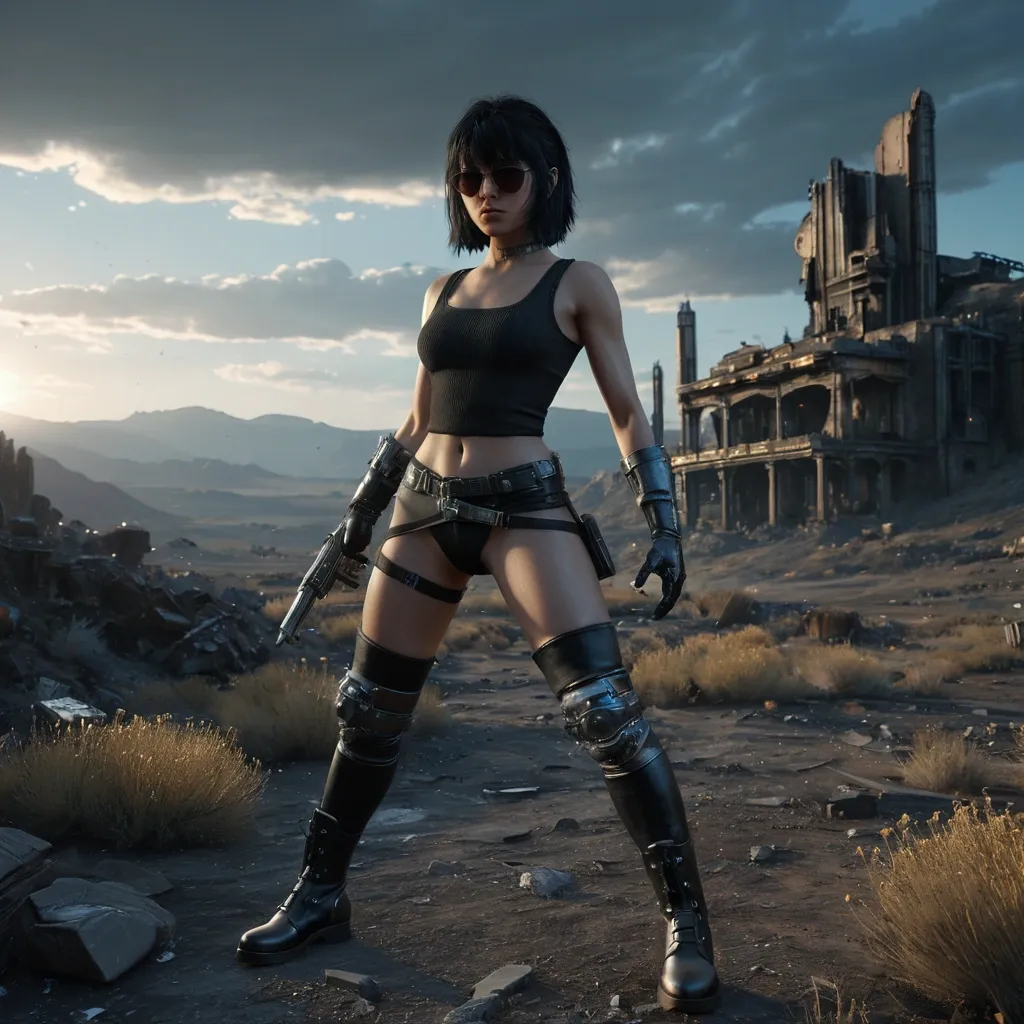
Extreme close-up , dramatic chiaroscuro oil painting featuring @TifaLockhart from Final Fantasy 7 with a shaggy hip-length ink-black hair and bangs , turned facing forward and to the right , looking over a pair of sunglasses with immense concentration. She wears a gossamer cropped top over black undershirt , light grey-and-blue lace-up carbon-fiber sleeveless u-neck leotard , tights , black leather waist belt with multiple pouches , ankle boots with kitten heels. The scene is set with her dynamically leaping forward to the camera left knees up while wielding a , red fingerless gloves , in her right hand lunging at the camera outside an old iron and stone cafe in the middle of a science fiction wasteland , with a background of dusty hills , metal ruins , wildflowers , and clouds during sunset. The style is ethereal and epic , with emotional brushstrokes and atmospheric depth , rendered with exquisite detail in 8k. Dramatic chiaroscuro lighting with a color palette of blue , black , white , and gold , optimized for Unreal Engine 5 , intricate mech details , ground level shot , 8K resolution , Cinema 4D , Behance HD , polished metal , Unreal Engine 5 , rendered in Blender , sci-fi , futuristic , trending on Artstation , epic , cinematic background , dramatic , atmospheric ,
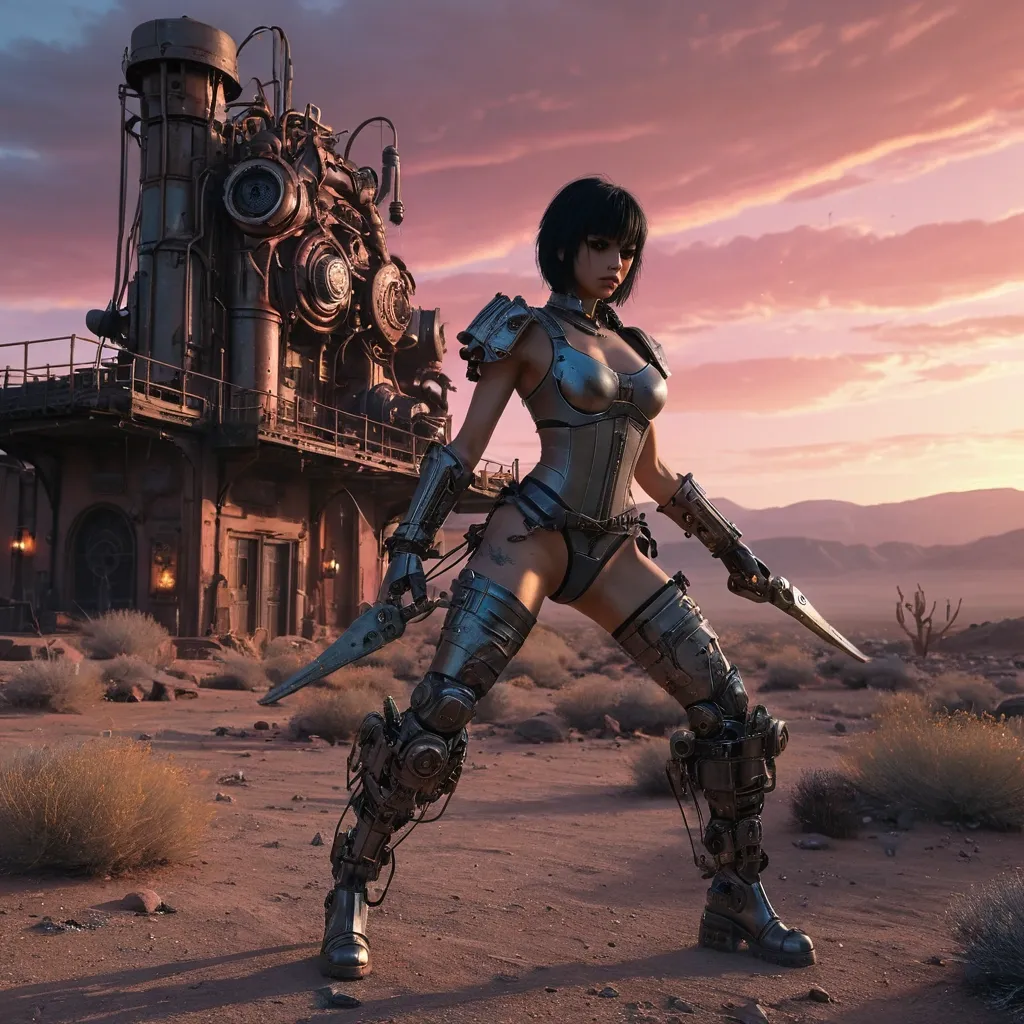
A majestic mechanical scorpion , gears whirring and steam hissing , traverses a desolate , rust-colored desert landscape under a neon-pink sunset. Intricate clockwork details adorn its exoskeleton , with glowing amber optics scanning the horizon , it long tails hovering high menacingly . The style is a fusion of steampunk aesthetics , industrial design , and cinematic concept art , with a palette of warm neonpink and metallic silvers. Extreme close-up , dramatic chiaroscuro oil painting featuring @TifaLockhart from Final Fantasy 7 with a shaggy hip-length ink-black hair and bangs , turned facing forward and to the right , looking over a pair of sunglasses with immense concentration. She wears a gossamer cropped top over black undershirt , light grey-and-blue lace-up carbon-fiber sleeveless u-neck leotard , tights , black leather waist belt with multiple pouches , ankle boots with kitten heels. The scene is set with her dynamically leaping forward to the camera left knees up while wielding a , red fingerless gloves , in her right hand lunging at the camera outside an old iron and stone cafe in the middle of a science fiction wasteland , with a background of dusty hills , metal ruins , wildflowers , and clouds during sunset. The style is ethereal and epic , with emotional brushstrokes and atmospheric depth , rendered with exquisite detail in 8k. Dramatic chiaroscuro lighting with a color palette of blue , black , white , and gold , optimized for Unreal Engine 5 , intricate mech details , ground level shot , 8K resolution , Cinema 4D , Behance HD , polished metal , Unreal Engine 5 , rendered in Blender , sci-fi , futuristic , trending on Artstation , epic , cinematic background , dramatic , atmospheric ,
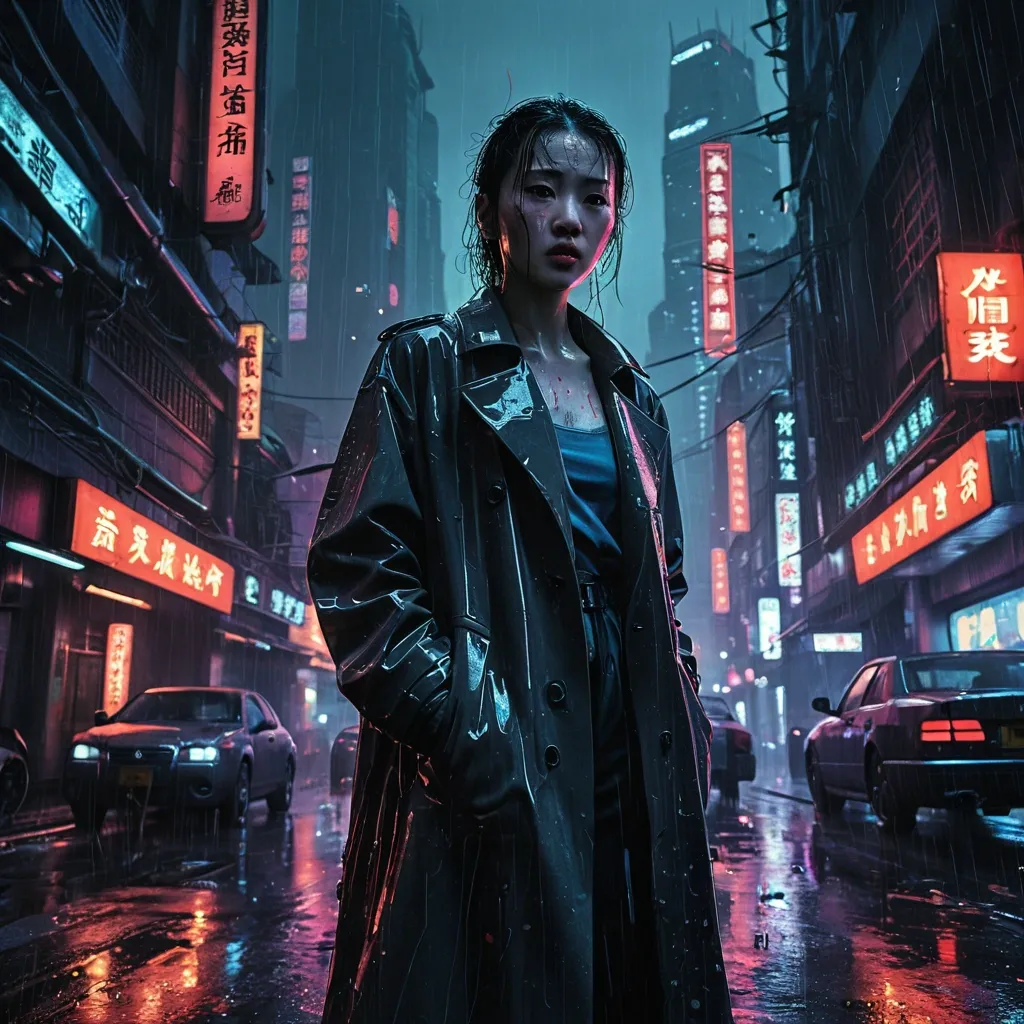
Liu Yi Fei in a trench coat stands alone on a rain-slicked , neon-drenched street in a dystopian metropolis. Her face looking up , expression sad , raindrop splattered on her face. Ultradetailed focus on her face. Red clouds roiling with thunders. Towering , oppressive skyscrapers loom overhead , casting long , distorted shadows. A vintage car idles nearby , its headlights cutting through the perpetual twilight. The neon sign "Shanghai" and "Hongkong" flicker through the rains. The scene is rendered in a gritty , high-contrast concept art style , reminiscent of Blade Runner's visual aesthetic , with influences from Syd Mead and Moebius. Moody , atmospheric lighting with a deep color palette of blues , purples , and oranges. , intricate details , HDR , beautifully shot , hyperrealistic , sharp focus , 64 megapixels , perfect composition , high contrast , cinematic , atmospheric , moody ,
Albino Scorpion , cosmic space galactic colorful bismuth astral ethereal elaborate fantastical magnificent synesthesia beautiful complex detailed. Its long pincer strike toward camera. Epic cinematic brilliant stunning intricate meticulously detailed dramatic atmospheric maximalist digital matte painting detailed matte painting , deep color , fantastical , intricate detail , splash screen , fantasy concept art , biopunk Marilyn Monroe is running toward camera with desperate expression. She wear blue shimmering form-fitting long-sleeve long-pant latex suit with silver necklace , bulky wristcom. Background is Washington DC in ruins , smokes and flames. The smoking burning blackened ruins of a once-grand Capitol Building looming behind her , its pillar spires broken and twisted , the wreck emit black smokes. The scene is rendered in a gritty , high-contrast concept art style , reminiscent of Blade Runner's visual aesthetic , with influences from Syd Mead and Moebius. Moody , atmospheric lighting with a deep color palette of blues , purples , and oranges. , intricate details , HDR , beautifully shot , hyperrealistic , sharp focus , 64 megapixels , perfect composition , high contrast , cinematic , atmospheric , moody ,