"Design a modern analytics dashboard for SynCloud Customer Portal. Show top stat cards: Total API Re

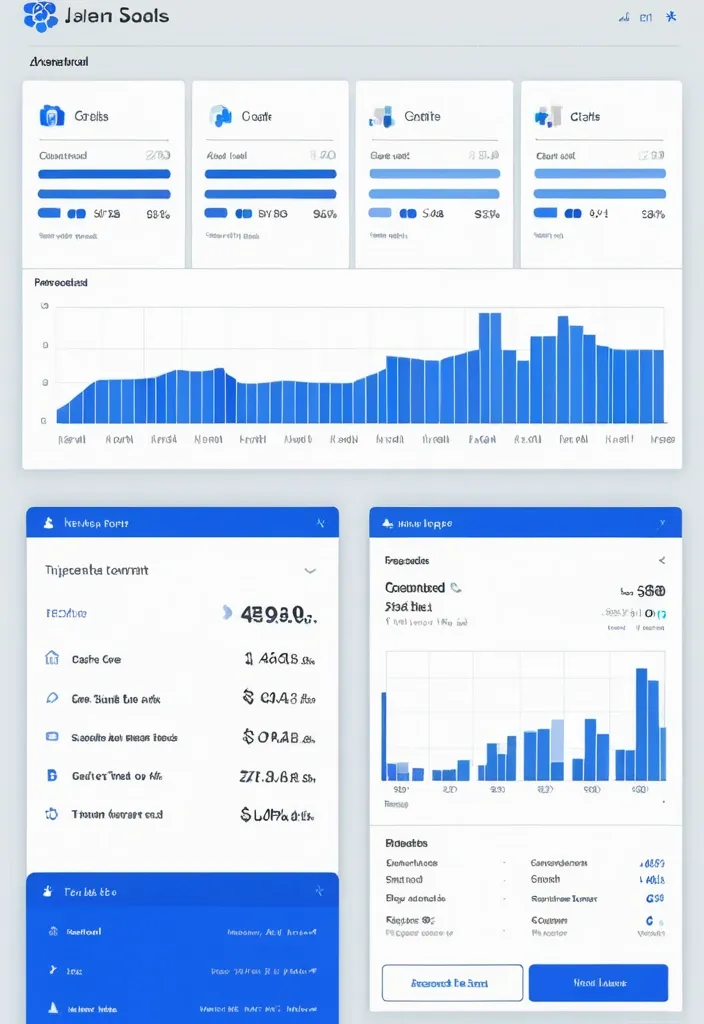
"Design a modern analytics dashboard for SynCloud Customer Portal. Show top stat cards: Total API Requests , Compute Tokens Used , Billing Cycle % with 50/80/100% alerts , and Last Request. Add visual charts: line chart for daily requests , bar chart for weekly token usage , pie chart for requests by service type. Include a usage history table with Date , Request Type , Tokens Used , Status , plus filters and export option. Clean SaaS style , sidebar navigation with Analytics highlighted , responsive design , blue/white theme , minimal and professional." ,
{ "seed": "25605553", "width": 704, "height": 1024, "version": "SH_JuggernautXL", "sampler_name": "k_dpmpp_sde", "cfg_scale": 5, "steps": 20 }
Created on: 9/19/2025, 5:52:23 AM