Search Results for responsive design
Explore AI generated designs, images, art and prompts by top community artists and designers.
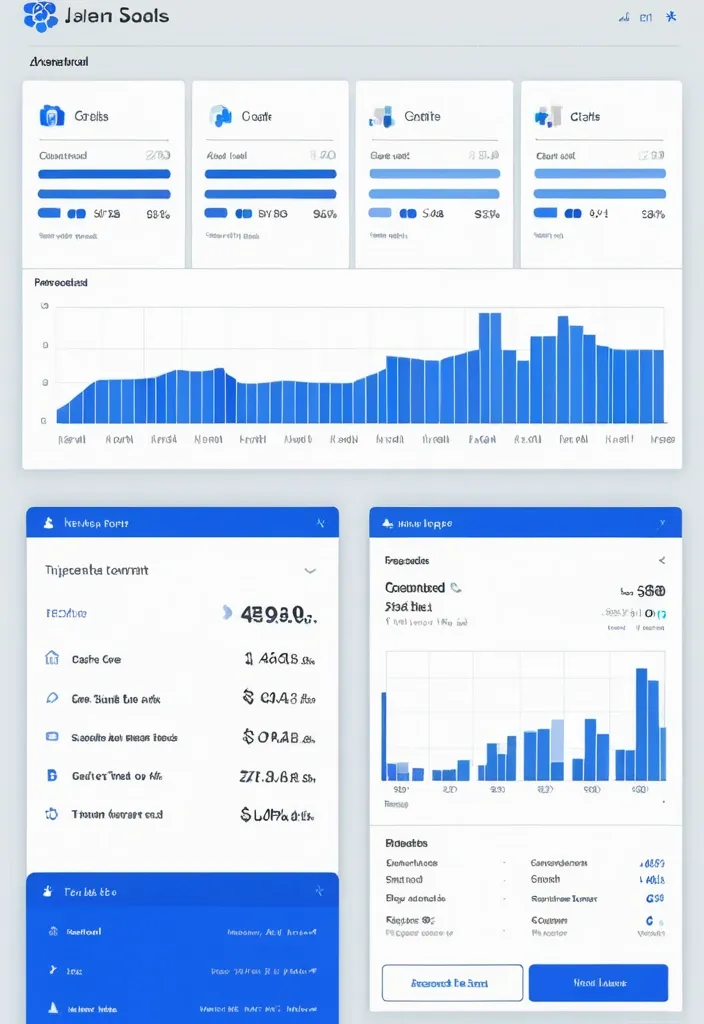

"Design a modern analytics dashboard for SynCloud Customer Portal. Show top stat cards: Total API Requests , Compute Tokens Used , Billing Cycle % with 50/80/100% alerts , and Last Request. Add visual charts: line chart for daily requests , bar chart for weekly token usage , pie chart for requests by service type. Include a usage history table with Date , Request Type , Tokens Used , Status , plus filters and export option. Clean SaaS style , sidebar navigation with Analytics highlighted , responsive design , blue/white theme , minimal and professional." ,
Clean and simple layout Easy navigation Limited color palette High contrast Large , easy-to-read typography Clear and concise information display Use of white space Minimalistic icons and graphics Responsive design for mobile devices User-centered design approach Efficient use of screen real estate Option to customize and personalize the dashboard. ,