Search Results for charts
Explore AI generated designs, images, art and prompts by top community artists and designers.
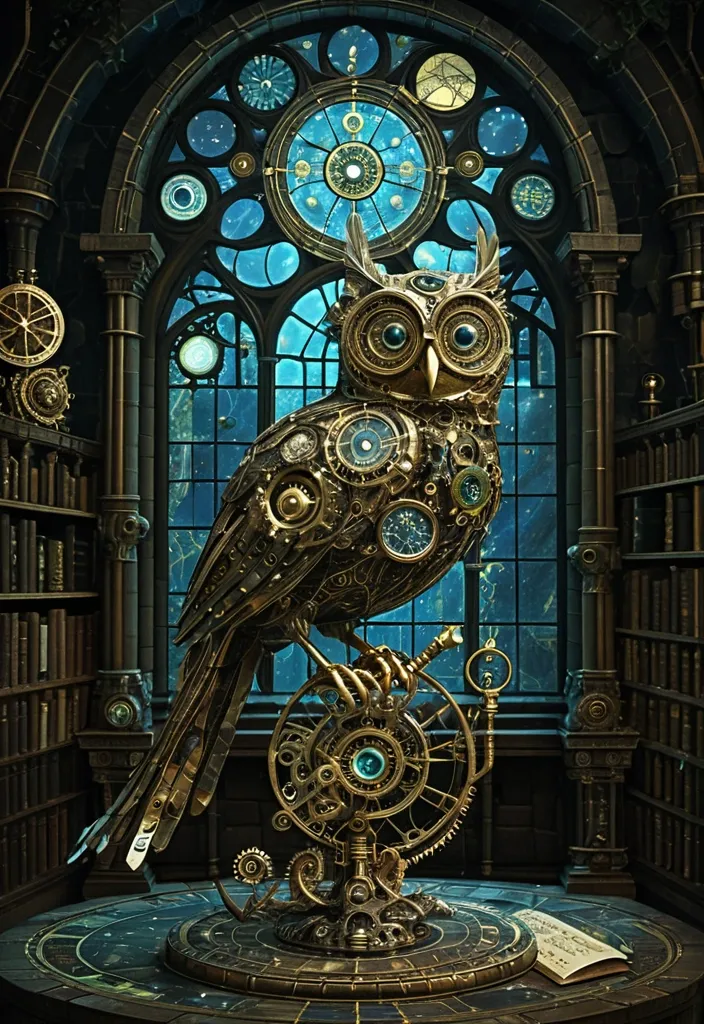

A surreal clockwork owl , its feathers made of polished brass and gears , perches on a gnarled , moss-covered branch within a silent , ancient library. Moonlight streams through a massive stained-glass window depicting astronomical charts. Dust motes dance in the light beams. The style should be dark academia meets whimsical steampunk illustration , with intricate details and a moody , atmospheric lighting reminiscent of a hidden magical world. ,
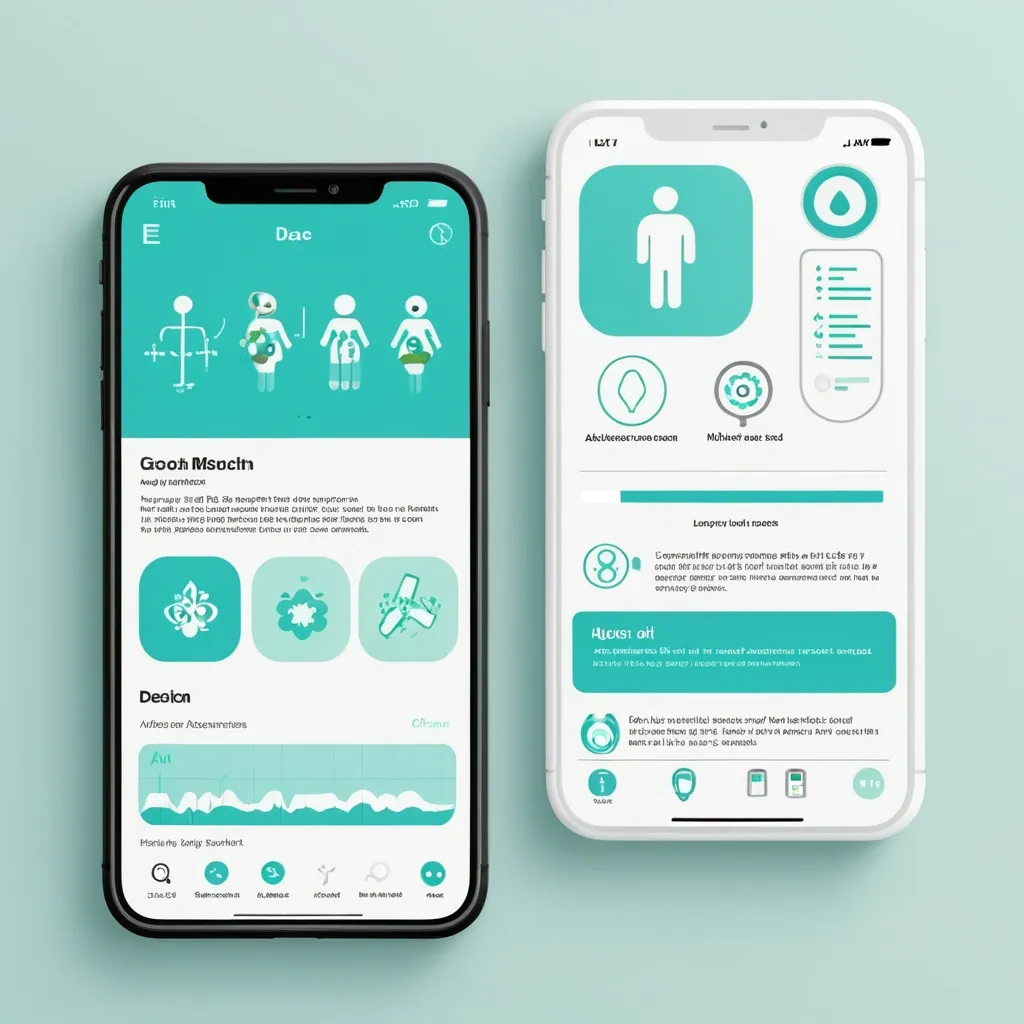
Разработай макет приложения для здоровья. Краткое описание идеи Приложение , которое: Распознает медицинские анализы по фото (ОАК , биохимия , гормоны и др.) Строит динамические графики показателей во времени Хранит заключения специалистов с возможностью поиска и структурирования Собирает профиль пользователя (пол , возраст , вес , хронические заболевания) Предоставляет AI-рекомендации по питанию , физической активности , ментальному здоровью. Философия дизайна «Забота и ясность» — дизайн должен создавать ощущение: ✅ Безопасности — пользователь доверяет приложению свои медицинские данные ✅ Профессионализма — научный подход , точность , надежность ✅ Заботы — теплота , поддержка , мотивация к здоровью ✅ Ясности — простота восприятия сложной медицинской информации. Mobile app UI design , medical health tracker dashboard , clean minimal style , soft pastel colors: primary turquoise #5DBCD2 , lavender #9B9ED6 , white background #F8FAFC , dark gray text #2D3748. Layout: Top greeting "Добрый день , Анна!" with health score circular widget (85/100 , mint green progress ring). Below: 4 rounded square quick-action cards with soft icons (Documents , Charts , AI Assistant , Appointments). Section "Последние анализы": two white cards with rounded corners (20px) , subtle shadow , each showing test name (🩸 Общий анализ крови) , date , and status badge (✓ Норма in mint green , ⚠ Повыш. in coral). AI recommendation card at bottom: soft gradient background , robot icon , short text tip about hydration. Bottom navigation bar: 5 icons (Home , Analytics , Add , Chat , Profile) , active icon in turquoise , blurred white background. Style: Medical Minimalism 2.0 , glassmorphism elements , soft UI , organic rounded shapes , calm aesthetic , professional but friendly. High fidelity , Figma-style mockup , iOS design guidelines , 375x812px frame , light mode. --ar 9:19 --style raw ,
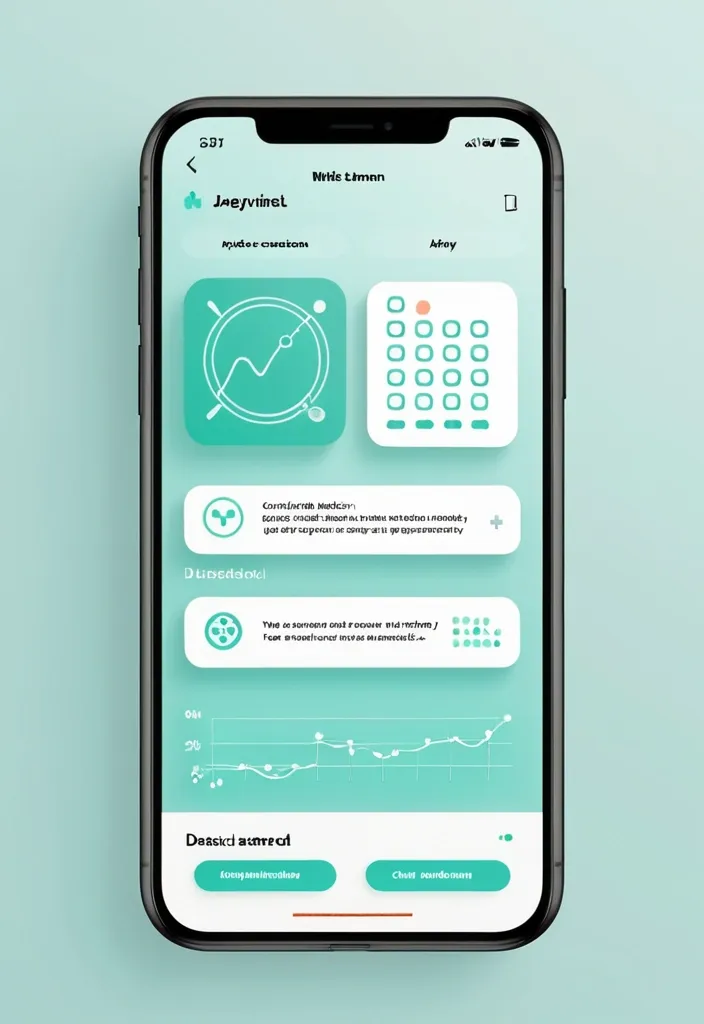
Разработай макет приложения для здоровья. Краткое описание идеи Приложение , которое: Распознает медицинские анализы по фото (ОАК , биохимия , гормоны и др.) Строит динамические графики показателей во времени Хранит заключения специалистов с возможностью поиска и структурирования Собирает профиль пользователя (пол , возраст , вес , хронические заболевания) Предоставляет AI-рекомендации по питанию , физической активности , ментальному здоровью. Философия дизайна «Забота и ясность» — дизайн должен создавать ощущение: ✅ Безопасности — пользователь доверяет приложению свои медицинские данные ✅ Профессионализма — научный подход , точность , надежность ✅ Заботы — теплота , поддержка , мотивация к здоровью ✅ Ясности — простота восприятия сложной медицинской информации. Mobile app UI design , medical health tracker dashboard , clean minimal style , soft pastel colors: primary turquoise #5DBCD2 , lavender #9B9ED6 , white background #F8FAFC , dark gray text #2D3748. Layout: Top greeting "Добрый день , Анна!" with health score circular widget (85/100 , mint green progress ring). Below: 4 rounded square quick-action cards with soft icons (Documents , Charts , AI Assistant , Appointments). Section "Последние анализы": two white cards with rounded corners (20px) , subtle shadow , each showing test name (🩸 Общий анализ крови) , date , and status badge (✓ Норма in mint green , ⚠ Повыш. in coral). AI recommendation card at bottom: soft gradient background , robot icon , short text tip about hydration. Bottom navigation bar: 5 icons (Home , Analytics , Add , Chat , Profile) , active icon in turquoise , blurred white background. Style: Medical Minimalism 2.0 , glassmorphism elements , soft UI , organic rounded shapes , calm aesthetic , professional but friendly. High fidelity , Figma-style mockup , iOS design guidelines , 375x812px frame , light mode. --ar 9:19 --style raw ,
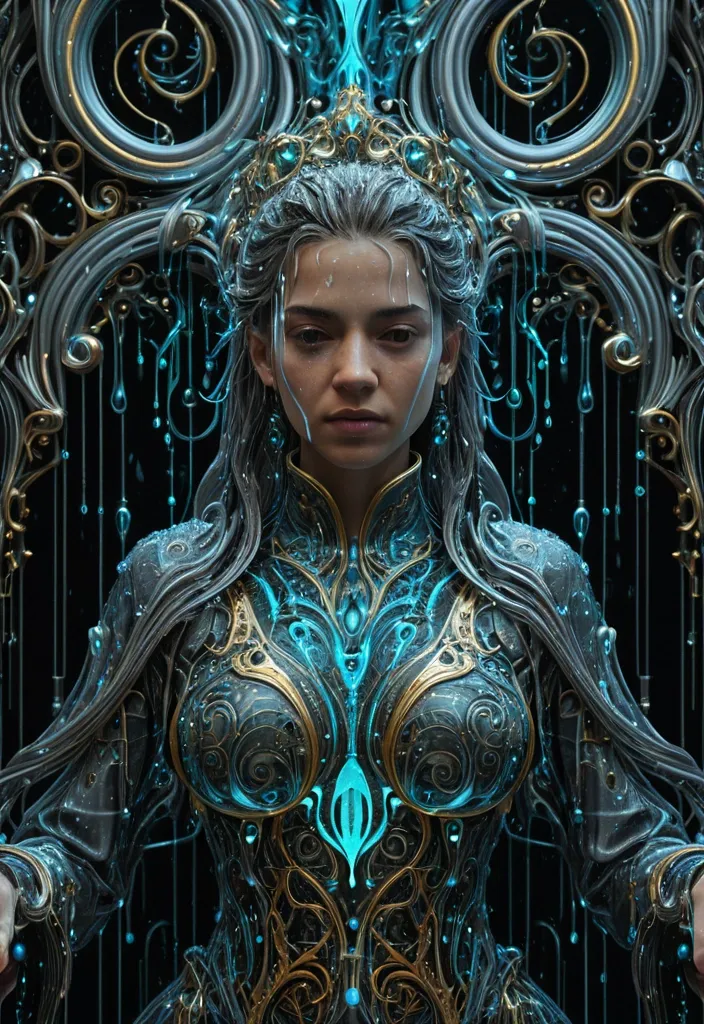
masterpiece) , (best quality) , ultra detailed , highly detailed , 8k resolution , sharp lineart , intricate hair strands , crisp details , perfect anatomy , detailed clothing , cinematic lighting , vibrant colors , rich textures , detailed background , A female sovereign draped in [anti-Soak-cide] raindrops—water that kills wetness , droplets that repel absorption while appearing liquid—each bead a [holo-Liquid-phase] holographic state-shift suspended between solid , fluid , and data. The entire composition viewed through a [hyper-Omni-rain-scope] field: an all-encompassing , hyper-influential atmospheric dominion where rain becomes omniscient observer. Rendered in deep-infographical-baroque style: ornate baroque flourishes interwoven with layered data-visualization geometry , calligraphic flow-charts as decorative filigree , cinematic sci-fi painting technique with volumetric ionized lighting , 8K resolution , palette of mercury-silver , ionized cyan , baroque gold-leaf accents , and deep void-black negative space. ,
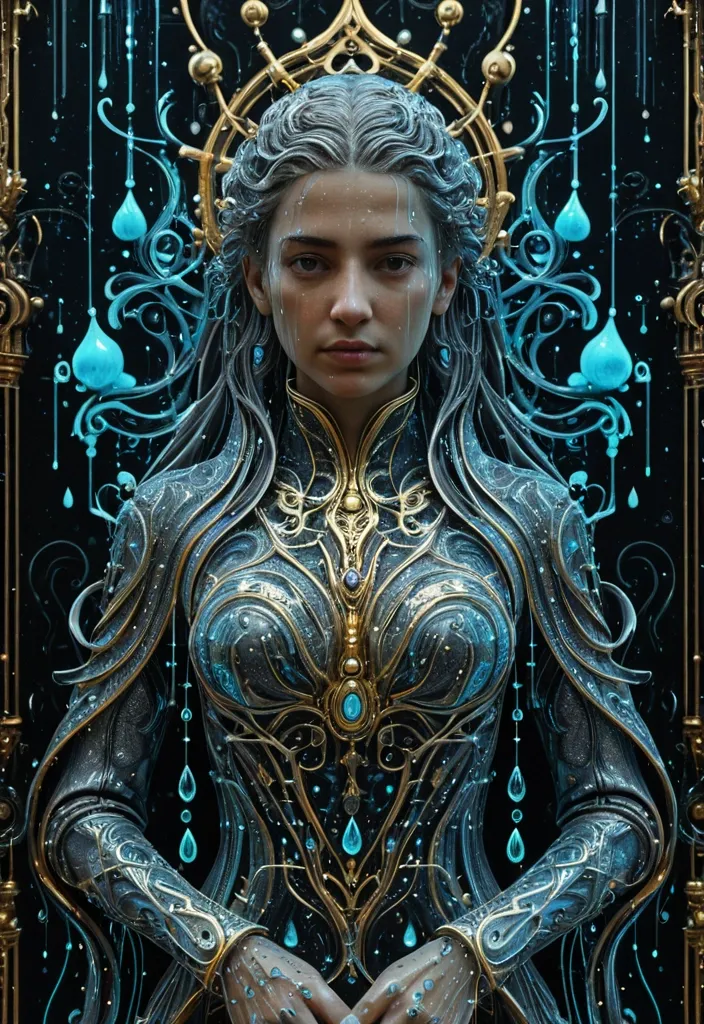
masterpiece) , (best quality) , ultra detailed , highly detailed , 8k resolution , sharp lineart , intricate hair strands , crisp details , perfect anatomy , detailed clothing , cinematic lighting , vibrant colors , rich textures , detailed background , A female sovereign draped in [anti-Soak-cide] raindrops—water that kills wetness , droplets that repel absorption while appearing liquid—each bead a [holo-Liquid-phase] holographic state-shift suspended between solid , fluid , and data. The entire composition viewed through a [hyper-Omni-rain-scope] field: an all-encompassing , hyper-influential atmospheric dominion where rain becomes omniscient observer. Rendered in deep-infographical-baroque style: ornate baroque flourishes interwoven with layered data-visualization geometry , calligraphic flow-charts as decorative filigree , cinematic sci-fi painting technique with volumetric ionized lighting , 8K resolution , palette of mercury-silver , ionized cyan , baroque gold-leaf accents , and deep void-black negative space. ,

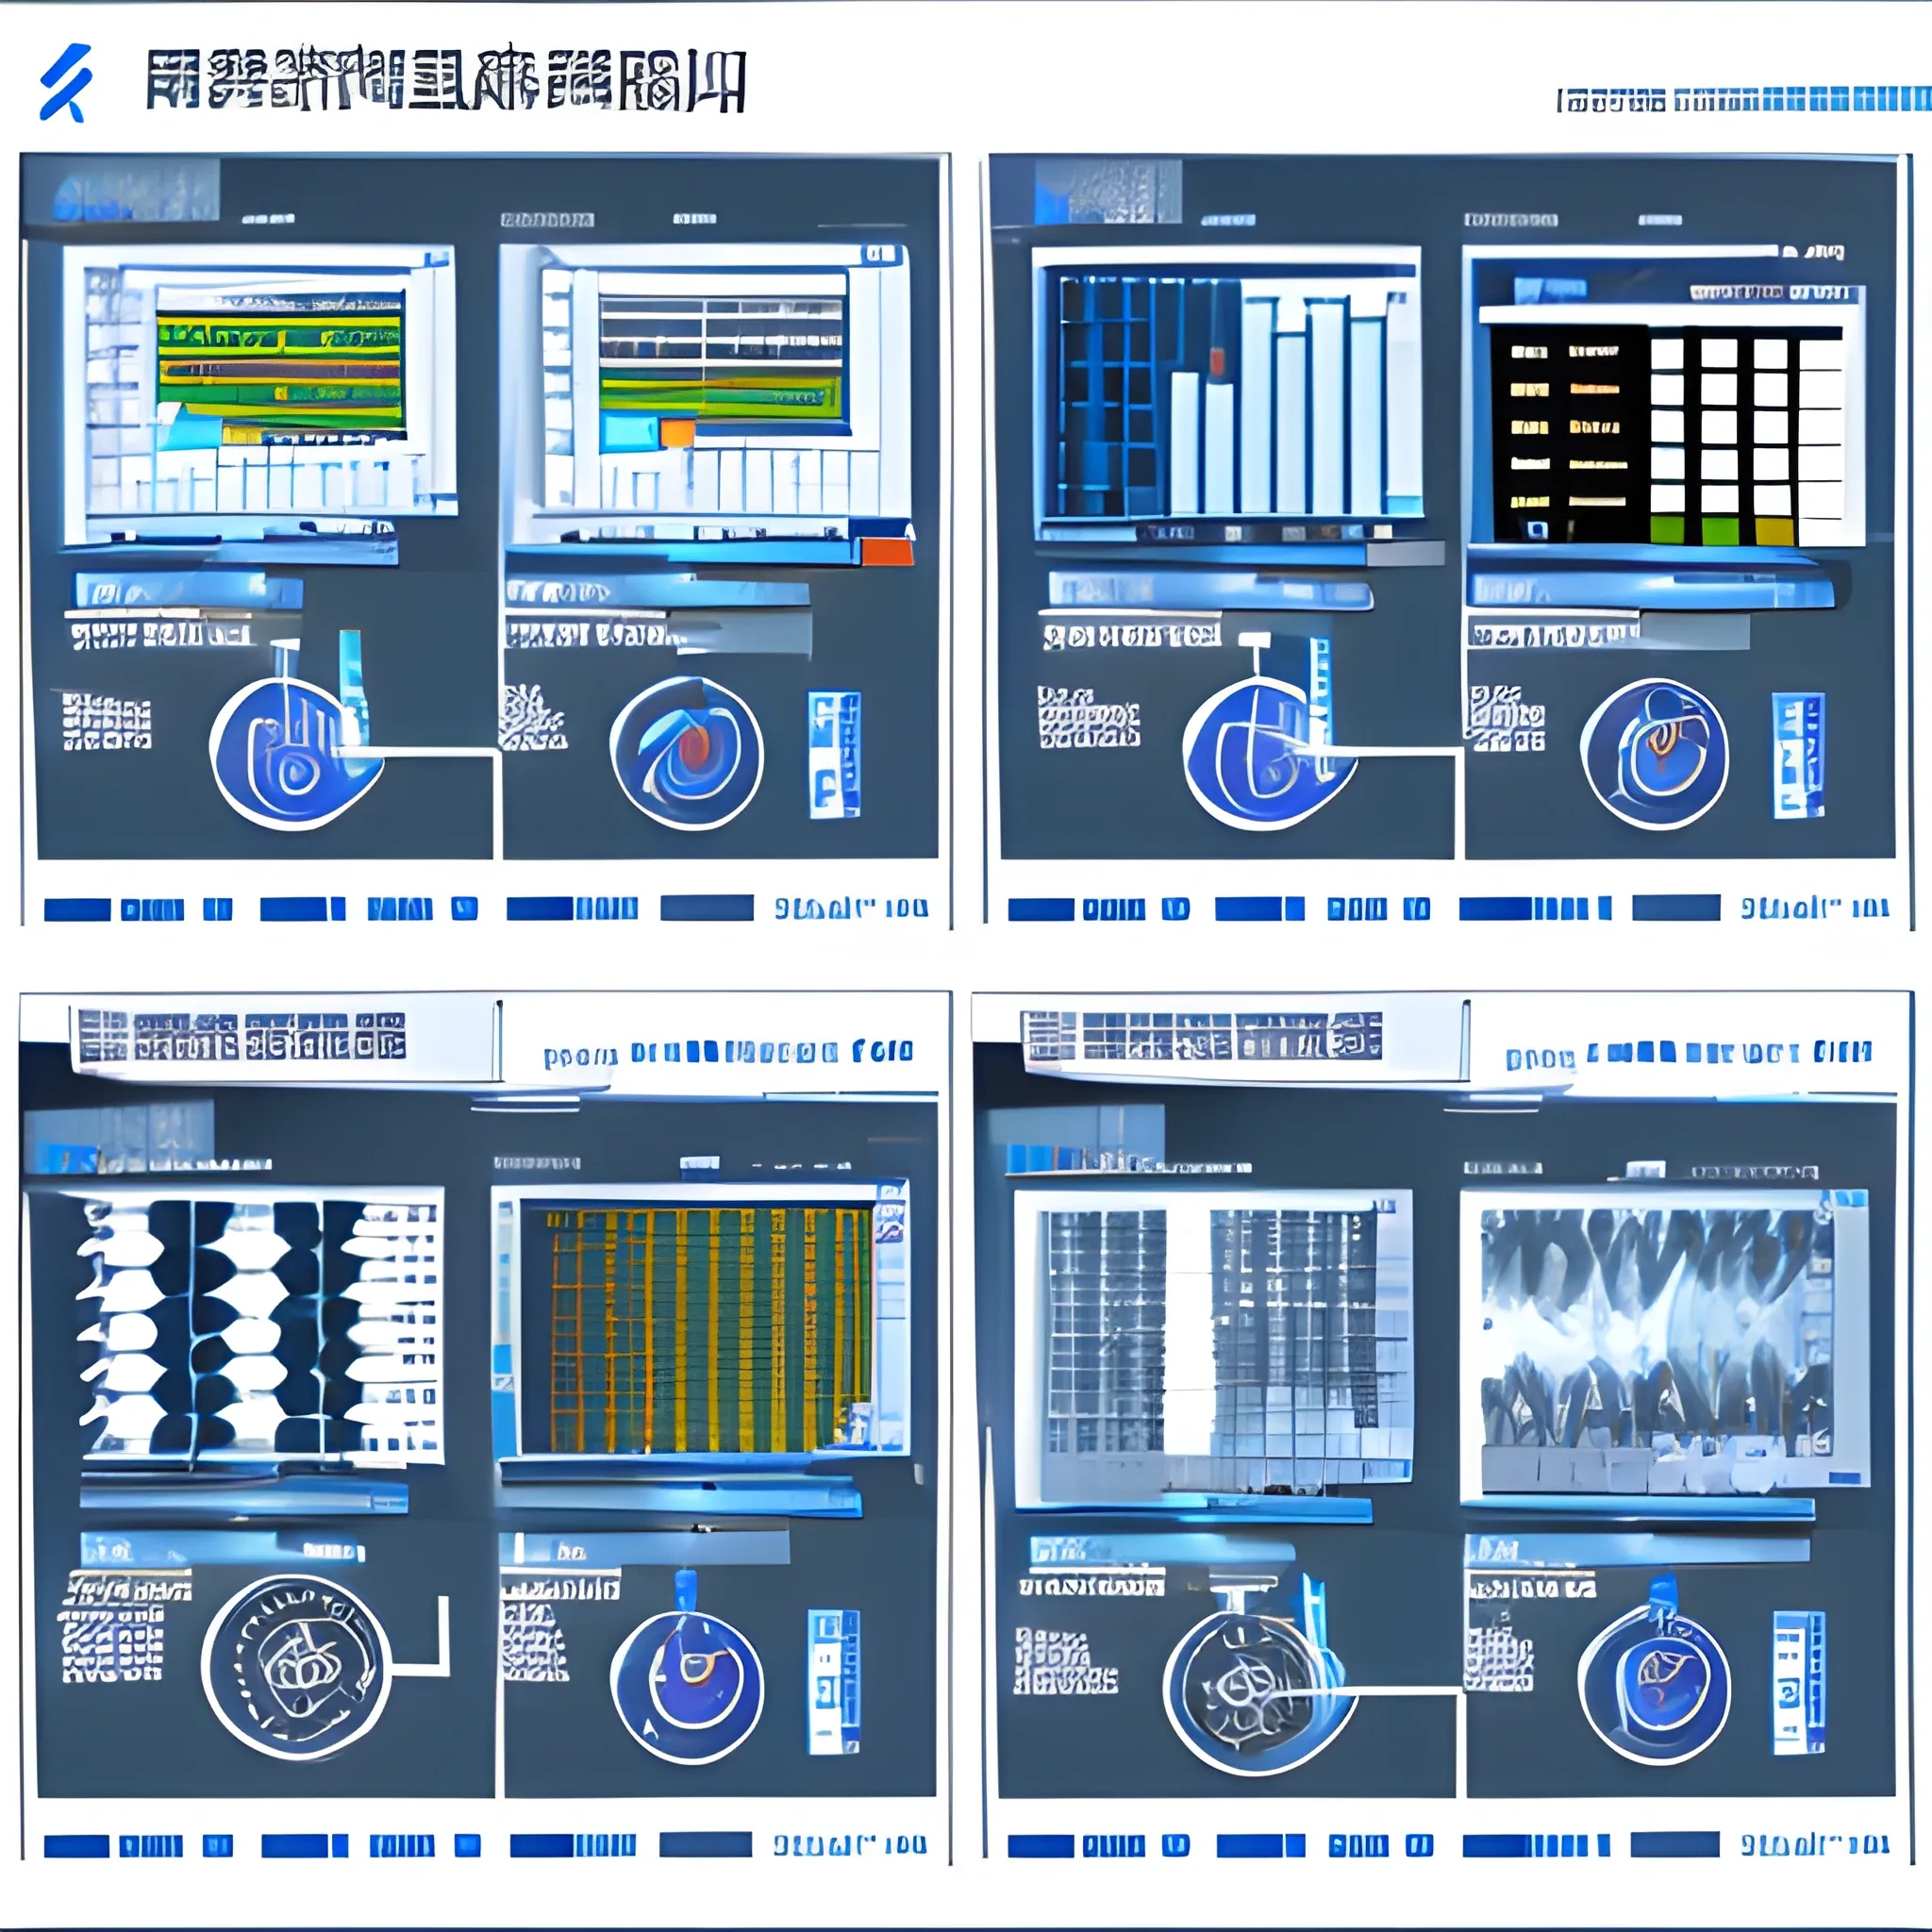
Отлично , давайте разработаем концепцию красивого и интуитивно понятного интерфейса для комплексного мониторинга. Я разобью решение на несколько этапов , описывая структуру , элементы и возможные технологии.1. Общая структура и принципы дизайна:Клиент-ориентированность: Каждый заказчик видит только свои системы.Модульность: Разделение на системы , группы метрик (бизнес , инфраструктура , приложения) и детализированные графики.Визуальная иерархия: Четкое разделение элементов , использование размеров , цветов и отступов для указания важности.Интерактивность: Плавные переходы , всплывающие подсказки , фильтры и возможность кастомизации.Адаптивность: Корректное отображение на разных устройствах (десктопы , планшеты , мобильные).2. Основные экраны и элементы интерфейса:Экран авторизации/выбора заказчика:Простая форма авторизации.После авторизации – список доступных заказчиков (если у пользователя есть доступ к нескольким).Главная панель (Dashboard) для заказчика:Обзор: Краткая сводка по всем системам заказчика:Индикаторы состояния (зеленый/желтый/красный) для каждой системы.Ключевые метрики (например , количество активных пользователей , среднее время ответа) в виде небольших карточек или графиков.Список систем: Визуальное представление систем заказчика. Варианты:Карточки: Каждая система – отдельная карточка с названием , кратким описанием , индикатором состояния и ссылкой на детали.Сетка (Grid): Иконки систем в сетке.Список: Простой список систем с основными данными.Поиск: Позволяет быстро найти нужную систему по названию.Страница системы (System View):Заголовок: Название системы , описание , владелец (контактная информация).Вкладки/Навигация: Разделение на группы метрик:Бизнес-метрики: Показатели , важные для бизнеса (например , выручка , конверсия , количество заказов).Инфраструктурные метрики: Показатели , связанные с инфраструктурой (например , загрузка CPU , использование памяти , дисковое пространство).Метрики приложений: Показатели , связанные с приложениями (например , время ответа API , количество ошибок , количество запросов).Логи: Отображение логов системыСписок метрик в каждой группе: Список доступных метрик с возможностью фильтрации и поиска. Для каждой метрики:Название.Текущее значение.Мини-график (sparkline) за последний период.Индикатор тренда (вверх/вниз/стабильно).Кнопка "Подробнее в Grafana": Переход к детальным графикам в Grafana для выбранной метрики. (Важно: Передача контекста в Grafana – см. раздел "Интеграция с Grafana").Страница детализированной метрики (Metric Detail): (Обычно это Grafana , но может быть и отдельная страница в вашем приложении , если необходимо).График метрики за выбранный период времени.Возможность выбора периода времени (последний час , день , неделя , месяц , произвольный диапазон).Возможность масштабирования графика.Возможность добавления аннотаций (например , для отметки важных событий).Возможность экспорта данных.3. Технологии (примерный стек):Frontend:React , Angular , Vue.js: Современные JavaScript-фреймворки для создания интерактивных пользовательских интерфейсов. React – наиболее популярный и гибкий вариант.TypeScript: Статическая типизация для повышения надежности кода.UI-библиотеки: Material UI , Ant Design , Chakra UI – готовые компоненты для быстрого создания красивого интерфейса.Графики: Chart.js , Recharts , Nivo – библиотеки для построения графиков.Backend:Node.js (Express) , Python (Flask/Django) , Java (Spring Boot): Для обработки запросов , авторизации , доступа к данным. Выбор зависит от ваших навыков и предпочтений.База данных: PostgreSQL , MySQL , MongoDB – для хранения данных о системах , метриках и настройках пользователей.Мониторинг и сбор метрик:Prometheus: Популярная система мониторинга и сбора метрик.Grafana: Для визуализации метрик и создания дашбордов.Telegraf , Collectd: Агенты для сбора метрик с различных систем.Коммуникация:REST API: Для взаимодействия между frontend и backend.WebSockets: Для обновления данных в реальном времени (например , для живых графиков).4. Интеграция с Grafana:URL-шаблоны: Создайте URL-шаблоны для перехода в Grafana с передачей параметров , таких как:datasource: Имя источника данных в Grafana.query: Запрос для получения метрики.variables: Значения переменных Grafana (например , период времени).Single Sign-On (SSO): Если возможно , настройте SSO между вашим приложением и Grafana , чтобы пользователям не приходилось вводить логин и пароль повторно.Встраивание Grafana (iFrame): В некоторых случаях можно встроить Grafana-дашборд в ваше приложение с помощью iFrame , но это может быть менее гибким и безопасным решением.5. Дополнительные рекомендации:Ролевая модель доступа: Определите роли пользователей (например , администратор , оператор , зритель) и настройте права доступа к системам и метрикам.Уведомления и алерты: Реализуйте систему уведомлений о критических событиях (например , превышение пороговых значений).Кастомизация: Предоставьте пользователям возможность настраивать дашборды , выбирать метрики и создавать собственные графики.Документация: Напишите подробную документацию для пользователей и администраторов.Тестирование: Проведите тщательное тестирование интерфейса , чтобы убедиться в его удобстве и функциональности.Примерная структура папок frontend (React):src/ components/ ,
Отлично , давайте разработаем концепцию красивого и интуитивно понятного интерфейса для комплексного мониторинга. Я разобью решение на несколько этапов , описывая структуру , элементы и возможные технологии. 1. Общая структура и принципы дизайна: Клиент-ориентированность: Каждый заказчик видит только свои системы. Модульность: Разделение на системы , группы метрик (бизнес , инфраструктура , приложения) и детализированные графики. Визуальная иерархия: Четкое разделение элементов , использование размеров , цветов и отступов для указания важности. Интерактивность: Плавные переходы , всплывающие подсказки , фильтры и возможность кастомизации. Адаптивность: Корректное отображение на разных устройствах (десктопы , планшеты , мобильные). 2. Основные экраны и элементы интерфейса: Экран авторизации/выбора заказчика: Простая форма авторизации. После авторизации – список доступных заказчиков (если у пользователя есть доступ к нескольким). Главная панель (Dashboard) для заказчика: Обзор: Краткая сводка по всем системам заказчика: Индикаторы состояния (зеленый/желтый/красный) для каждой системы. Ключевые метрики (например , количество активных пользователей , среднее время ответа) в виде небольших карточек или графиков. Список систем: Визуальное представление систем заказчика. Варианты: Карточки: Каждая система – отдельная карточка с названием , кратким описанием , индикатором состояния и ссылкой на детали. Сетка (Grid): Иконки систем в сетке. Список: Простой список систем с основными данными. Поиск: Позволяет быстро найти нужную систему по названию. Страница системы (System View): Заголовок: Название системы , описание , владелец (контактная информация). Вкладки/Навигация: Разделение на группы метрик: Бизнес-метрики: Показатели , важные для бизнеса (например , выручка , конверсия , количество заказов). Инфраструктурные метрики: Показатели , связанные с инфраструктурой (например , загрузка CPU , использование памяти , дисковое пространство). Метрики приложений: Показатели , связанные с приложениями (например , время ответа API , количество ошибок , количество запросов). Логи: Отображение логов системы Список метрик в каждой группе: Список доступных метрик с возможностью фильтрации и поиска. Для каждой метрики: Название. Текущее значение. Мини-график (sparkline) за последний период. Индикатор тренда (вверх/вниз/стабильно). Кнопка "Подробнее в Grafana": Переход к детальным графикам в Grafana для выбранной метрики. (Важно: Передача контекста в Grafana – см. раздел "Интеграция с Grafana"). Страница детализированной метрики (Metric Detail): (Обычно это Grafana , но может быть и отдельная страница в вашем приложении , если необходимо). График метрики за выбранный период времени. Возможность выбора периода времени (последний час , день , неделя , месяц , произвольный диапазон). Возможность масштабирования графика. Возможность добавления аннотаций (например , для отметки важных событий). Возможность экспорта данных. 3. Технологии (примерный стек): Frontend: React , Angular , Vue.js: Современные JavaScript-фреймворки для создания интерактивных пользовательских интерфейсов. React – наиболее популярный и гибкий вариант. TypeScript: Статическая типизация для повышения надежности кода. UI-библиотеки: Material UI , Ant Design , Chakra UI – готовые компоненты для быстрого создания красивого интерфейса. Графики: Chart.js , Recharts , Nivo – библиотеки для построения графиков. Backend: Node.js (Express) , Python (Flask/Django) , Java (Spring Boot): Для обработки запросов , авторизации , доступа к данным. Выбор зависит от ваших навыков и предпочтений. База данных: PostgreSQL , MySQL , MongoDB – для хранения данных о системах , метриках и настройках пользователей. Мониторинг и сбор метрик: Prometheus: Популярная система мониторинга и сбора метрик. Grafana: Для визуализации метрик и создания дашбордов. Telegraf , Collectd: Агенты для сбора метрик с различных систем. Коммуникация: REST API: Для взаимодействия между frontend и backend. WebSockets: Для обновления данных в реальном времени (например , для живых графиков). 4. Интеграция с Grafana: URL-шаблоны: Создайте URL-шаблоны для перехода в Grafana с передачей параметров , таких как: datasource: Имя источника данных в Grafana. query: Запрос для получения метрики. variables: Значения переменных Grafana (например , период времени). Single Sign-On (SSO): Если возможно , настройте SSO между вашим приложением и Grafana , чтобы пользователям не приходилось вводить логин и пароль повторно. Встраивание Grafana (iFrame): В некоторых случаях можно встроить Grafana-дашборд в ваше приложение с помощью iFrame , но это может быть менее гибким и безопасным решением. 5. Дополнительные рекомендации: Ролевая модель доступа: Определите роли пользователей (например , администратор , оператор , зритель) и настройте права доступа к системам и метрикам. Уведомления и алерты: Реализуйте систему уведомлений о критических событиях (например , превышение пороговых значений). Кастомизация: Предоставьте пользователям возможность настраивать дашборды , выбирать метрики и создавать собственные графики. Документация: Напишите подробную документацию для пользователей и администраторов. Тестирование: Проведите тщательное тестирование интерфейса , чтобы убедиться в его удобстве и функциональности. Примерная структура папок frontend (React): src/ components/ # Переиспользуемые компоненты UI SystemCard.js MetricItem.js ... pages/ # Страницы приложения Dashboard.js SystemView.js MetricDetail.js services/ # Логика взаимодействия с backend api.js utils/ # Вспомогательные функции App.js index.jsПримерная структура backend (Node.js/Express): routes/ systems.js metrics.js users.js controllers/ systemController.js metricController.js userController.js models/ System.js Metric.js User.js app.jsКак начать: 1. Определите MVP (Minimum Viable Product): Сосредоточьтесь на основных функциях и реализуйте их в первую очередь. 2. Создайте макеты (wireframes) и прототипы: Протестируйте интерфейс с пользователями на ранних этапах разработки. 3. Используйте гибкие методологии разработки (Agile/Scrum): Разбивайте проект на небольшие итерации и постоянно собирайте обратную связь. Надеюсь , это поможет вам создать отличный интерфейс для комплексного мониторинга! Если у вас есть какие-либо вопросы , не стесняйтесь спрашивать. Я готов помочь вам на каждом этапе разработки. ,
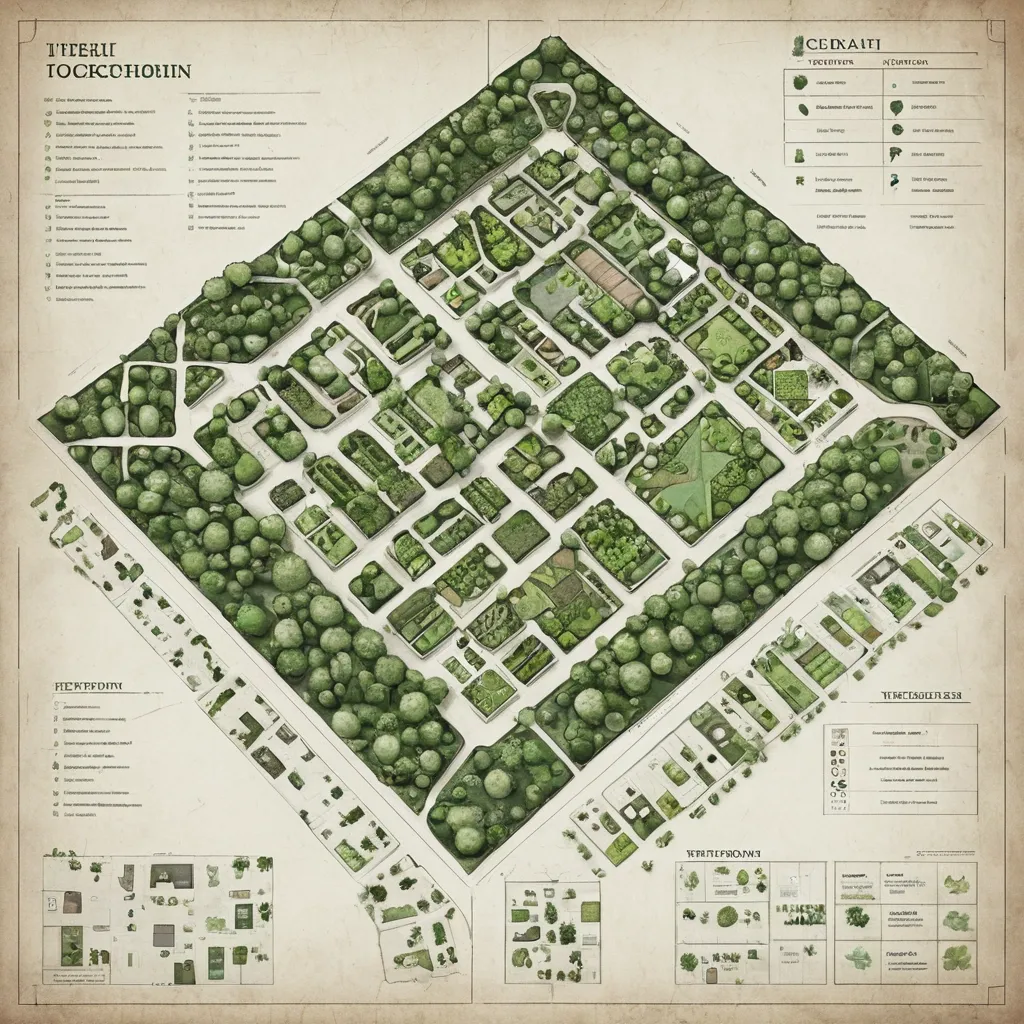
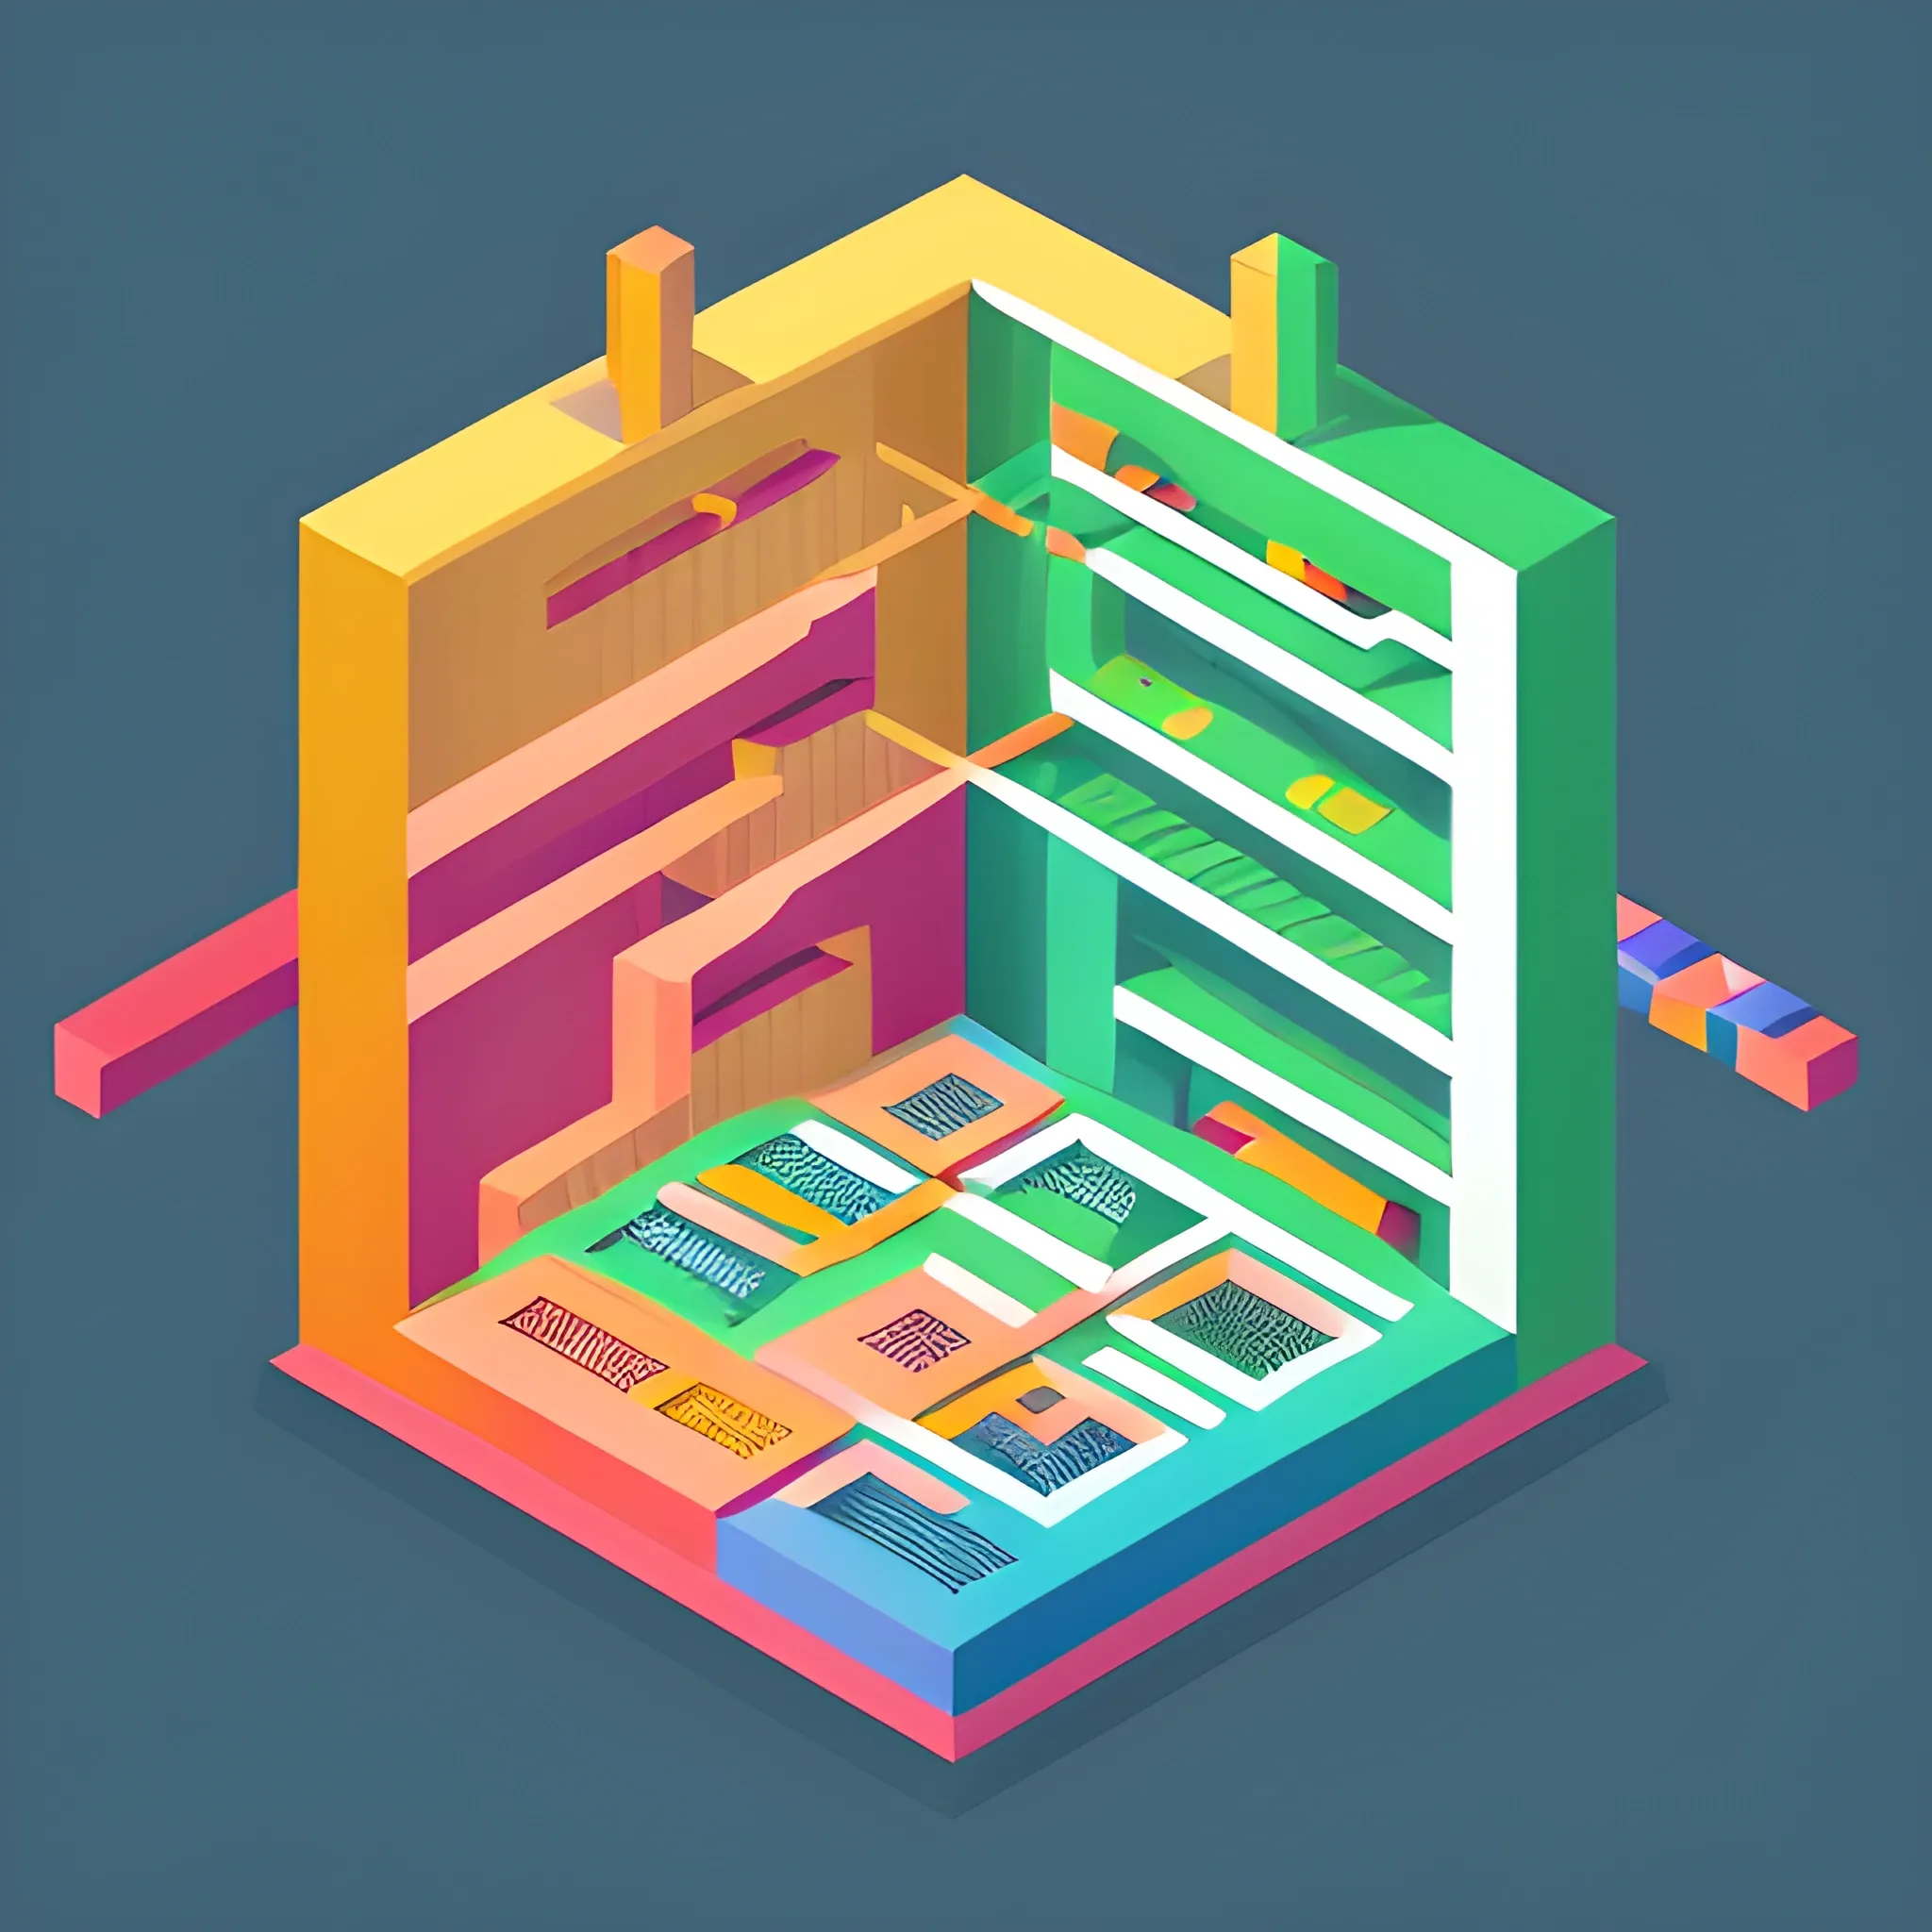
Here’s the **complete top-down layout and floor organization** of the Unsilenced Clocktower — integrating your new **Herbalist Greenhouse** and **Training Chamber** while keeping visual , architectural , and thematic consistency. It’s structured for easy translation into a map or illustration prompt. --- # 🕰 **The Unsilenced Clocktower – Structural Blueprint** ### **Architectural Style** Black-iron framework with brass support columns , gear-driven lifts , crystal illumination , and alchemic energy conduits linking all levels. Vertical balance: **industrial base → residential middle → arcane summit.** All spaces connected via a central spiral stair and a teleport-lift running on the Eye of Hours’ pulse. --- ## **LEVEL 1 – Ground Floor: Reception & Archives** * **Purpose:** Guild entry , civilian interface , recordkeeping. * **Design:** * Tall iron-framed doors leading to **Butler’s reception desk**. * **Civic archives** in brass filing cabinets , stamped with the seal of the Unsilenced. * Elevator cage and spiral stairs in the center. * Discreet door to **vault access** beneath the floor. * **Ambience:** Lamplit , orderly , faint hum of machinery underfoot. --- ## **LEVEL 2 – Guild Quarters & Workshop** * **Purpose:** Living space , repair , everyday operations. * **Features:** * **Workbenches** with open runic blueprints. * **Dorm alcoves** curtained with embroidered sigils for privacy. * Compact **kitchen and communal table** for late-night work sessions. * Tool racks , gears , pulleys , and mechanical prosthetics in progress. * **Lighting:** Warm brass sconces and crystal lamps. --- ## **LEVEL 3 – Training Chamber (Arcane Defense Hall)** * **Purpose:** Testing and tempering of artifacts and spells. * **Features:** * **Circular containment arena** with concentric obsidian runes. * Pivoting mirrors and magic-absorption conduits in walls. * Elevated **balcony** for observers and Orwen’s control console. * Equipment racks with enchanted weapons , armor , and focus tools. * Side alcove with **first aid and spell dampeners.** * **Lighting:** Alternating blue-white flashes , residual sparks , energy hum. --- ## **LEVEL 4 – Greenhouse Conservatory** * **Purpose:** Potioncraft , herb cultivation , magical flora study. * **Design:** * Glass dome roof with brass ribs , filled with lush plants glowing in warm mist. * **Alchemy benches** , hanging glass terrariums , and self-watering copper pipes. * Spiral stair leading to upper deck catwalks. * Containment terrarium for volatile plants under runic seals. * Connection door to the laboratory above via runic elevator. * **Lighting:** Natural light filtered through golden-tinted glass; ambient mist sparkle. --- ## **LEVEL 5 – Research Deck / Teleportation Dock** * **Purpose:** Central hub for Disc resonance studies. * **Features:** * **Resonator Table** at center (Disc analysis). * Floating quills and holographic projectors. * Side alcoves with teleport pads and sigil calibrators. * Window ring providing view of Trielta skyline. * Ladder access to observatory above. * **Lighting:** Cold white magical glow , subtle runic shimmer. --- ## **LEVEL 6 – Eye of Hours Observatory** * **Purpose:** Observation , navigation , and planar alignment. * **Design:** * Vast **crystal lens** suspended in clock-armature overhead. * Star charts , orreries , and arcane instruments scattered across floor. * A narrow catwalk circles the chamber , open to the skyline. * Viewport allows visual connection to distant ley-line convergence points. * **Lighting:** Moonlight refracted through rotating crystal , cool blues and golds. --- ### **STRUCTURAL EXTRAS** * **Vault (Sublevel):** Secure storage for Discs and relics , protected by Silence Ward. * **Exterior Balcony (adjacent to Greenhouse):** Overlooks Oldhut rooftops; used for sky readings and cooling brews. * **Hidden Lift Shaft:** connects levels 1 → 6 , running through the tower’s core , powered by Orwen’s leywheel. --- ### **Image Prompt for Top-Down Cutaway Map** > *A detailed fantasy cutaway illustration of a six-level clocktower headquarters , * blending **arcane architecture and steampunk design.** > Each level distinct: > > * reception hall (desks , ledgers , gears) , > * living workshop (bunks , tools , warmth) , > * training arena (obsidian rings , magical sparks) , > * greenhouse (glass dome , glowing plants , mist) , > * research lab (Resonator Table , runes , floating quills) , > * observatory (rotating crystal lens , starlight). > Include spiral stair and central lift through all floors. > Brass , iron , and crystal dominate the color palette; **golden light below , cool silver above.** > *Style:* semi-realistic digital painting , cinematic , highly detailed , slightly cutaway side view. ,
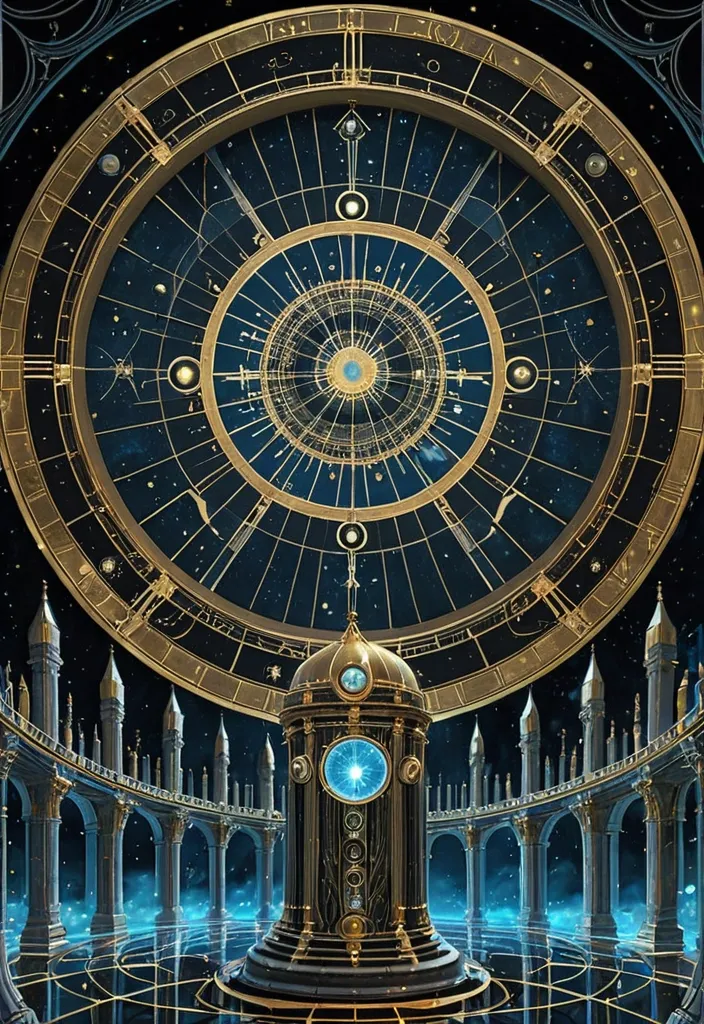
Crowning chamber beneath the great crystal lens of the Eye of Hours. Floor of polished obsidian inlaid with gold lines forming a vast clock face. The rotating crystal lens above refracts moonlight and city glow into shimmering beams. Brass telescopes , star charts , and rotating rings track celestial movement. A magical control dais projects faint holographic maps of the world’s ley lines. Wind from open vents moves robes and scrolls; a feeling of sacred science. Lighting: cool moonlight and crystal reflections , slight mist. Camera: low angle looking upward toward the lens. Style: hyper-detailed digital painting , golden and blue palette , awe-inspiring tone. ,
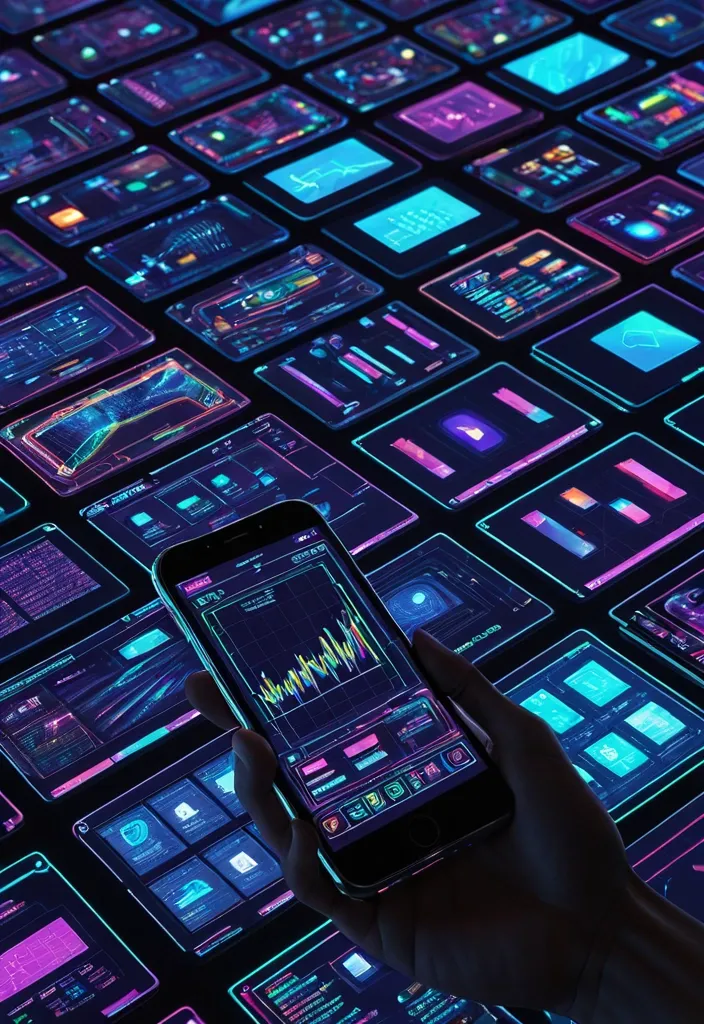
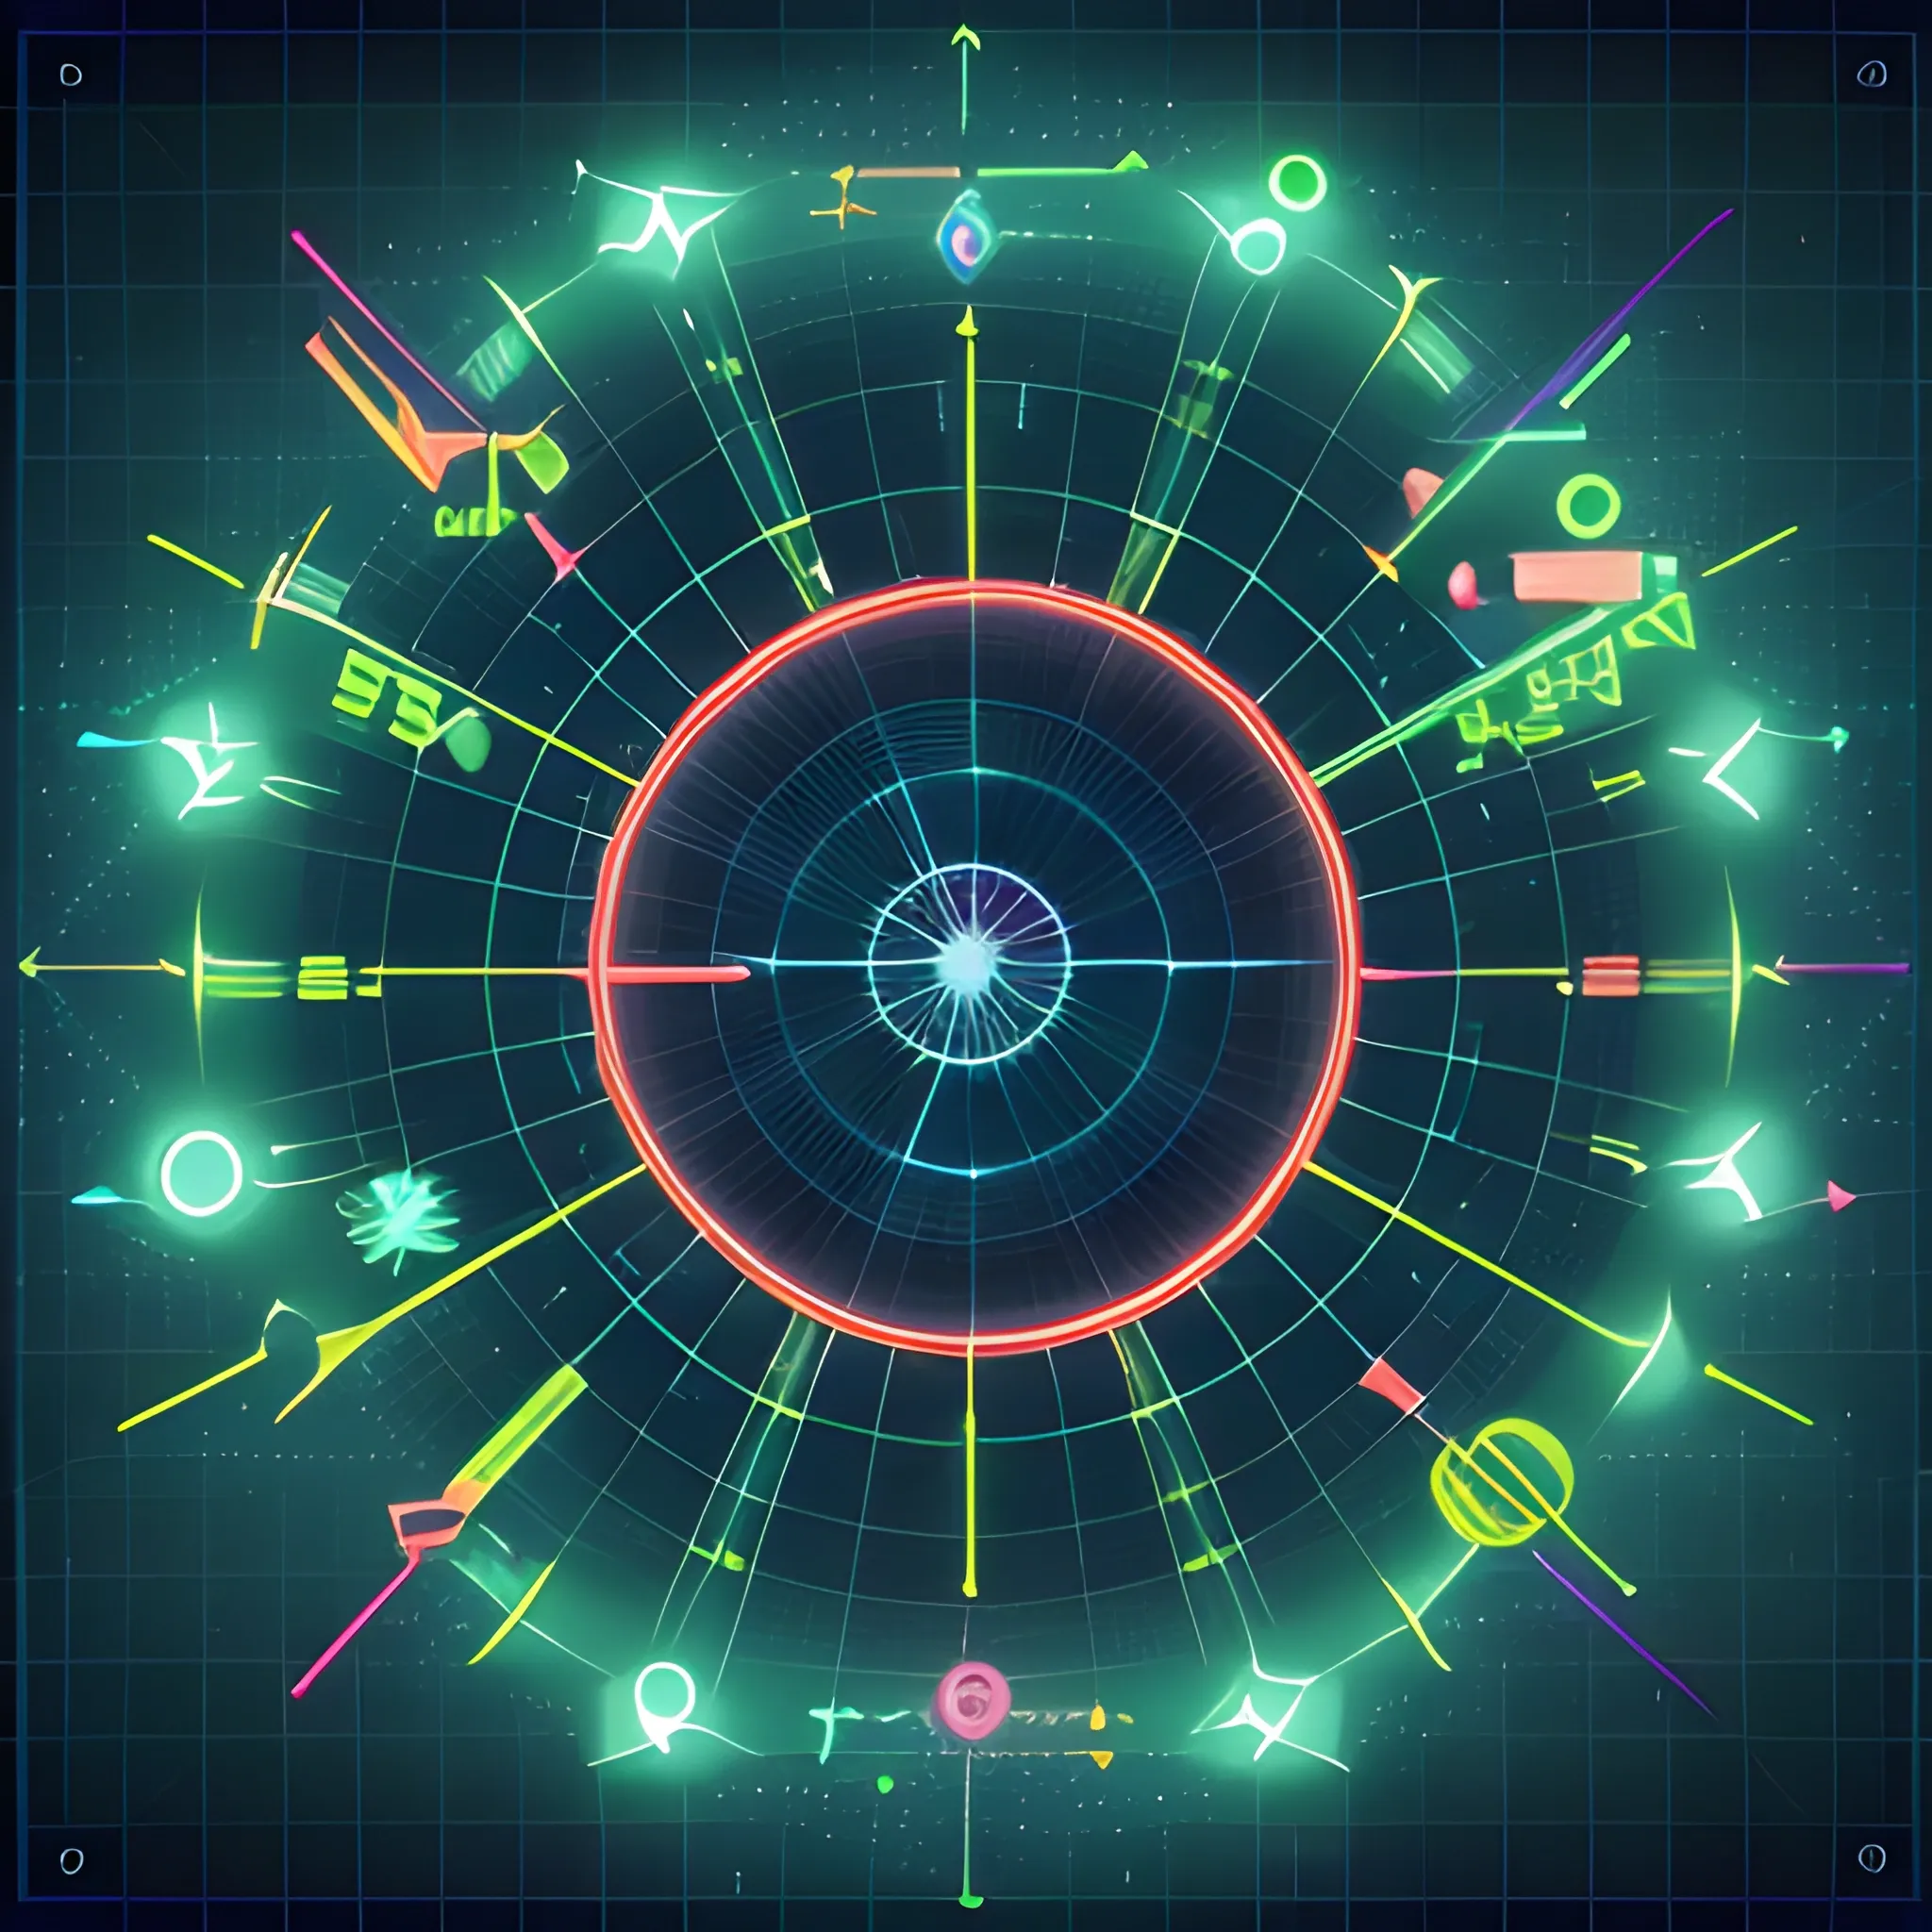
Futuristic realistic image of a next-generation of a human hand forming a decentralized search for a top-down view. The image is a digital interface , with high resolution and vivid colors , featuring intricate digital displays representing smartphone prices and electronic charts. The dynamic , neon colourful screens display an array of data and charts and information , with the coloured smartphones adding to the futuristic presentation. As the devices evolve towards the screen , they are enveloped in digital darkness. ,
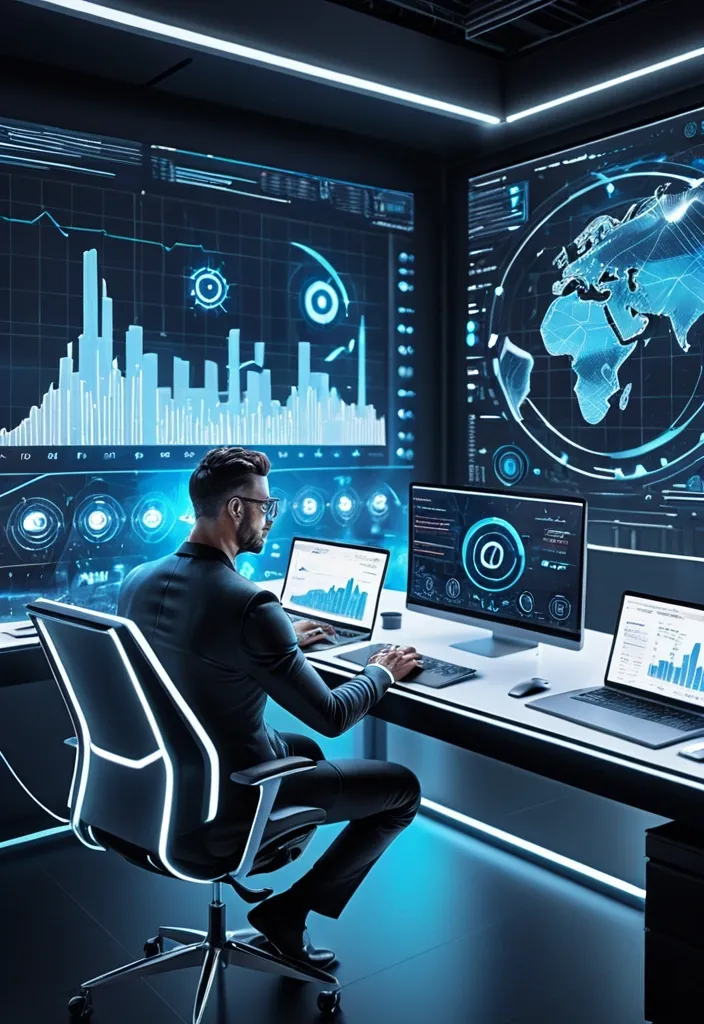
A futuristic digital workspace with floating screens displaying Email automation: Emails analyze performance metrics with charts and dashboards. A young man is sitting at the center , typing on a laptop with holographic Email automation rising around him , motion speed , symbolizing success and growth. ,
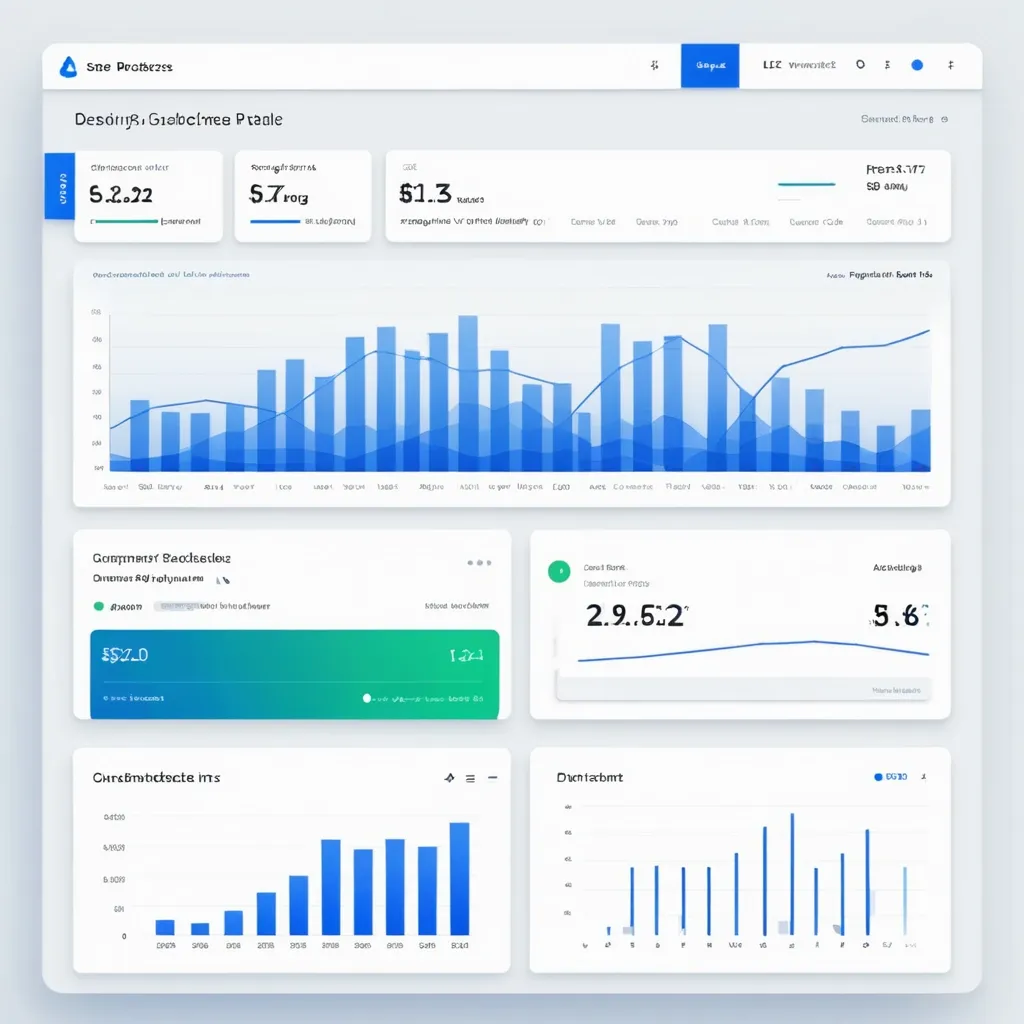
Design a clean , professional Analytics Page for the SynCloud Customer Portal. The page should focus on usage insights and billing alerts. Include the following features: Overview Cards (Top Section) Total API Requests (count) Total Compute Tokens used Current Billing Cycle Usage (percentage of quota consumed) Last Request Timestamp Budget Threshold Alerts Show colored alert bars at 50% , 80% , and 100% usage. Example: Green (50%) , Orange (80%) , Red (100%). Notifications panel showing recent alerts. Charts & Graphs Line chart: Daily API requests (last 7 days). Bar chart: Token consumption per week. Pie chart: Requests by service type (Playground , API , Agent). Detailed Usage History (Table) Columns: Date , Time , Request Type , Tokens Used , Status (Success/Failed). Search and filter by date range , request type. Option to export data as CSV/PDF. UX Considerations Sidebar navigation link highlighted: Analytics. Responsive layout (desktop + mobile). Minimal color palette with blue/white gradients and soft shadows. Tooltips on graphs for detailed insights. ,
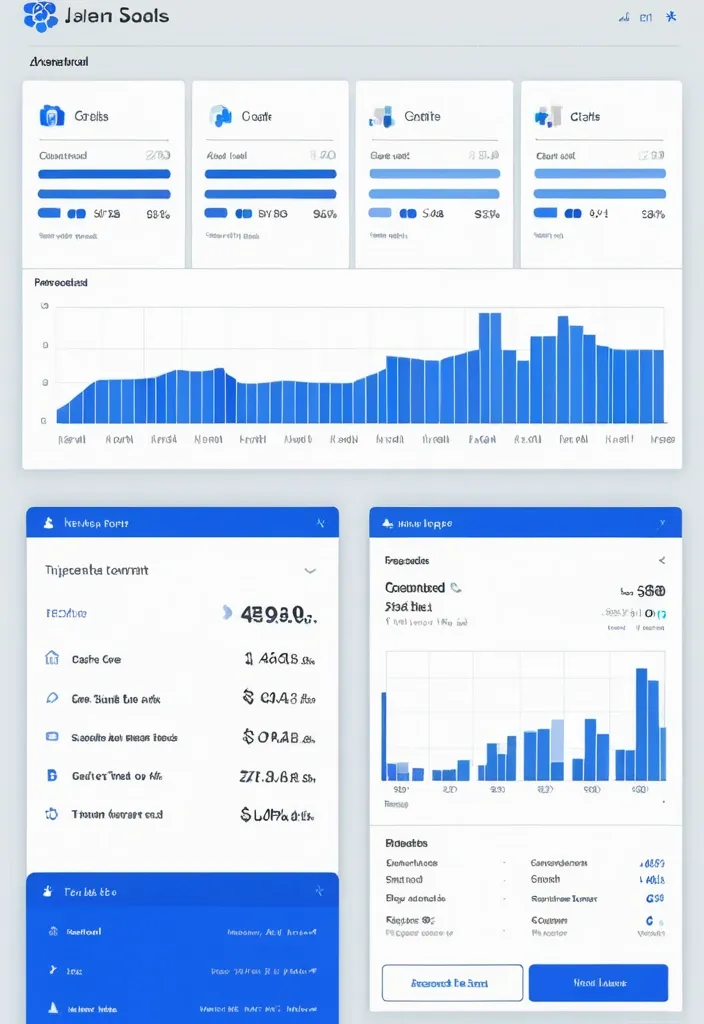
"Design a modern analytics dashboard for SynCloud Customer Portal. Show top stat cards: Total API Requests , Compute Tokens Used , Billing Cycle % with 50/80/100% alerts , and Last Request. Add visual charts: line chart for daily requests , bar chart for weekly token usage , pie chart for requests by service type. Include a usage history table with Date , Request Type , Tokens Used , Status , plus filters and export option. Clean SaaS style , sidebar navigation with Analytics highlighted , responsive design , blue/white theme , minimal and professional." ,


A modern , professional workspace with a computer screen displaying legal documents and charts , surrounded by confident business people from various professions (lawyer , director , accountant , HR specialist , doctor , educator). Bright , inviting colors , dynamic composition , focus on collaboration and efficiency. High-resolution , business style. ,
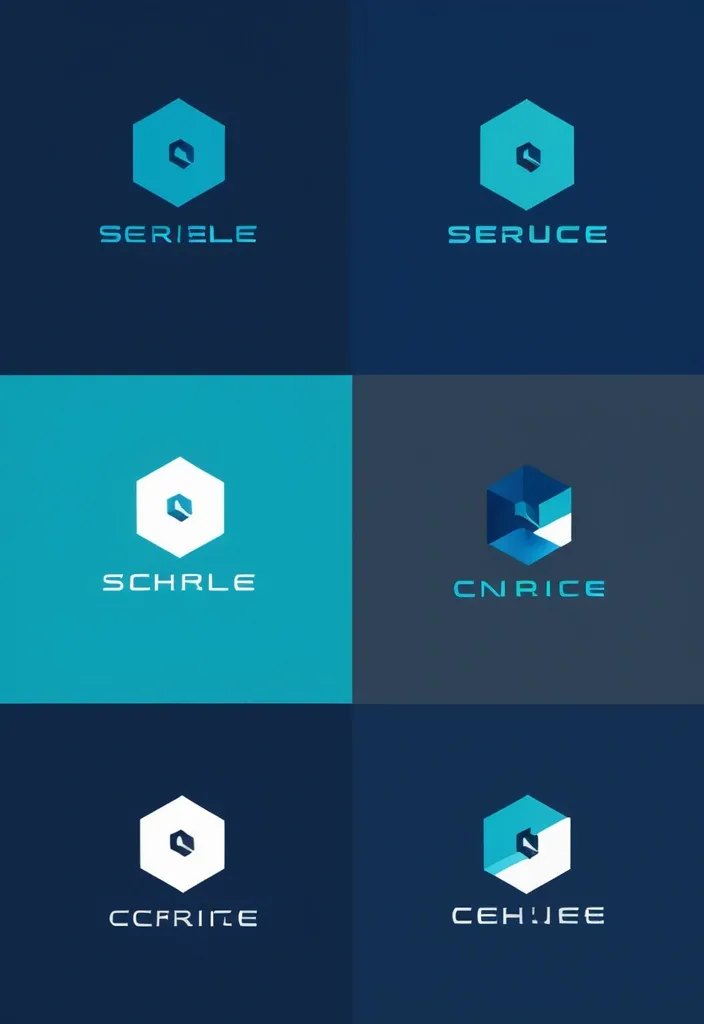
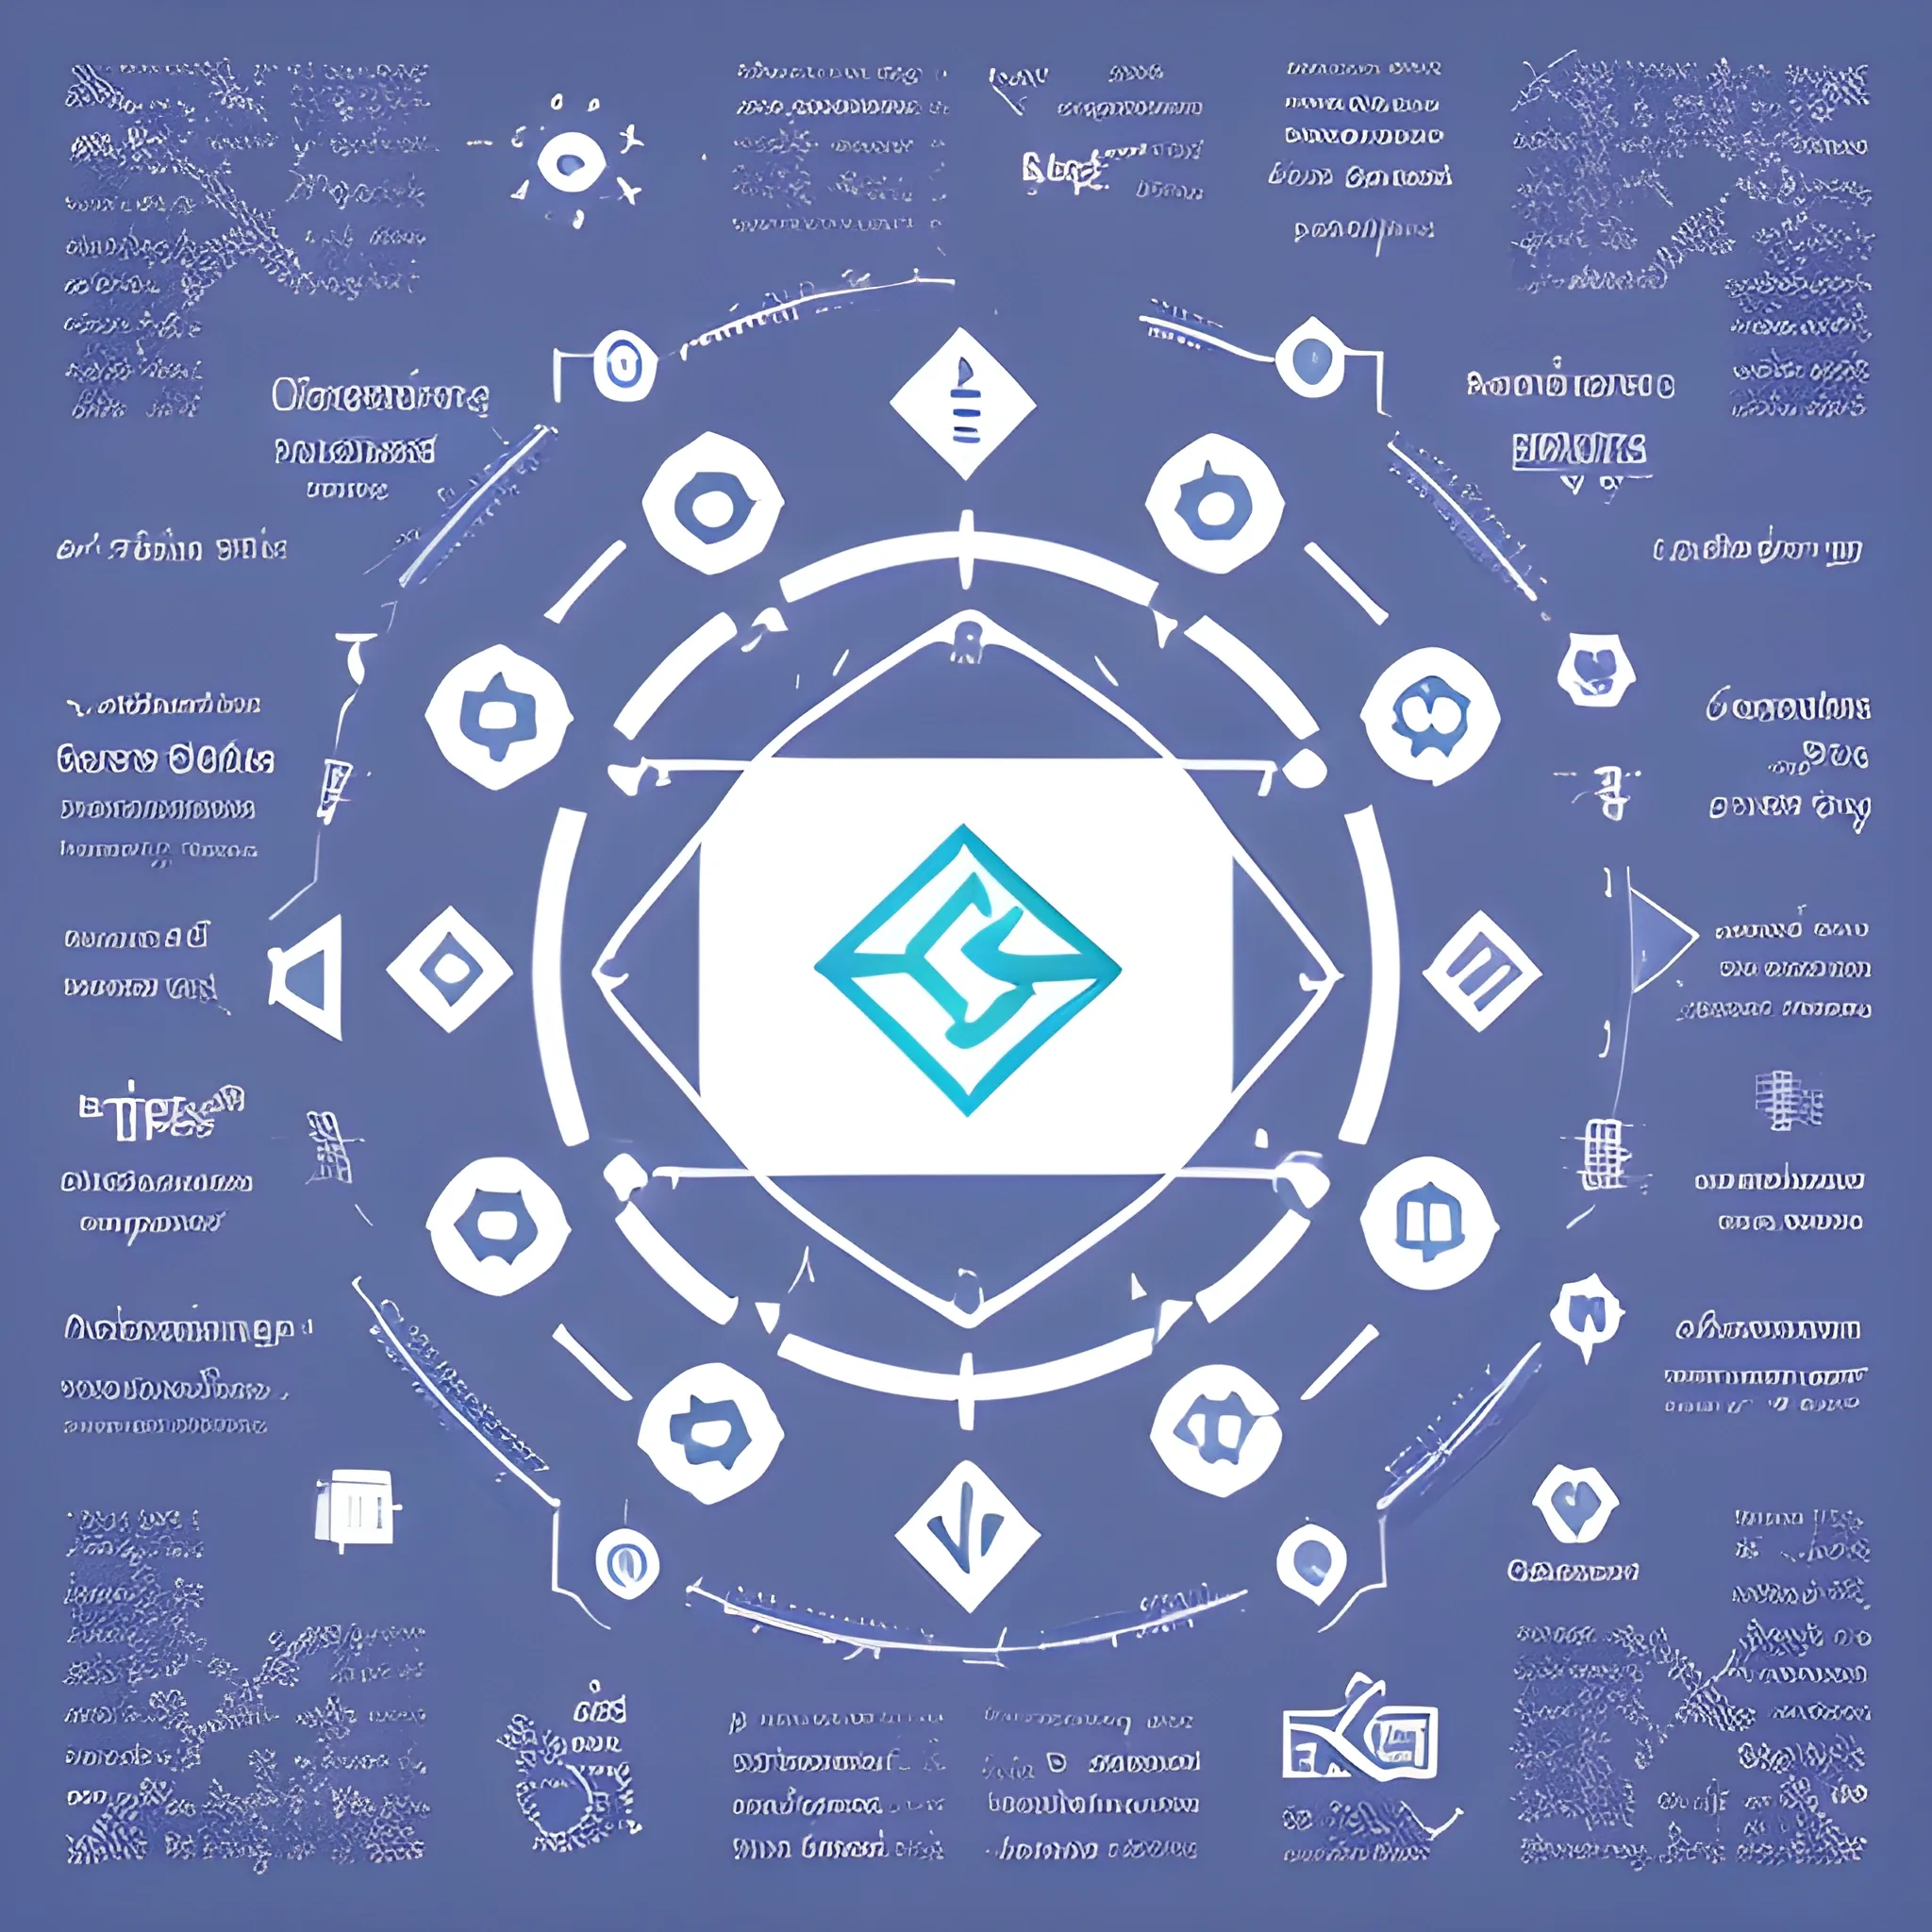
Design a modern and sleek logo for a digital trading platform. The core shape should be a hexagon , symbolizing strength , stability , and connectivity. The logo should convey trust , innovation , and speed — key traits of a cutting-edge trading environment. Incorporate subtle references to charts , graphs , or digital lines to hint at financial markets and data flow. Use a cool tech color palette (like navy , teal , silver , or electric blue) , and aim for a minimalist , professional style that appeals to both retail and institutional traders ,
# Employee Growth ## 1. Introduction This document outlines the UI/UX requirements for a website that monitors employee growth in software engineering companies. The platform will enable employees to track their competencies , team leaders to manage their team’s development , and SuperAdmins to oversee competency standards and book recommendations. ### **Target Audience** - **Employees**: View their competency matrix , track progress , and participate in 1:1 meetings. - **Team Leaders**: Manage their team’s competency growth , schedule 1:1 meetings , and provide guidance. - **SuperAdmins**: Manage competencies , approve book recommendations , and oversee system-wide progress. ### **Key Goals** - Provide a structured competency matrix. - Enable employees to track and improve their skills. - Facilitate team leaders in managing and mentoring their team members. - Allow SuperAdmins to maintain and update the competency framework. ## 2. User Roles and Permissions ### **Employee** - View personal competency matrix. - Track progress and assigned competencies. - Suggest book chapters for competencies. - Participate in 1:1 meetings. ### **Team Leader** - View and manage team members' competency progress. - Assign competencies to team members for improvement. - Conduct 1:1 meetings and maintain notes. - Participate in 1:1 meetings with upper management. ### **SuperAdmin** - Add and manage competencies. - Assign recommended books and chapters to competencies. - Approve or reject suggested book chapters from employees. - Oversee system-wide competency progress. ## 3. Core Features & Pages ### **1. Login Page** - Username and password authentication. - Role-based redirection (Employee , Team Leader , SuperAdmin). ### **2. Main Page - Competency Matrix** - Displays all available competencies. - Clickable competencies to view details. ### **3. Engineer Page (Dashboard)** - Charts displaying progress in current role. - Percentage completion of competencies required for the next level. ### **4. Team Page (For Team Leaders)** - List of engineers under management. - Overview of each engineer’s competencies and their current focus areas. ### **5. 1:1 Meetings Page(optional)** - List of scheduled and past 1:1 meetings. - Notepad feature for meeting notes. - History of past competencies assigned and progress. ### **6. SuperAdmin Competency Management** - Add , edit , or remove competencies. - Assign recommended book chapters. - Review and approve book suggestions from users. ## 4. User Flow 1. User logs in. 2. Employees navigate to their competency matrix. 3. Team leaders access the team page to monitor and assign competencies. 4. Employees and team leaders conduct 1:1 meetings. 5. SuperAdmins manage competencies and book recommendations. ## 5. Design & Style Guidelines - **Primary Color**: To be specified. - **UI Style**: Clean , modern , and intuitive. - **Typography**: Readable font with sufficient spacing. ## 6. Data & Metrics - Competency scores (1-5 scale) displayed in charts. - Overall role mastery percentage. - Historical competency trends. ## 7. Interaction & Feedback (Optional) - Clickable competencies with tooltips and descriptions. - Notifications for assigned competencies. - Confirmation prompts for major actions. ,

# Employee Growth ## 1. Introduction This document outlines the UI/UX requirements for a website that monitors employee growth in software engineering companies. The platform will enable employees to track their competencies , team leaders to manage their team’s development , and SuperAdmins to oversee competency standards and book recommendations. ### **Target Audience** - **Employees**: View their competency matrix , track progress , and participate in 1:1 meetings. - **Team Leaders**: Manage their team’s competency growth , schedule 1:1 meetings , and provide guidance. - **SuperAdmins**: Manage competencies , approve book recommendations , and oversee system-wide progress. ### **Key Goals** - Provide a structured competency matrix. - Enable employees to track and improve their skills. - Facilitate team leaders in managing and mentoring their team members. - Allow SuperAdmins to maintain and update the competency framework. ## 2. User Roles and Permissions ### **Employee** - View personal competency matrix. - Track progress and assigned competencies. - Suggest book chapters for competencies. - Participate in 1:1 meetings. ### **Team Leader** - View and manage team members' competency progress. - Assign competencies to team members for improvement. - Conduct 1:1 meetings and maintain notes. - Participate in 1:1 meetings with upper management. ### **SuperAdmin** - Add and manage competencies. - Assign recommended books and chapters to competencies. - Approve or reject suggested book chapters from employees. - Oversee system-wide competency progress. ## 3. Core Features & Pages ### **1. Login Page** - Username and password authentication. - Role-based redirection (Employee , Team Leader , SuperAdmin). ### **2. Main Page - Competency Matrix** - Displays all available competencies. - Clickable competencies to view details. ### **3. Engineer Page (Dashboard)** - Charts displaying progress in current role. - Percentage completion of competencies required for the next level. ### **4. Team Page (For Team Leaders)** - List of engineers under management. - Overview of each engineer’s competencies and their current focus areas. ### **5. 1:1 Meetings Page(optional)** - List of scheduled and past 1:1 meetings. - Notepad feature for meeting notes. - History of past competencies assigned and progress. ### **6. SuperAdmin Competency Management** - Add , edit , or remove competencies. - Assign recommended book chapters. - Review and approve book suggestions from users. ## 4. User Flow 1. User logs in. 2. Employees navigate to their competency matrix. 3. Team leaders access the team page to monitor and assign competencies. 4. Employees and team leaders conduct 1:1 meetings. 5. SuperAdmins manage competencies and book recommendations. ## 5. Design & Style Guidelines - **Primary Color**: To be specified. - **UI Style**: Clean , modern , and intuitive. - **Typography**: Readable font with sufficient spacing. ## 6. Data & Metrics - Competency scores (1-5 scale) displayed in charts. - Overall role mastery percentage. - Historical competency trends. ## 7. Interaction & Feedback (Optional) - Clickable competencies with tooltips and descriptions. - Notifications for assigned competencies. - Confirmation prompts for major actions. ,
# Employee Growth ## 1. Introduction This document outlines the UI/UX requirements for a website that monitors employee growth in software engineering companies. The platform will enable employees to track their competencies , team leaders to manage their team’s development , and SuperAdmins to oversee competency standards and book recommendations. ### **Target Audience** - **Employees**: View their competency matrix , track progress , and participate in 1:1 meetings. - **Team Leaders**: Manage their team’s competency growth , schedule 1:1 meetings , and provide guidance. - **SuperAdmins**: Manage competencies , approve book recommendations , and oversee system-wide progress. ### **Key Goals** - Provide a structured competency matrix. - Enable employees to track and improve their skills. - Facilitate team leaders in managing and mentoring their team members. - Allow SuperAdmins to maintain and update the competency framework. ## 2. User Roles and Permissions ### **Employee** - View personal competency matrix. - Track progress and assigned competencies. - Suggest book chapters for competencies. - Participate in 1:1 meetings. ### **Team Leader** - View and manage team members' competency progress. - Assign competencies to team members for improvement. - Conduct 1:1 meetings and maintain notes. - Participate in 1:1 meetings with upper management. ### **SuperAdmin** - Add and manage competencies. - Assign recommended books and chapters to competencies. - Approve or reject suggested book chapters from employees. - Oversee system-wide competency progress. ## 3. Core Features & Pages ### **1. Login Page** - Username and password authentication. - Role-based redirection (Employee , Team Leader , SuperAdmin). ### **2. Main Page - Competency Matrix** - Displays all available competencies. - Clickable competencies to view details. ### **3. Engineer Page (Dashboard)** - Charts displaying progress in current role. - Percentage completion of competencies required for the next level. ### **4. Team Page (For Team Leaders)** - List of engineers under management. - Overview of each engineer’s competencies and their current focus areas. ### **5. 1:1 Meetings Page(optional)** - List of scheduled and past 1:1 meetings. - Notepad feature for meeting notes. - History of past competencies assigned and progress. ### **6. SuperAdmin Competency Management** - Add , edit , or remove competencies. - Assign recommended book chapters. - Review and approve book suggestions from users. ## 4. User Flow 1. User logs in. 2. Employees navigate to their competency matrix. 3. Team leaders access the team page to monitor and assign competencies. 4. Employees and team leaders conduct 1:1 meetings. 5. SuperAdmins manage competencies and book recommendations. ## 5. Design & Style Guidelines - **Primary Color**: To be specified. - **UI Style**: Clean , modern , and intuitive. - **Typography**: Readable font with sufficient spacing. ## 6. Data & Metrics - Competency scores (1-5 scale) displayed in charts. - Overall role mastery percentage. - Historical competency trends. ## 7. Interaction & Feedback (Optional) - Clickable competencies with tooltips and descriptions. - Notifications for assigned competencies. - Confirmation prompts for major actions. ,
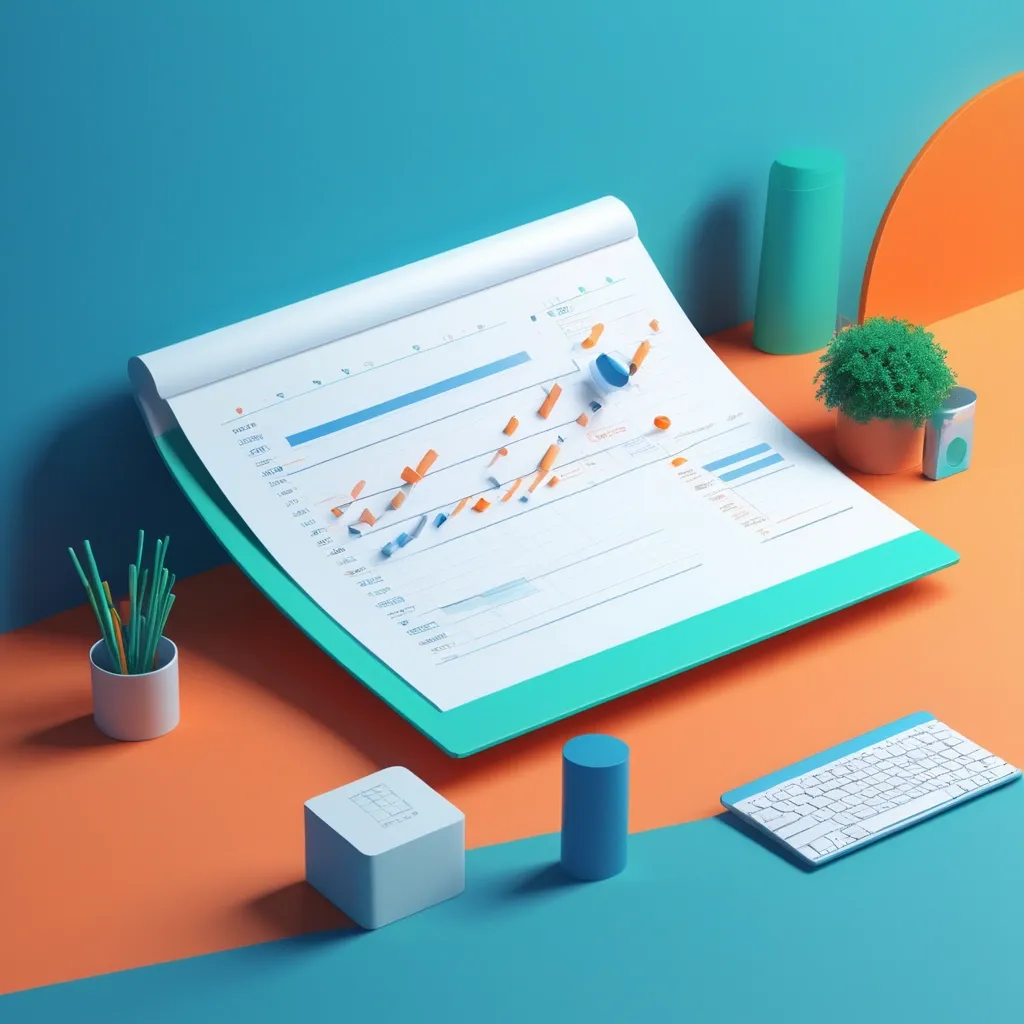
Create a vibrant and modern 3D illustration for a marketing and advertising-themed banner. The image should include: 3D growth charts , upward-pointing arrows , a laptop with analytical data on the screen , chatbot characters in 3D , landing pages with interface elements , and ad banners. Add elements related to preparing for ad campaigns: 3D checklists , a notebook with a plan , a calendar , and analytical tools. Use bright colors like blue , orange , white , and green to convey professionalism , growth , and success. The style should be modern 3D rendering with soft shadows , realistic textures , and subtle neon glows for accents. The background should be minimalistic , with abstract 3D shapes or a gradient , ensuring it doesn’t distract from the main elements. Lighting should be soft , with a focus on the central objects. ,


Generate an artistic and hyperrealistic image for the cover of a university course entitled 'Artificial Intelligence in University Teaching'. The image should convey a fusion between technology and education. Visualize a classic university classroom with a blackboard in the background , covered with mathematical equations and flowcharts representing artificial intelligence algorithms. In front of the blackboard , a silhouette of a professor in a teaching pose , with one arm raised as if explaining a concept. The professor is a fusion between a human and a cyborg , his right half is a human-looking professor in academic clothing , while the left half is a stylized representation of circuits and gears , symbolizing artificial intelligence. In the foreground , a holographic version of a human brain floats in the air , radiating with a soft , pulsating light. The brain is surrounded by floating lines of digital code , symbolizing learning and information processing. The overall tone of the image is futuristic , but also welcoming , with a color palette that combines cool shades of blues and grays with warm tones of golds and browns. The course title , 'Artificial Intelligence in University Teaching' , is present in large , modern letters at the top or bottom of the image. ,
A carefully organized array of multicolored bar graphs and pie charts stretches out across a meticulously designed landscape , resembling an intricate , isometric technical drawing. Each element of the illustration represents specific numerical data points from a savings account , the visual language of the image trading specificity for a sense of vastness. A sense of awe and wonder pervades the piece as the viewer is invited to explore the colorful , coded information , a hidden story revealed within the layers. [prompt] - [isometric technical drawing] ,


Design a simple logo for a cutting-edge innovation and strategy company that leverages the power of data science. The logo should reflect the company's forward-thinking approach and expertise in data-driven decision-making. Consider incorporating elements that symbolize data , such as charts , graphs , or data points , to represent the core of their work. At the same time , include elements that convey innovation and strategy , such as arrows , gears , or abstract symbols of creativity. Ensure that the logo is clean , memorable , and adaptable for various applications , from business cards to digital platforms. The design should communicate trust , expertise , and a commitment to guiding businesses into the future through data science and strategic innovation ,