Search Results for board
Explore AI generated designs, images, art and prompts by top community artists and designers.
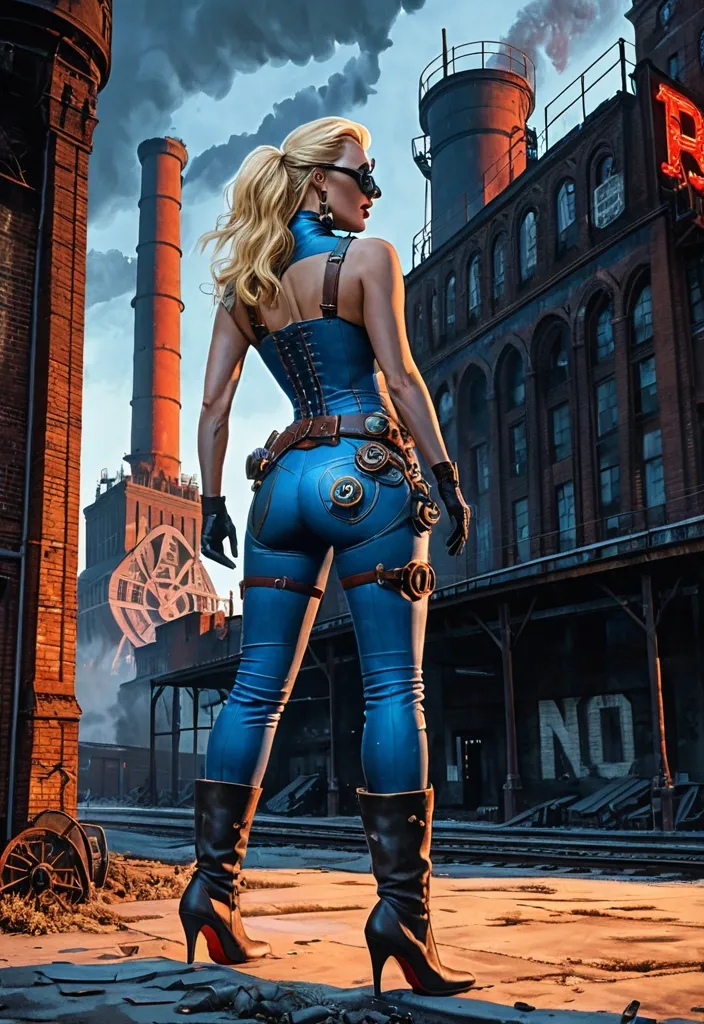

From behind view of a blonde woman wearing dirty form-fitting blue leather belt holster and pouch , pale strong thighs in blue jean long-pant step on a steampunk gearbox , she is opening an old folded map. In the background is A colossal , derelict soviet-era factory silhouetted against a smog-filled sky , steam billowing from three tall broken smokestacks. Intricate steampunk gears and pipes snake across the decaying facade , hinting at a forgotten industrial past. tiny electric arcs between gears , sparking redhot. Floodlight on tower shining across view and illuminating her body curves. An old billboard with gothic letter POTOMAC on the wall. The scene is rendered in a painting by Jko , Norman Rockwell and Alex Ross and Gil Elvgren making a in full watercolor art style of. with dramatic , cinematic lighting , emphasizing deep shadows and a limited , desaturated color palette. , , steampunk engine ,
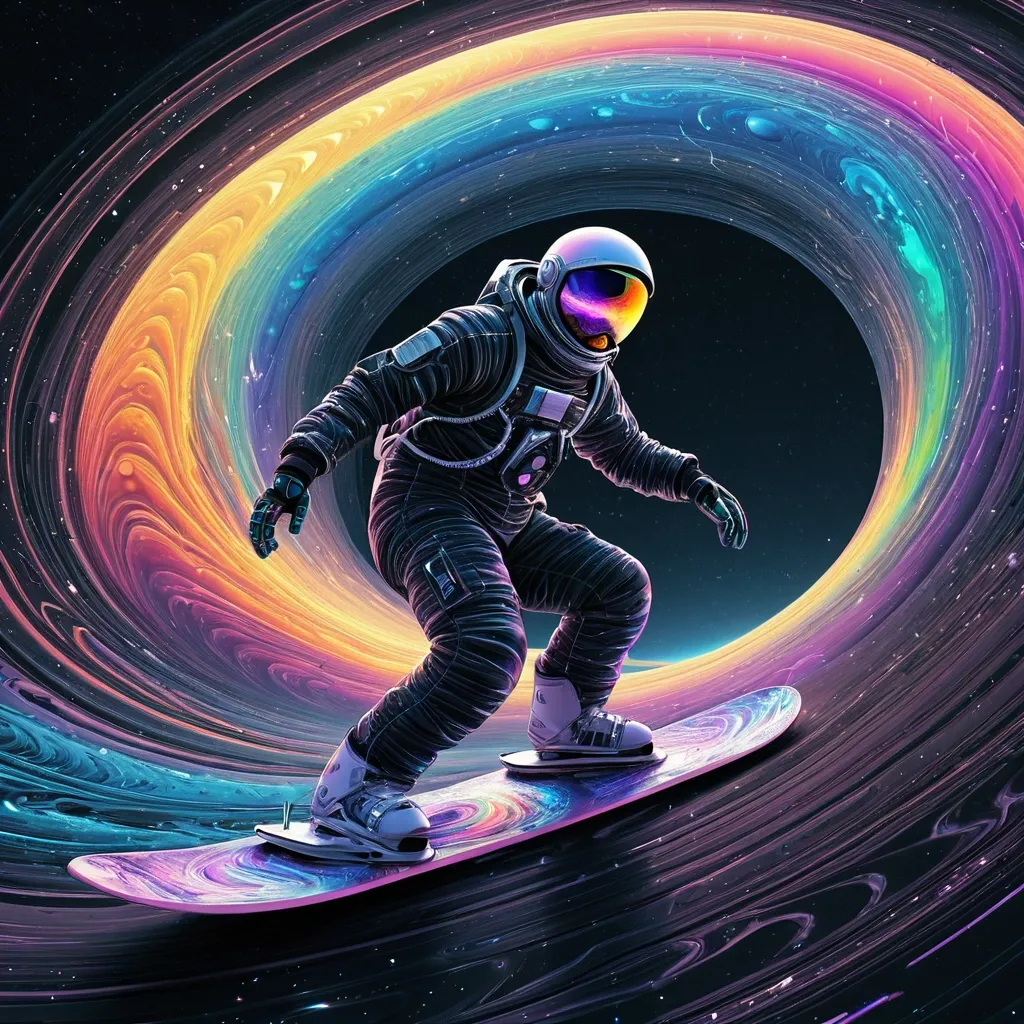
abstract vector fractal , Astronaut surfer riding a futuristic snowboard along the outer vortex rim of jupiter’s rings , carving motion , wave function , snowboard emitting ionized neon motion wave formed from rainbow colors in water filaments , jupiter’s massive gas-giant body dominating the background , bright ring debris scattering light , 3d shading , swirls curves. Star-filled sky , blending surf motion with a vivid futuristic fantasy , motion to down made of black hole in outer space. After crossing it , no signal of a response ever returns. ,
Create a surreal , abstract vector fractal image of an astronaut surfer navigating a sleek , futuristic snowboard through the turbulent , outer vortex rim of Jupiter's rings. The snowboard leaves a vibrant trail of ionized , neon-lit motion waves in shades of electric blue , magenta , and neon green , slicing through the dark , icy vastness. Jupiter's gas-giant body looms in the background , casting an ominous , elongated shadow that stretches across the star-filled sky. The scene is filled with an unsettling , cosmic energy , emphasized by 3D shading and swirling curves. The style should be moody and surreal , with a focus on dark , muted colors and intense textures. ,
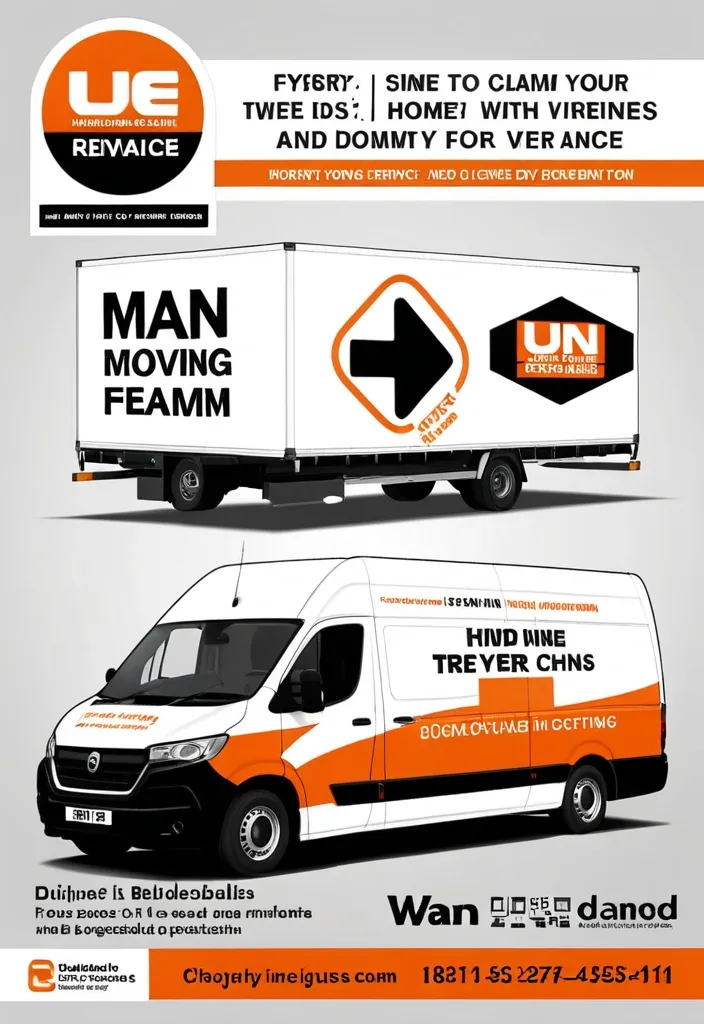
Modern professional flyer design for a UK removals company named “1 Van 1 Man Removals” , orange white and black color scheme , large moving van with company branding , cardboard boxes , clean corporate layout , bold typography , sections for About Us , Services Offered , Why Choose Us , Service Areas , and contact information , icons for home removals , furniture moving , man and van services , and house clearances , UK map graphic , modern gradients , glossy business flyer style , high quality marketing poster , realistic moving equipment and furniture , clean infographic layout , landscape format. ,
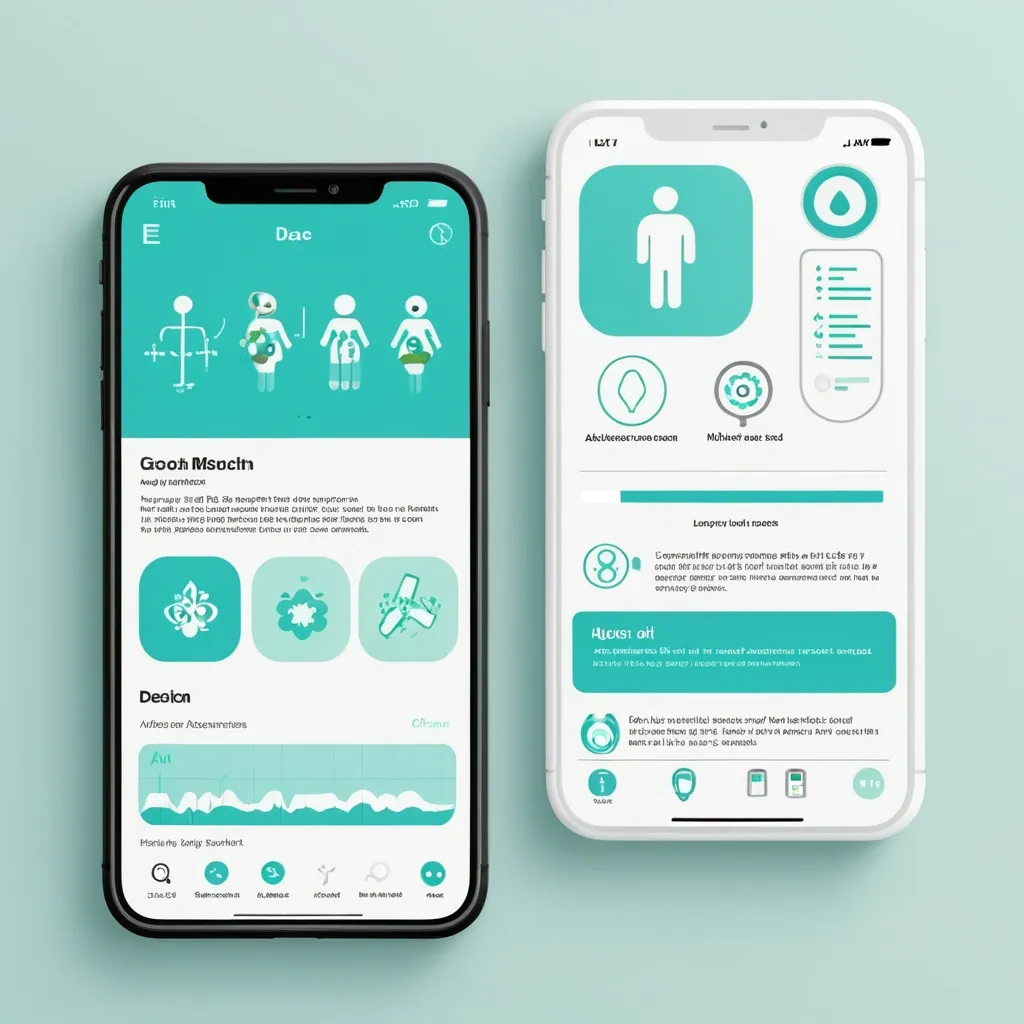
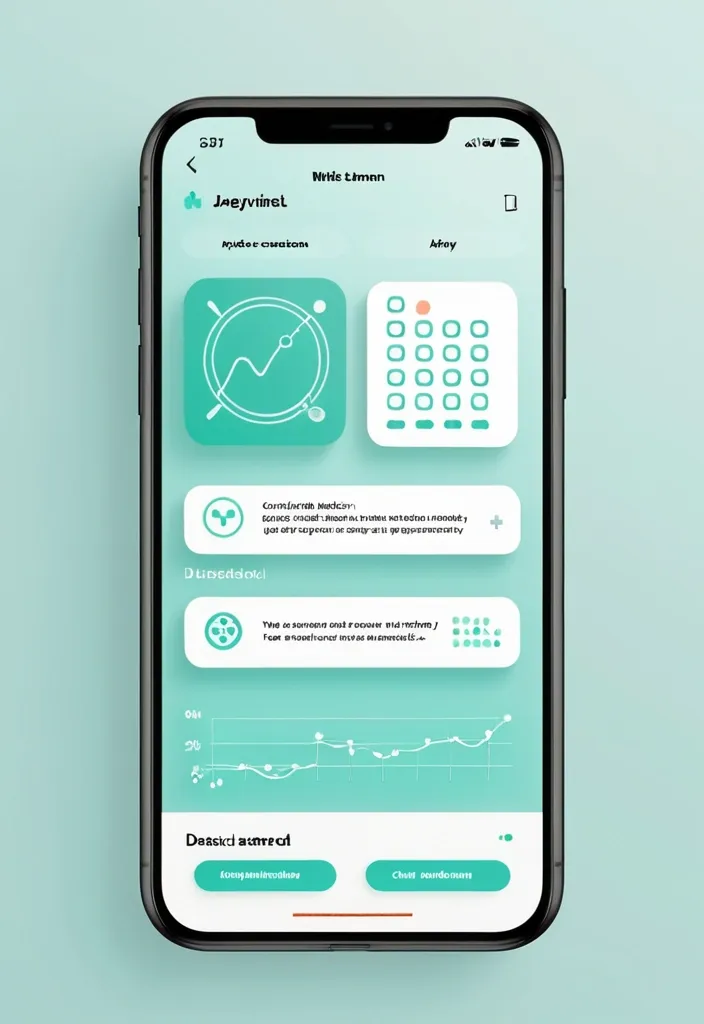
Разработай макет приложения для здоровья. Краткое описание идеи Приложение , которое: Распознает медицинские анализы по фото (ОАК , биохимия , гормоны и др.) Строит динамические графики показателей во времени Хранит заключения специалистов с возможностью поиска и структурирования Собирает профиль пользователя (пол , возраст , вес , хронические заболевания) Предоставляет AI-рекомендации по питанию , физической активности , ментальному здоровью. Философия дизайна «Забота и ясность» — дизайн должен создавать ощущение: ✅ Безопасности — пользователь доверяет приложению свои медицинские данные ✅ Профессионализма — научный подход , точность , надежность ✅ Заботы — теплота , поддержка , мотивация к здоровью ✅ Ясности — простота восприятия сложной медицинской информации. Mobile app UI design , medical health tracker dashboard , clean minimal style , soft pastel colors: primary turquoise #5DBCD2 , lavender #9B9ED6 , white background #F8FAFC , dark gray text #2D3748. Layout: Top greeting "Добрый день , Анна!" with health score circular widget (85/100 , mint green progress ring). Below: 4 rounded square quick-action cards with soft icons (Documents , Charts , AI Assistant , Appointments). Section "Последние анализы": two white cards with rounded corners (20px) , subtle shadow , each showing test name (🩸 Общий анализ крови) , date , and status badge (✓ Норма in mint green , ⚠ Повыш. in coral). AI recommendation card at bottom: soft gradient background , robot icon , short text tip about hydration. Bottom navigation bar: 5 icons (Home , Analytics , Add , Chat , Profile) , active icon in turquoise , blurred white background. Style: Medical Minimalism 2.0 , glassmorphism elements , soft UI , organic rounded shapes , calm aesthetic , professional but friendly. High fidelity , Figma-style mockup , iOS design guidelines , 375x812px frame , light mode. --ar 9:19 --style raw ,
Разработай макет приложения для здоровья. Краткое описание идеи Приложение , которое: Распознает медицинские анализы по фото (ОАК , биохимия , гормоны и др.) Строит динамические графики показателей во времени Хранит заключения специалистов с возможностью поиска и структурирования Собирает профиль пользователя (пол , возраст , вес , хронические заболевания) Предоставляет AI-рекомендации по питанию , физической активности , ментальному здоровью. Философия дизайна «Забота и ясность» — дизайн должен создавать ощущение: ✅ Безопасности — пользователь доверяет приложению свои медицинские данные ✅ Профессионализма — научный подход , точность , надежность ✅ Заботы — теплота , поддержка , мотивация к здоровью ✅ Ясности — простота восприятия сложной медицинской информации. Mobile app UI design , medical health tracker dashboard , clean minimal style , soft pastel colors: primary turquoise #5DBCD2 , lavender #9B9ED6 , white background #F8FAFC , dark gray text #2D3748. Layout: Top greeting "Добрый день , Анна!" with health score circular widget (85/100 , mint green progress ring). Below: 4 rounded square quick-action cards with soft icons (Documents , Charts , AI Assistant , Appointments). Section "Последние анализы": two white cards with rounded corners (20px) , subtle shadow , each showing test name (🩸 Общий анализ крови) , date , and status badge (✓ Норма in mint green , ⚠ Повыш. in coral). AI recommendation card at bottom: soft gradient background , robot icon , short text tip about hydration. Bottom navigation bar: 5 icons (Home , Analytics , Add , Chat , Profile) , active icon in turquoise , blurred white background. Style: Medical Minimalism 2.0 , glassmorphism elements , soft UI , organic rounded shapes , calm aesthetic , professional but friendly. High fidelity , Figma-style mockup , iOS design guidelines , 375x812px frame , light mode. --ar 9:19 --style raw ,
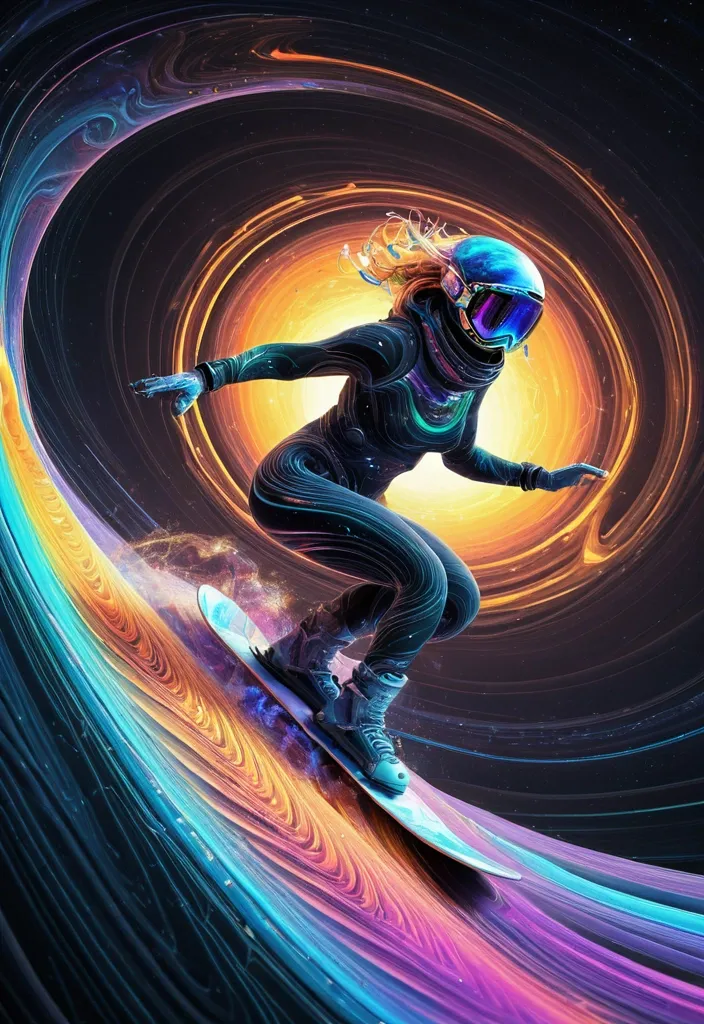
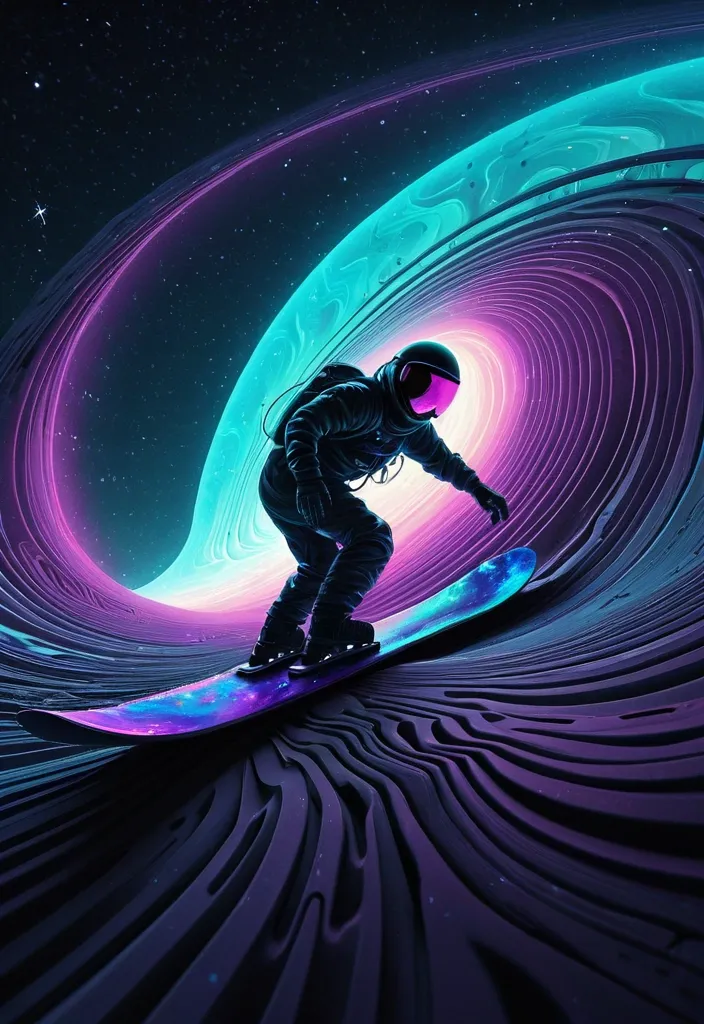
abstract vector fractal , female surfer riding a futuristic snowboard along the outer vortex rim of jupiter’s rings , carving motion , wave function , snowboard emitting ionized neon wave formed from rainbow colors in water filaments , jupiter’s massive gas-giant body dominating the background , bright ring debris scattering light , 3d shading , swirls curves. Star-filled sky , blending surf motion with a vivid futuristic fantasy , motion to down made of black hole in outer space. After crossing it , no signal of a response ever returns. ,
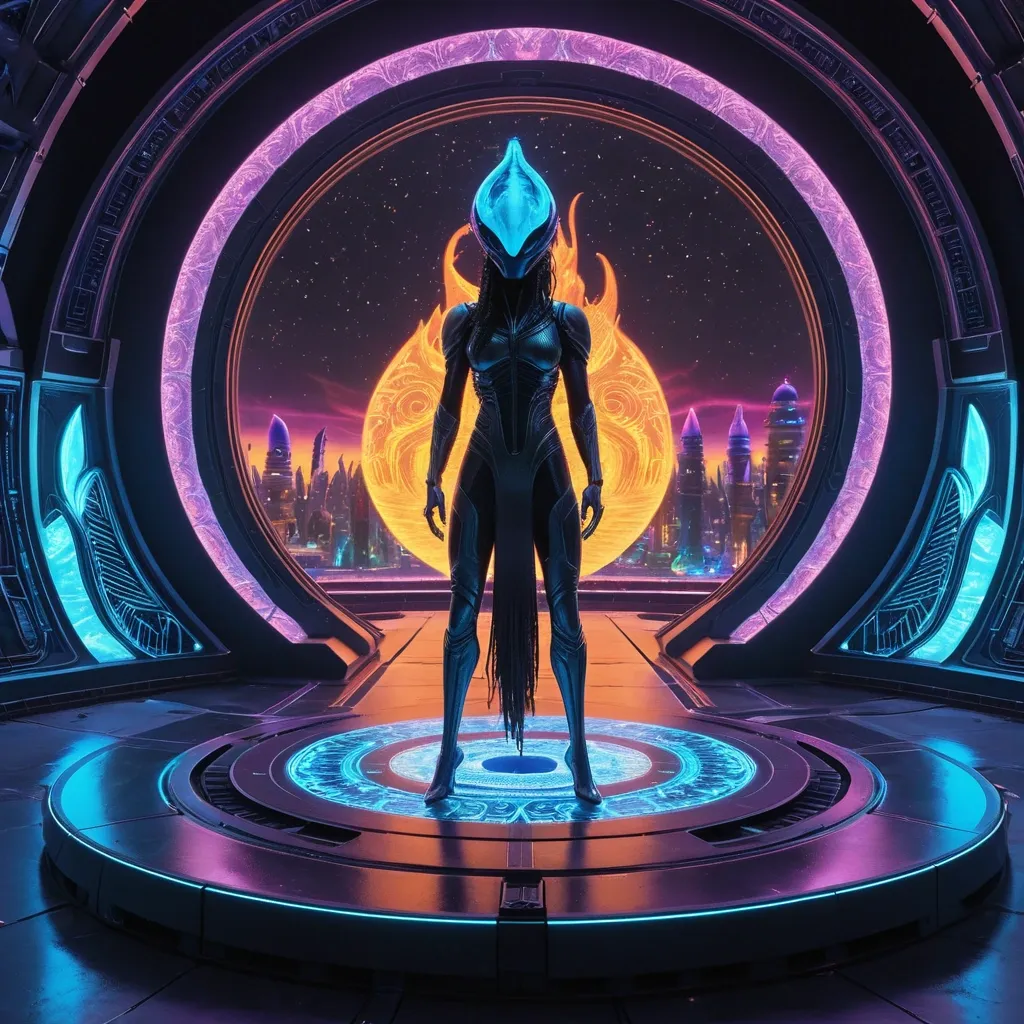
A Xenomorph man with flowing hair made of carpet gazes at a holographic portal of a lone tiny Aladdin (a 2019 American musical fantasy film and a live-action adaptation of Disney's 1992 animated film) in a sleek on surfboard , her helmet visor reflecting a busy space dock. The carpet is realistic , with blazing fires , reflective , which is intertwined with lush , alien flora. She stands on a crystalline platform overlooking a cityscape where nature and technology are seamlessly integrated. The style is photorealistic , with an emphasis on vivid color gradients and a sense of awe and wonder. ,
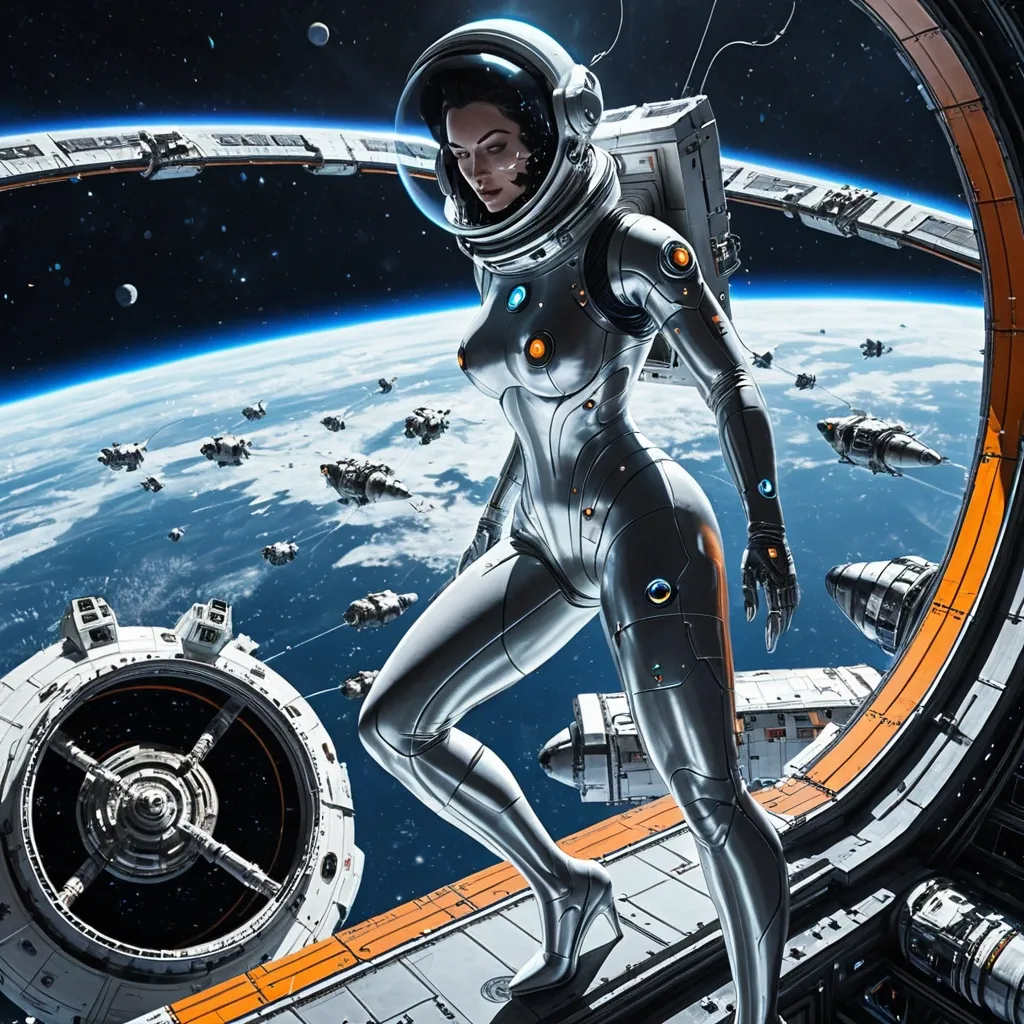
A lone female astronaut in a sleek , reflective , form-fitting latex suit drifts through the vacuum of space , her helmet visor reflecting a busy space dock. her pale strong thighs step on a futuristic surfer board firing up. The background is an angled view looking outside the outer ring of a huge space station with an outer ring; the outer ring has many docking ports with attached umbilical-beanstalk links to docked/docking vehicles. In the space background , a single moon at sunrise lights up several small spaceships flying by , some docking and some already docked.The scene is rendered with hyperrealistic detail , emphasizing the immense scale of the space industries. oil gouache melting , acrylic , high contrast , colorful polychromatic , ultra detailed , ultra quality , CGSociety ,
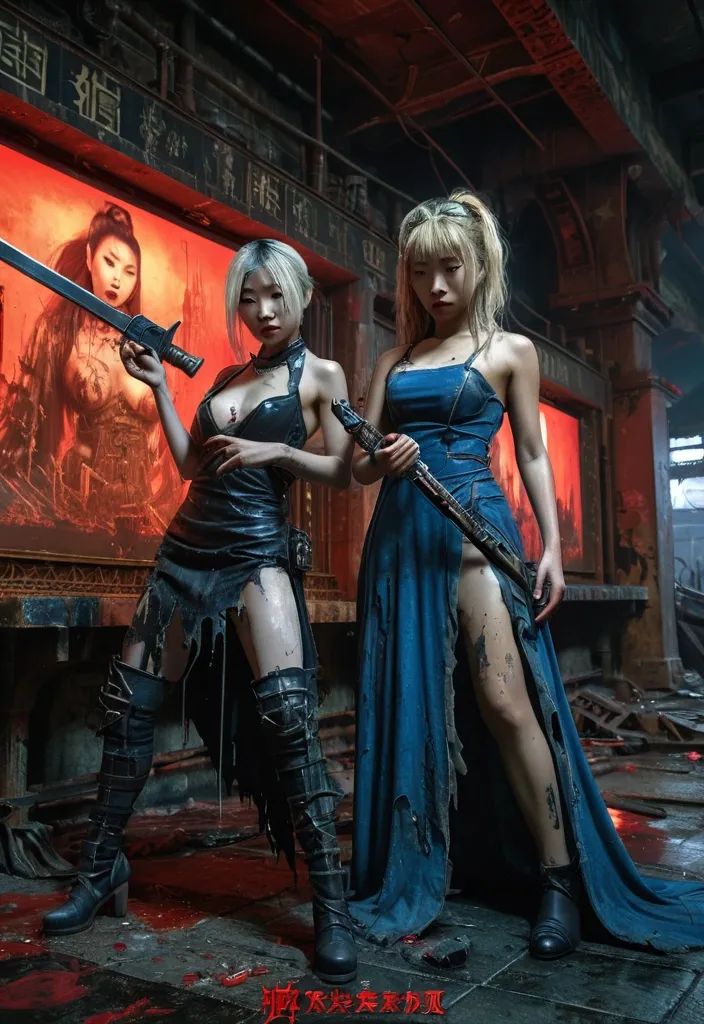
Post-apocalyptic abandoned metro station , dreamlike and mysterious , insanely detailed and intricate scene , with antique wordless billboards. on left side Asian woman in revealing torn gown , hand pointing a chinese sword. in center Blonde woman in tattered blue form-fitting latex reloading a phaser. on right side Black woman in revealing tattered gothic dress , crouching on top of an antique wood table , snarling with her fang. Gothic chandelier up top casting red light down , illuminating their hairs. Black candles toppled on the table. , detailed matte painting , deep color , fantastical , intricate detail , splash screen , complementary colors , fantasy concept art , 8k resolution trending on Artstation Unreal Engine 5 , ,
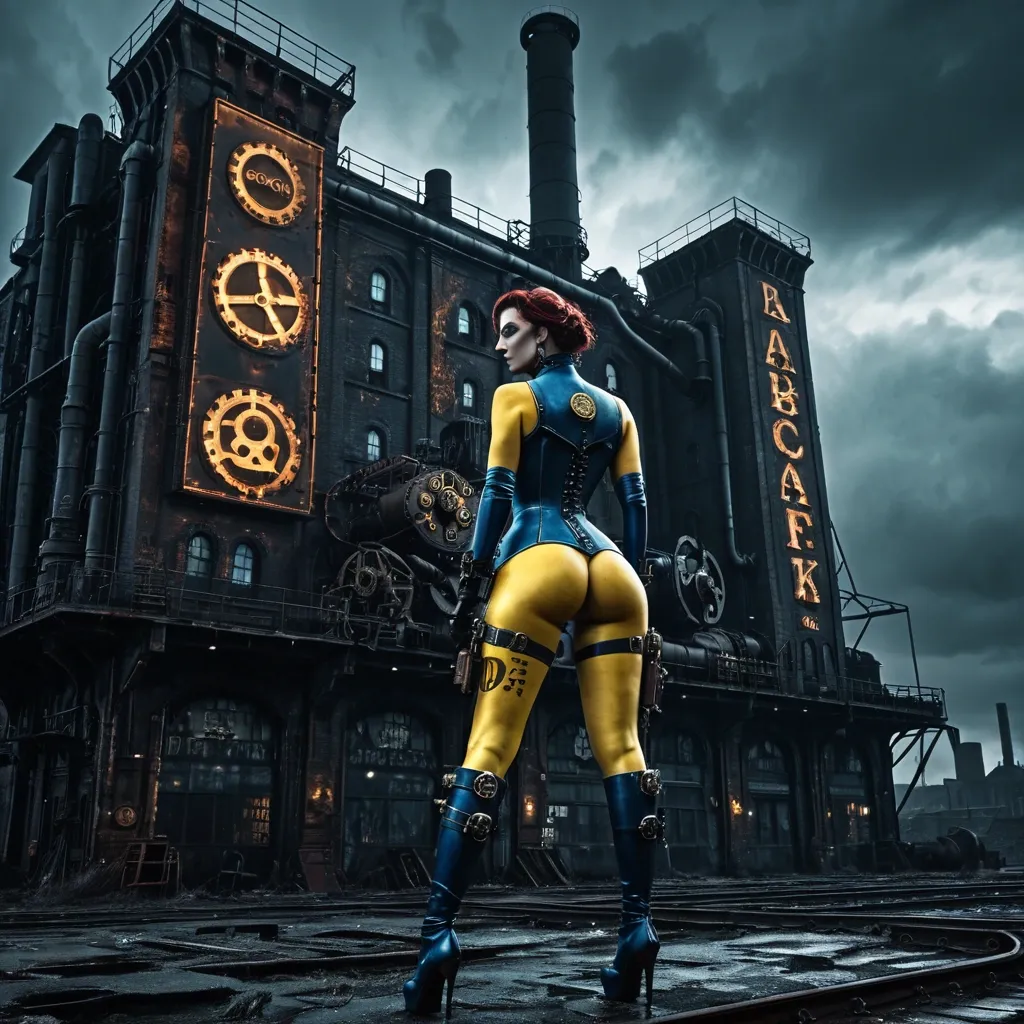
From behind view of a female wearing dirty form-fitting blue latex with dirty yellow 101 on her back , holster and hip pouches , pale strong thighs step on a steampunk gearbox , she is opening an old folded map. In the background is A colossal , derelict soviet-era factory silhouetted against a smog-filled sky , steam billowing from broken smokestacks. Intricate steampunk gears and pipes snake across the decaying facade , hinting at a forgotten industrial past. tiny electric arcs between gears , sparking redhot. Floodlight on tower shining across view and illuminating her body curves. An old billboard with gothic letter POSEIDON on the wall. The scene is rendered in a moody digital painting style with dramatic , cinematic lighting , emphasizing deep shadows and a limited , desaturated color palette. , steampunk engine , steampunk engine ,
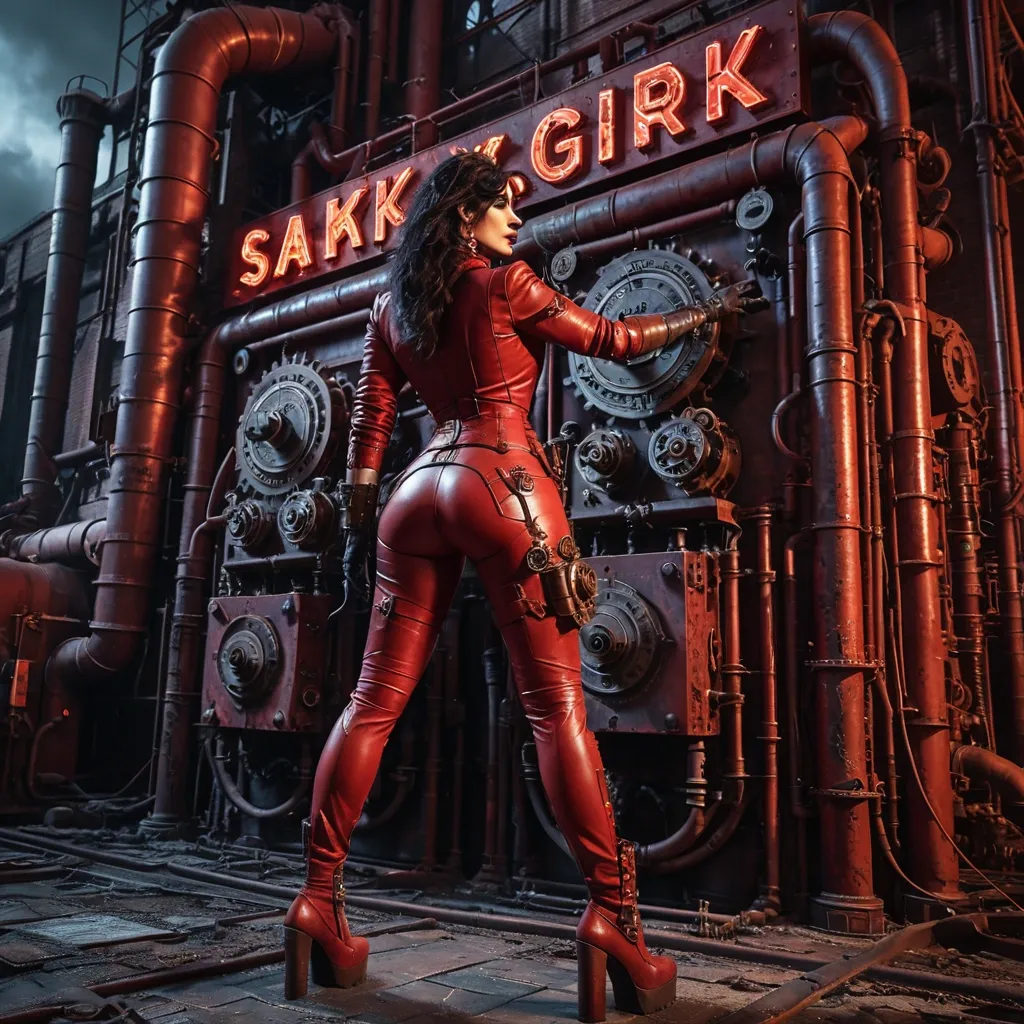
From behind view of a female wearing dirty form-fitting red leather suit , holster and hip pouches , pale strong thighs in form-fitting long leather pant step on a steampunk gearbox. She is opening an old console under an old signboard with age-worn dirty letters "PITT" on the wall. In the background is A colossal , derelict soviet-era factory silhouetted against a red-smog-filled sky , red steam billowing from broken smokestacks. Intricate steampunk gears and pipes snake across the decaying facade , hinting at a forgotten industrial past. tiny electric arcs between gears , sparking redhot. Floodlight on tower shining reddish across view and illuminating her body curves. . The scene is rendered in a moody digital painting style with dramatic , cinematic lighting , emphasizing deep shadows and a limited , desaturated color palette. , , steampunk engine ,
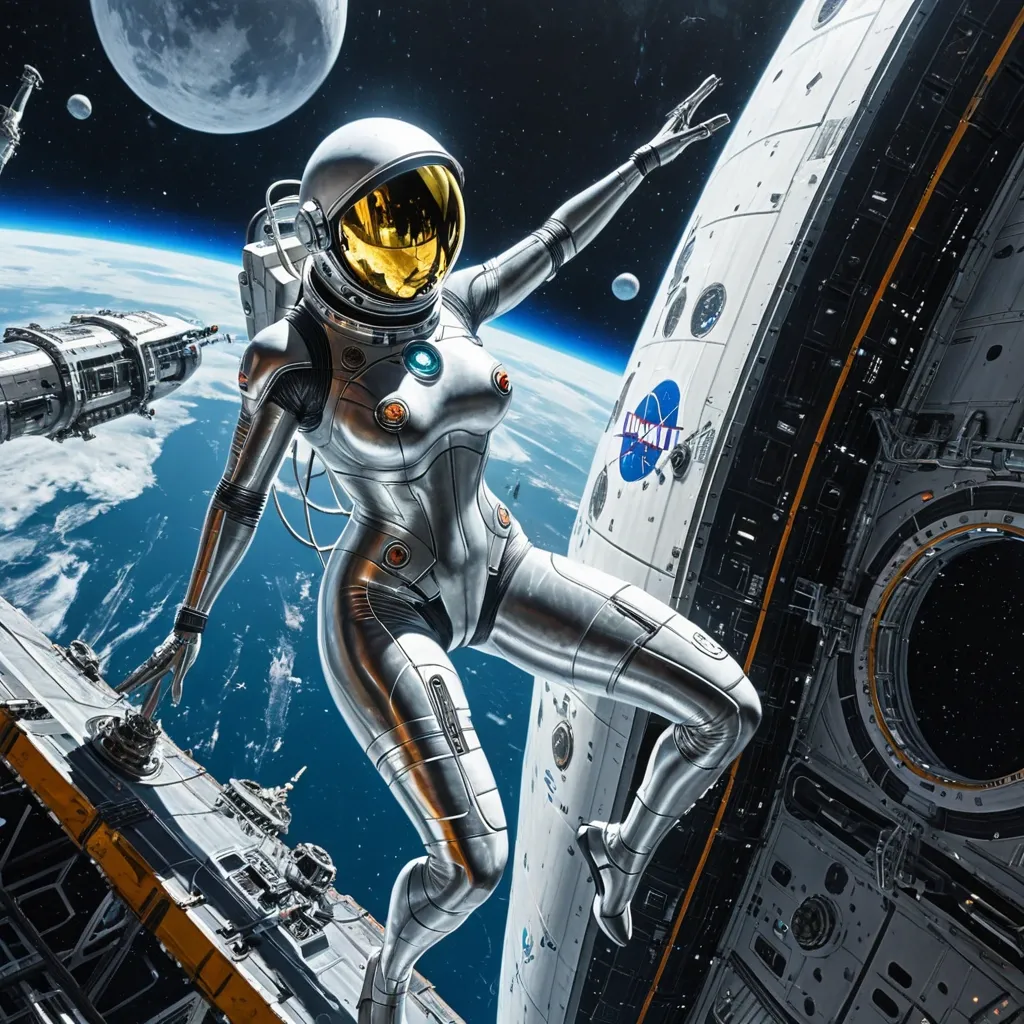
A lone female astronaut in a sleek , reflective , form-fitting latex suit drifts through the vacuum of space , her helmet visor reflecting a busy space dock. her pale strong thighs step on a futuristic surfer board firing up. The background is an angled view looking outside the outer ring of a huge space station with an outer ring; the outer ring has many docking ports with attached umbilical-beanstalk links to docked/docking vehicles. In the space background , a single moon at sunrise lights up several small spaceships flying by , some docking and some already docked.The scene is rendered with hyperrealistic detail , emphasizing the immense scale of the space industries. , graffiti art , splash art , street art , spray paint , oil gouache melting , acrylic , high contrast , colorful polychromatic , ultra detailed , ultra quality , CGSociety ,
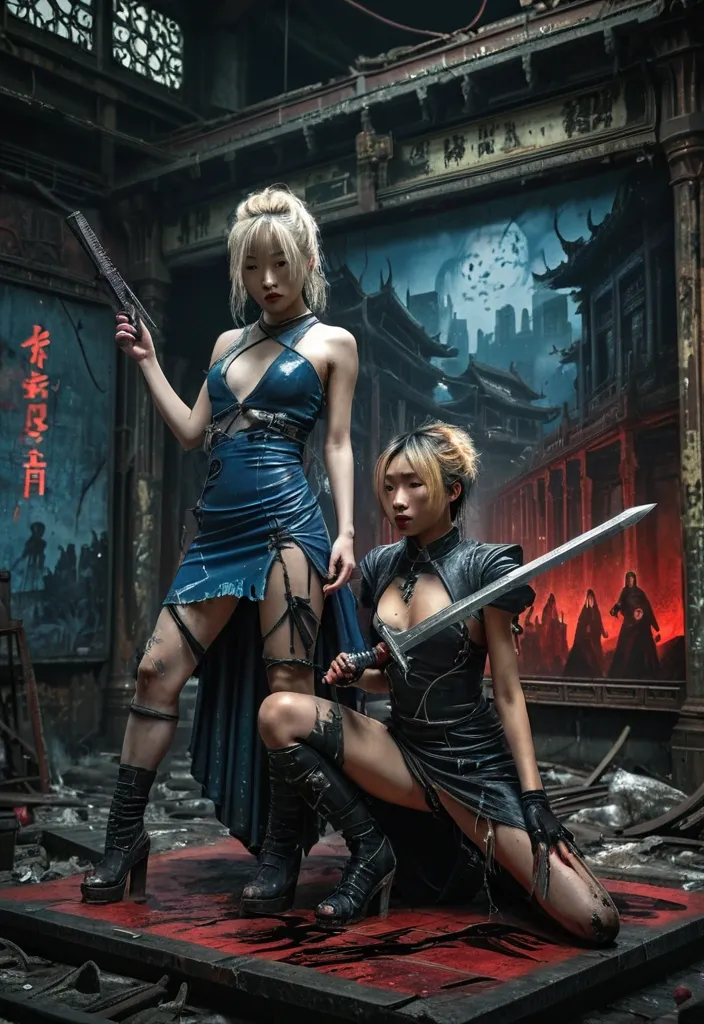
Post-apocalyptic abandoned metro station , dreamlike and mysterious , insanely detailed and intricate scene , with antique wordless billboards. on left side Asian woman in revealing torn gown , hand pointing a chinese sword. in center Blonde woman in tattered blue form-fitting latex reloading a phaser. on right side Black woman in revealing tattered gothic dress , crouching on top of an antique wood table , snarling with her fang. Gothic chandelier up top casting red light down , illuminating their hairs. Black candles toppled on the table. , detailed matte painting , deep color , fantastical , intricate detail , splash screen , complementary colors , fantasy concept art , 8k resolution trending on Artstation Unreal Engine 5 ,
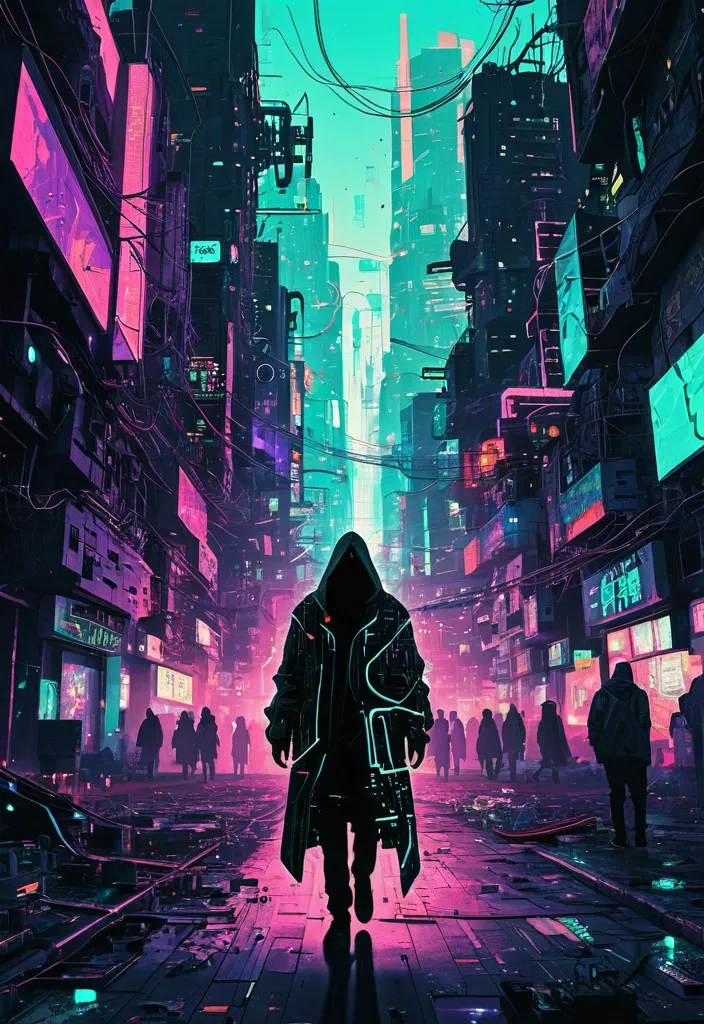
A vibrant , chaotic cityscape where buildings are constructed from discarded electronics and glowing circuit boards , pulsating with erratic energy. A lone figure , cloaked and silhouetted , walks through the glitching streets. The aesthetic is pure circuit-bent maximalism , with elements of cyberpunk and a raw , digital art sensibility. ,
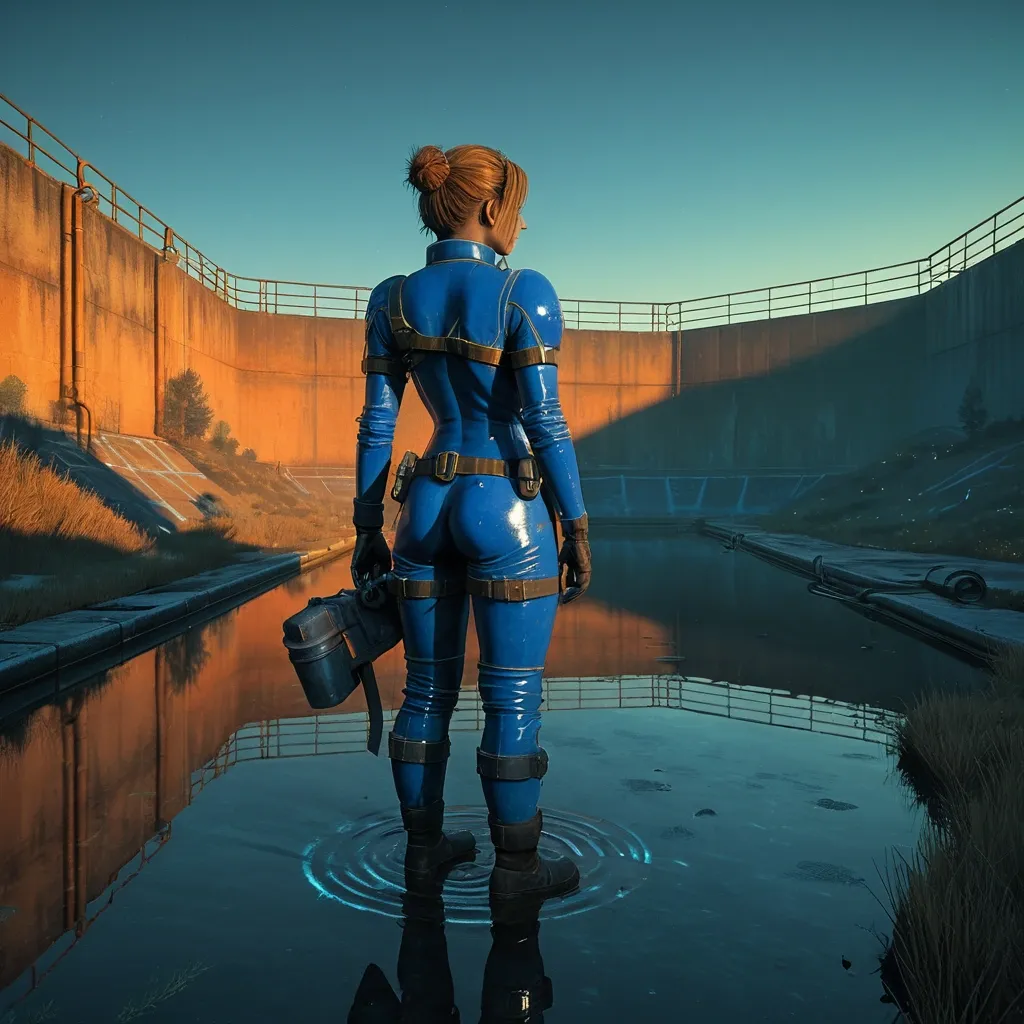
From behind A Fallout female Vault dweller , adorned in a latex , blue utility suit with scuff marks and utility pouches , stands at the edge of a vast , water reservoir , holding clipboard , pale strong thighs stand on water puddle. Luminescent , otherworldly flora cling to the reservoir walls , casting an ethereal blue and green glow. The distant light sconces casting orange light create long , dramatic shadows. Giant water pipes lines the edge of the water reservoir. Rendered in a highly detailed concept art style with photorealistic textures and post-processing effects , emphasizing a sense of awe and the unknown. ,
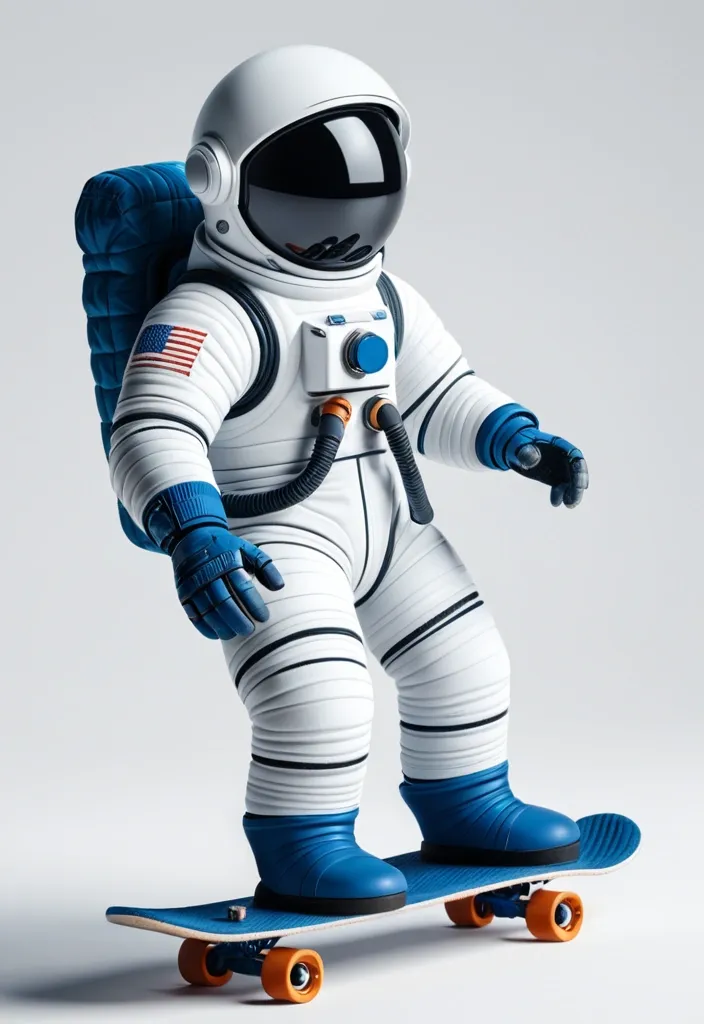
Photo of a pair of boys' mid-calf socks isolated on a white background. The main color of the sock is #91ACD7 (soft blue-gray) , the color of the toe and heel is #243161 (dark blue) , the color of the cuff (ribbed upper edge): #91ACD7 , which matches the color of the main part. On the outside of the shaft is a detailed image of a cartoon astronaut in a white spacesuit performing a trick on a skateboard. The astronaut is dynamic , in motion , the skateboard is tilted. High quality , soft fabric texture , uniform lighting , no shadows on the background , e-commerce style , realistic product photography , 4K. ,
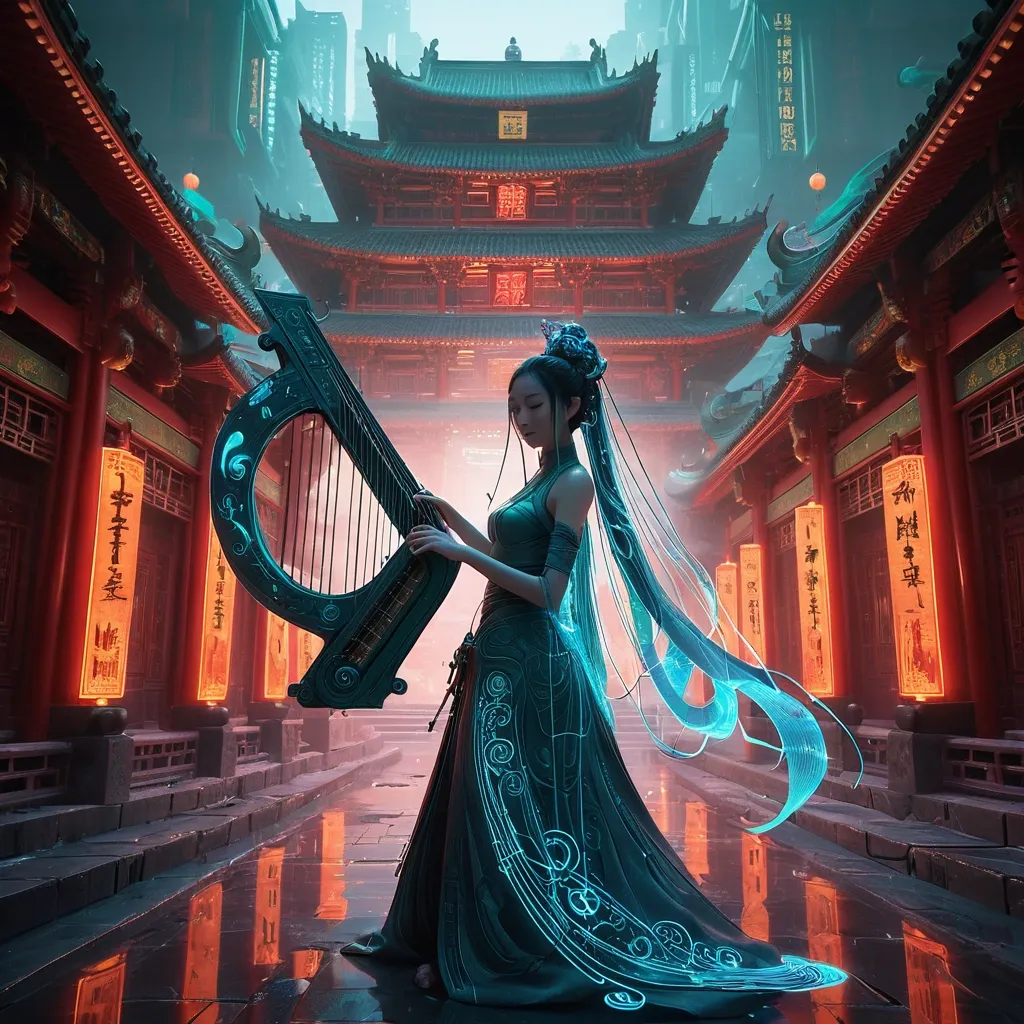
Envision a captivating digital art piece that blends the traditional with the futuristic , set in a vibrant , neon-lit street of an old Chinese village. The focal point is a beautiful woman with flowing nlue veils and a orange lily in her hair , playing an extraordinary Cli Lyre. This lyre is crafted from circuit paths and motherboard textures , adorned with glowing LED elements in crimson green and metallic white hues. She is positioned in front of a stunning , multi-story red Chinese traditional temple , the architecture of which seems to blend seamlessly with the futuristic elements of the lyre. The scene is alive with dynamic movement: binary code floats around her , and there's a sense of sparkling gray waves and smoke. The lighting is dramatic , with a backlight that highlights the silhouette of the woman and the intricate details of the temple. The artwork should convey a sense of wonder , rendered in Octane for a 4K , high-detail masterpiece with a surreal , abstract quality. ,
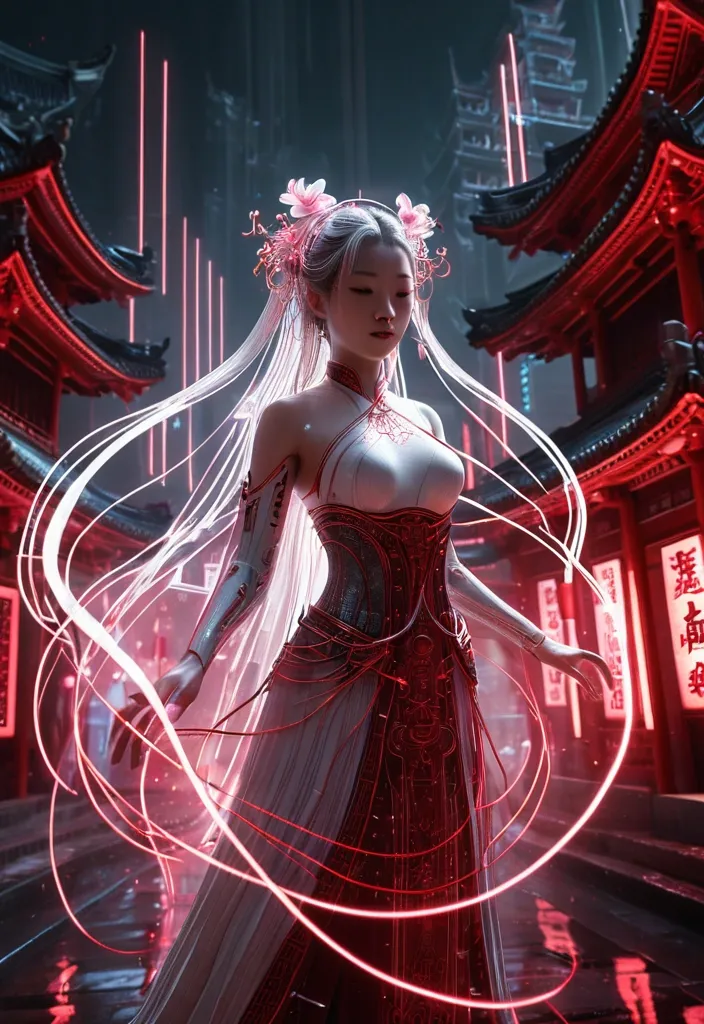
Digital female flowing white veils with a pink lily in her hair , playing the antique Cli Lyre composed of circuit paths , motherboard texture with glowing LED elements , color scheme of crimson red and metallic black , floating binary code. Style: Celestial , ethereal , abstract , digital art black Lighting: Dramatic backlighting , set in a bustling , neon-lit urban environment , likely a street in old Chinese village. Behind her is a large multi-story red Chinese traditional temple. Composition: dynamic diagonal , composition , upward gaze Details: Sparkling gray waves and smoke , streaking white light trails , sense of movement and wonder , magical atmosphere Quality: High detail , 4K , Masterpiece , Rendered in Octane. ,
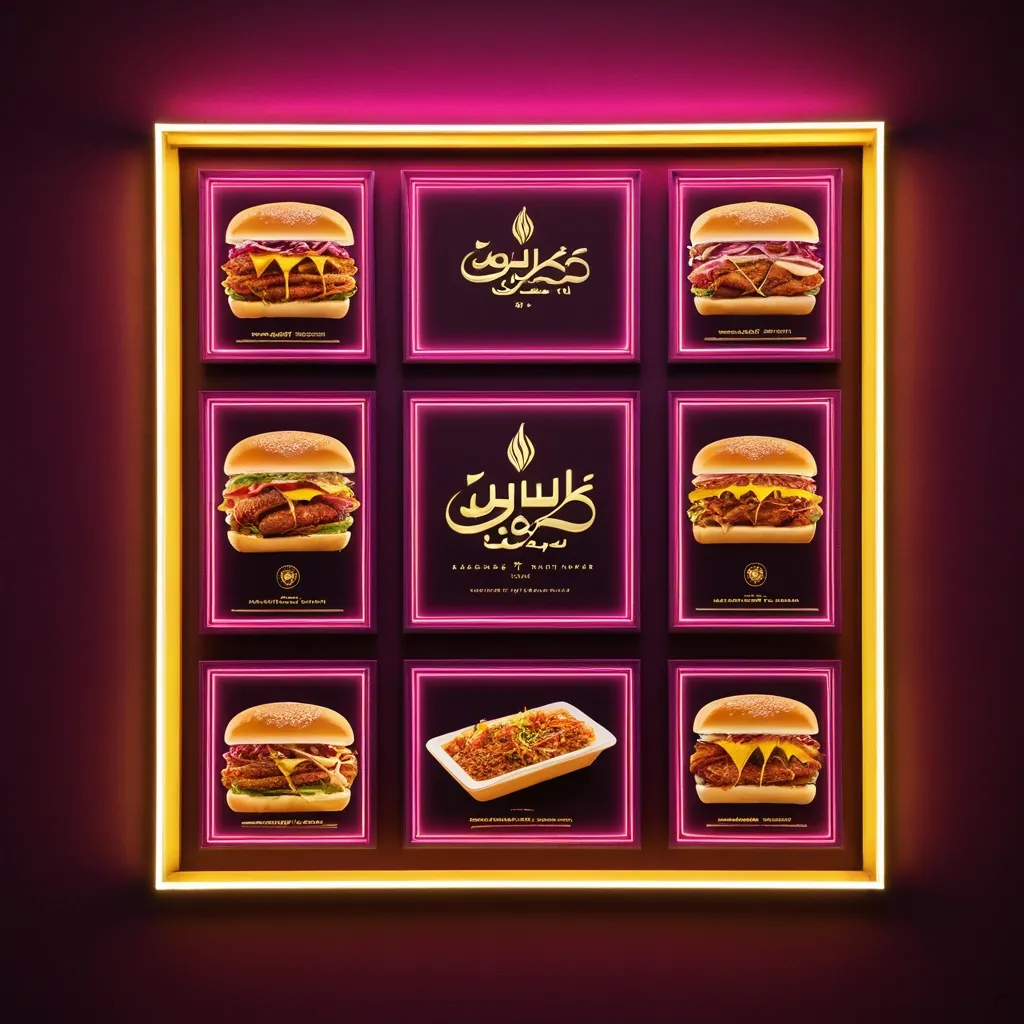
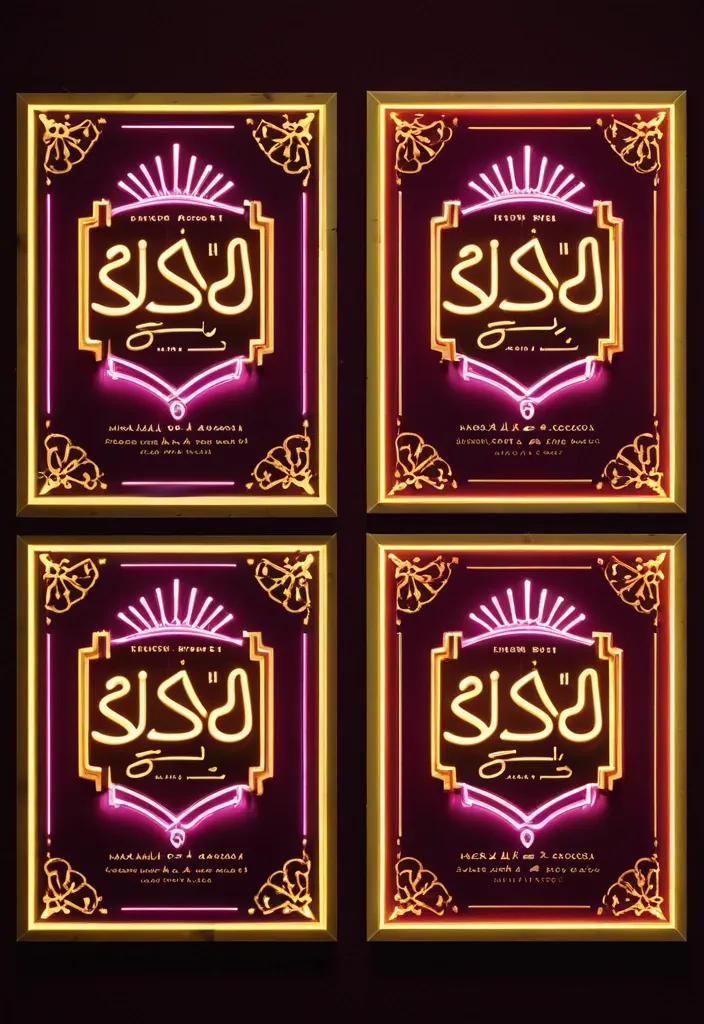
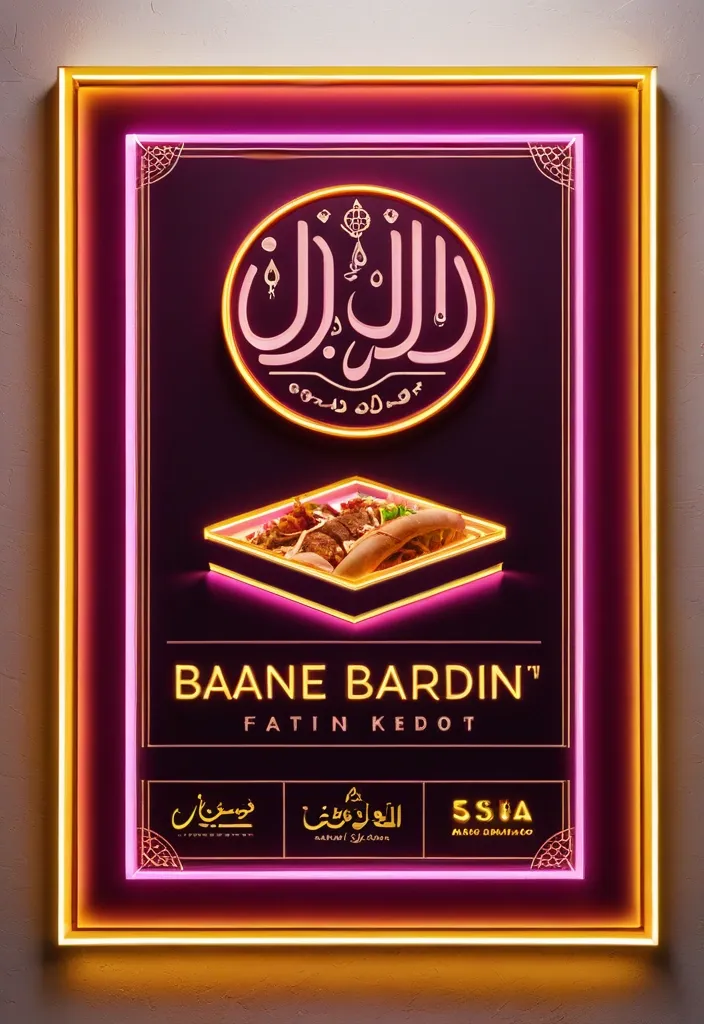
**Subject:** A horizontal commercial signboard for an sudanes restaurant specializing in fast food **Composition & Layout:** * **Format:** A wide , horizontal rectangular banner set within a thin , glowing warm-yellow frame. * **Central Focus:** Large , prominent Arabic text dominates the center. * **Top Left:** A logo place leave it empty * **Bottom Section:** Smaller lines of informative text and four square photographic panels showing food. * **Lighting Effects:** The overall aesthetic is a high-contrast , glowing "light-box" style. Pinkish-magenta light streaks radiate upward from the bottom corners toward the center. **Color Palette:** * **Background:** Deep royal red ff2325 with subtle textures and faint , light-white decorative flourishes (filigree patterns). * **Main Typography:** Bright orange letters with a thick , 3D-effect gold/yellow outline and a dark drop shadow for depth. * **Secondary Typography:** Pure white for the address and bright yellow for the contact numbers. * **Accents:** Magenta/pink light flares and a warm yellow glow from the outer frame. **Specific Elements:** * **Main Title (Arabic):** Bold , stylized Arabic calligraphy reading "كوبا للفطائر". * **Logo:** The logo for Cuba pies Restaurant will be sent with the promo. * **Address Line (Middle):** A single line of white Arabic text: "الاسكان 96-شارع السوق-الفاصل 96_95" * **Contact Line (Bottom):** Yellow text containing two phone numbers "0923931452/ 0928737341" preceded by the Arabic word for "Contact:". * **Food Imagery:** Four small square panels at the bottom (two on the left , two on the right). They feature realistic photos of Shawarma sandwich on plates with garnishes and one panel showing a whole , golden-brown roasted chicken. **Style:** Modern Egyptian commercial design , vibrant , professional , and designed to look like an illuminated neon or LED sign at night. ,
**Subject:** A horizontal commercial signboard for an sudanes restaurant specializing in fast food **Composition & Layout:** * **Format:** A wide , horizontal rectangular banner set within a thin , glowing warm-yellow frame. * **Central Focus:** Large , prominent Arabic text dominates the center. * **Top Left:** A logo place leave it empty * **Bottom Section:** Smaller lines of informative text and four square photographic panels showing food. * **Lighting Effects:** The overall aesthetic is a high-contrast , glowing "light-box" style. Pinkish-magenta light streaks radiate upward from the bottom corners toward the center. **Color Palette:** * **Background:** Deep royal red ff2325 with subtle textures and faint , light-white decorative flourishes (filigree patterns). * **Main Typography:** Bright orange letters with a thick , 3D-effect gold/yellow outline and a dark drop shadow for depth. * **Secondary Typography:** Pure white for the address and bright yellow for the contact numbers. * **Accents:** Magenta/pink light flares and a warm yellow glow from the outer frame. **Specific Elements:** * **Main Title (Arabic):** Bold , stylized Arabic calligraphy reading "كوبا للفطائر". * **Logo:** The logo for Cuba pies Restaurant will be sent with the promo. * **Address Line (Middle):** A single line of white Arabic text: "الاسكان 96-شارع السوق-الفاصل 96_95" * **Contact Line (Bottom):** Yellow text containing two phone numbers "0923931452/ 0928737341" preceded by the Arabic word for "Contact:". * **Food Imagery:** Four small square panels at the bottom (two on the left , two on the right). They feature realistic photos of Shawarma sandwich on plates with garnishes and one panel showing a whole , golden-brown roasted chicken. **Style:** Modern Egyptian commercial design , vibrant , professional , and designed to look like an illuminated neon or LED sign at night. ,
**Subject:** A horizontal commercial signboard for an sudanes restaurant specializing in fast food **Composition & Layout:** * **Format:** A wide , horizontal rectangular banner set within a thin , glowing warm-yellow frame. * **Central Focus:** Large , prominent Arabic text dominates the center. * **Top Left:** A logo place leave it empty * **Bottom Section:** Smaller lines of informative text and four square photographic panels showing food. * **Lighting Effects:** The overall aesthetic is a high-contrast , glowing "light-box" style. Pinkish-magenta light streaks radiate upward from the bottom corners toward the center. **Color Palette:** * **Background:** Deep royal red ff2325 with subtle textures and faint , light-white decorative flourishes (filigree patterns). * **Main Typography:** Bright orange letters with a thick , 3D-effect gold/yellow outline and a dark drop shadow for depth. * **Secondary Typography:** Pure white for the address and bright yellow for the contact numbers. * **Accents:** Magenta/pink light flares and a warm yellow glow from the outer frame. **Specific Elements:** * **Main Title (Arabic):** Bold , stylized Arabic calligraphy reading "كوبا للفطائر". * **Logo:** The logo for Cuba pies Restaurant will be sent with the promo. * **Address Line (Middle):** A single line of white Arabic text: "الاسكان 96-شارع السوق-الفاصل 96_95" * **Contact Line (Bottom):** Yellow text containing two phone numbers "0923931452/ 0928737341" preceded by the Arabic word for "Contact:". * **Food Imagery:** Four small square panels at the bottom (two on the left , two on the right). They feature realistic photos of Shawarma sandwich on plates with garnishes and one panel showing a whole , golden-brown roasted chicken. **Style:** Modern Egyptian commercial design , vibrant , professional , and designed to look like an illuminated neon or LED sign at night. ,
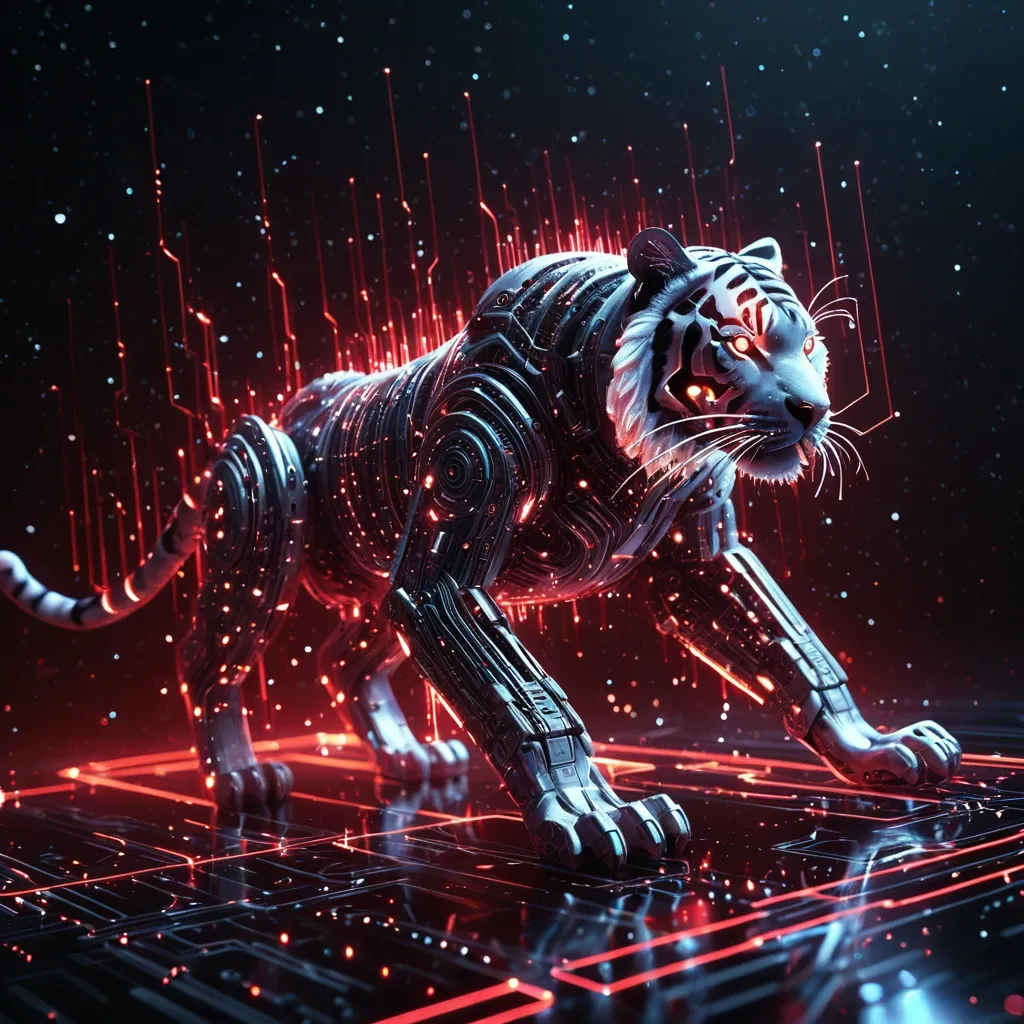
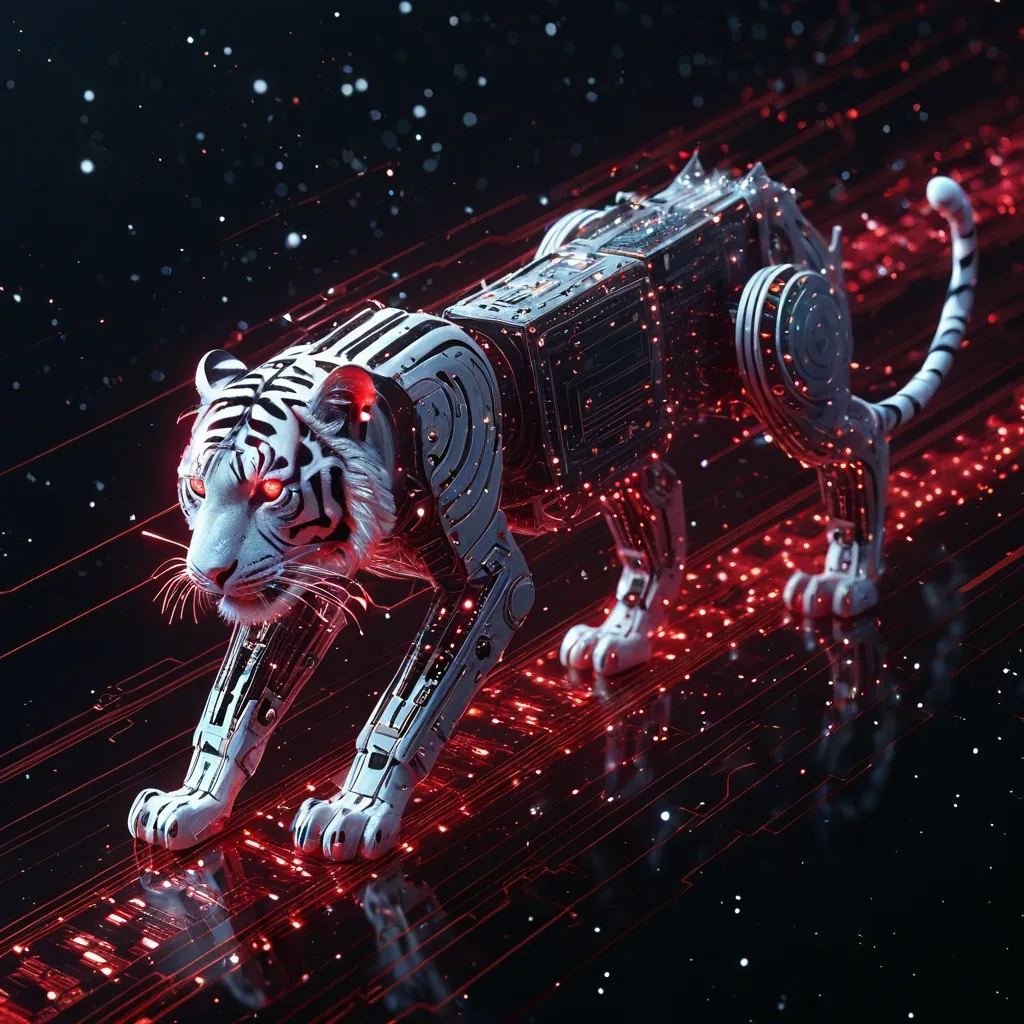
A tiger spacecraft composed of circuit paths , motherboard texture with glowing LED elements , silver traces forming a legs , quantum processor eyes , color scheme of crimson red and metallic black , floating binary code. Style: Celestial , ethereal , abstract , digital art black Lighting: Dramatic backlighting , bright glowing particles , contrasting dark background Composition: dynamic diagonal , composition , upward gaze Details: Sparkling dots waves and smoke , streaking white light trails , sense of movement and wonder , magical atmosphere Quality: High detail , 4K , Masterpiece , Rendered in Octane , ray traced rendering --ar 4:5 --raw --v 8 ,
A tiger spacecraft composed of circuit paths , motherboard texture with glowing LED elements , silver traces forming a legs , quantum processor eyes , color scheme of crimson red and metallic black , floating binary code. Style: Celestial , ethereal , abstract , digital art black Lighting: Dramatic backlighting , bright glowing particles , contrasting dark background Composition: dynamic diagonal , composition , upward gaze Details: Sparkling dots waves and smoke , streaking white light trails , sense of movement and wonder , magical atmosphere Quality: High detail , 4K , Masterpiece , Rendered in Octane , ray traced rendering --ar 4:5 --raw --v 8 ,
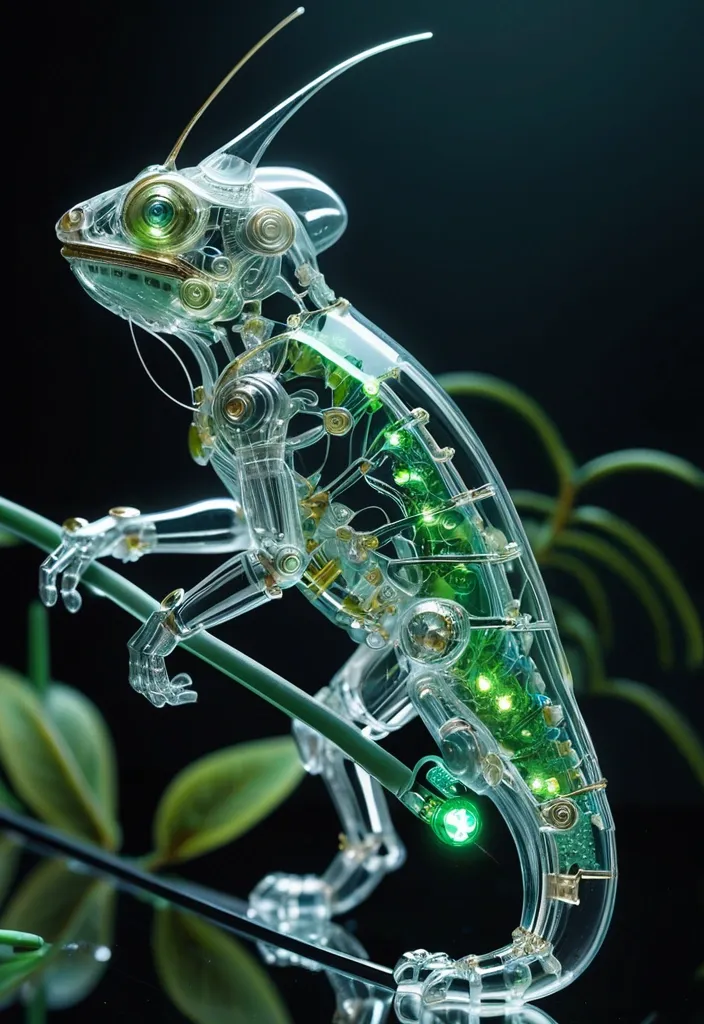
Create a hyperrealistic macro photograph of a transparent cybernetic chameleon perched on a flowering branch , its body positioned diagonally across the frame from upper left to lower right. Its exoskeleton is sculpted from clear , glass-like polymers , revealing a mesmerizing inner world of green glowing micro-LEDs , nano-scale circuit boards , and ultra-fine mechanical filaments. Intricate gold , silver , and chrome-plated components are embedded throughout its body , reflecting ambient light with refined metallic sheen. Employ stylish soft cinematography lighting to emphasize internal glows , crystalline reflections , and elegant light refractions. The composition should showcase clean lines and precision-engineered aesthetics-strictly high-tech , with no organic textures. A minimal city garden background paired with a shallow depth of field enhances the sense of scale , while delicate bokeh adds atmosphere and draws focus to the shimmering , futuristic anatomy. ,
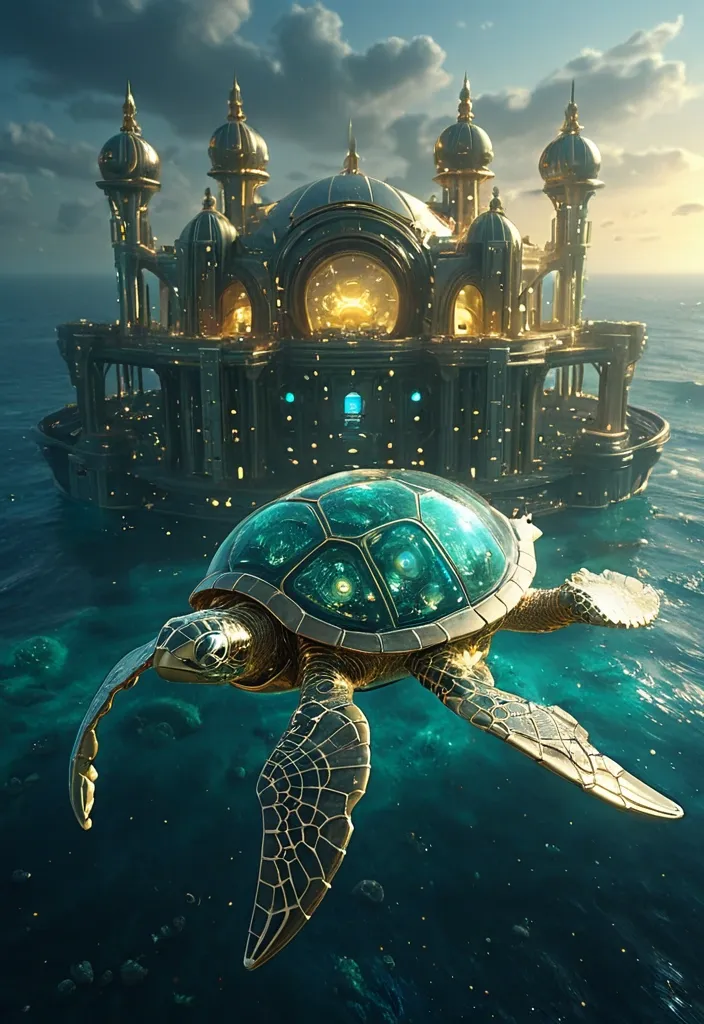
Cinematic aerial view over a futuristic oceanic metropolis. A colossal bio-mechanical sea turtle , its form a fusion of glass-like polymers curves and motherboard texture with CCTVs camera plating , glides through a nebula of swirling stardust and gas clouds. Intricate gold , silver , and chrome-plated components are embedded throughout its body , pulsing with glowing marine life. The scene is rendered with hyper-realistic detail , emphasizing the vastness of ocean and the majestic , ocean nature of the creature. Late afternoon light. Golden reflections on the facades. Humid atmosphere , light saline mist. Distant seagulls. Gentle waves lapping against the structures. 70mm optics. Realistic depth of field. Photorealistic live-action rendering. Credible physical textures. No UI elements. No game graphics. Organic and functional futuristic architecture A sea turtle immersed in a Luminescent Oceanic Reverie , where the sea comes alive with glowing marine life. Use vibrant shades of gold and teal to capture the ethereal beauty of underwater illumination. ,
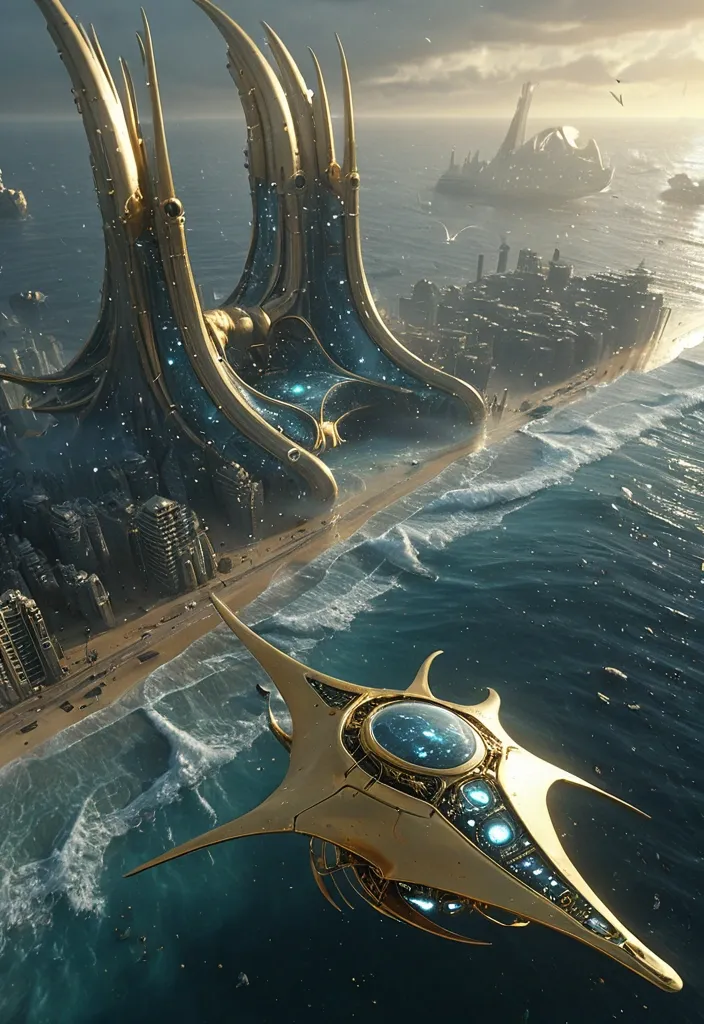
Cinematic aerial view over a futuristic oceanic metropolis. A colossal bio-mechanical manta-ray , its form a fusion of glass-like polymers curves and motherboard texture with CCTVs camera plating , glides through a nebula of swirling stardust and gas clouds. Intricate gold , silver , and chrome-plated components are embedded throughout its body , pulsing with soft , internal light. The scene is rendered with hyper-realistic detail , emphasizing the vastness of ocean and the majestic , ocean nature of the creature. Late afternoon light. Golden reflections on the facades. Humid atmosphere , light saline mist. Distant seagulls. Gentle waves lapping against the structures. 70mm optics. Realistic depth of field. Photorealistic live-action rendering. Credible physical textures. No UI elements. No game graphics. Organic and functional futuristic architecture ,