Search Results for Data
Explore AI generated designs, images, art and prompts by top community artists and designers.

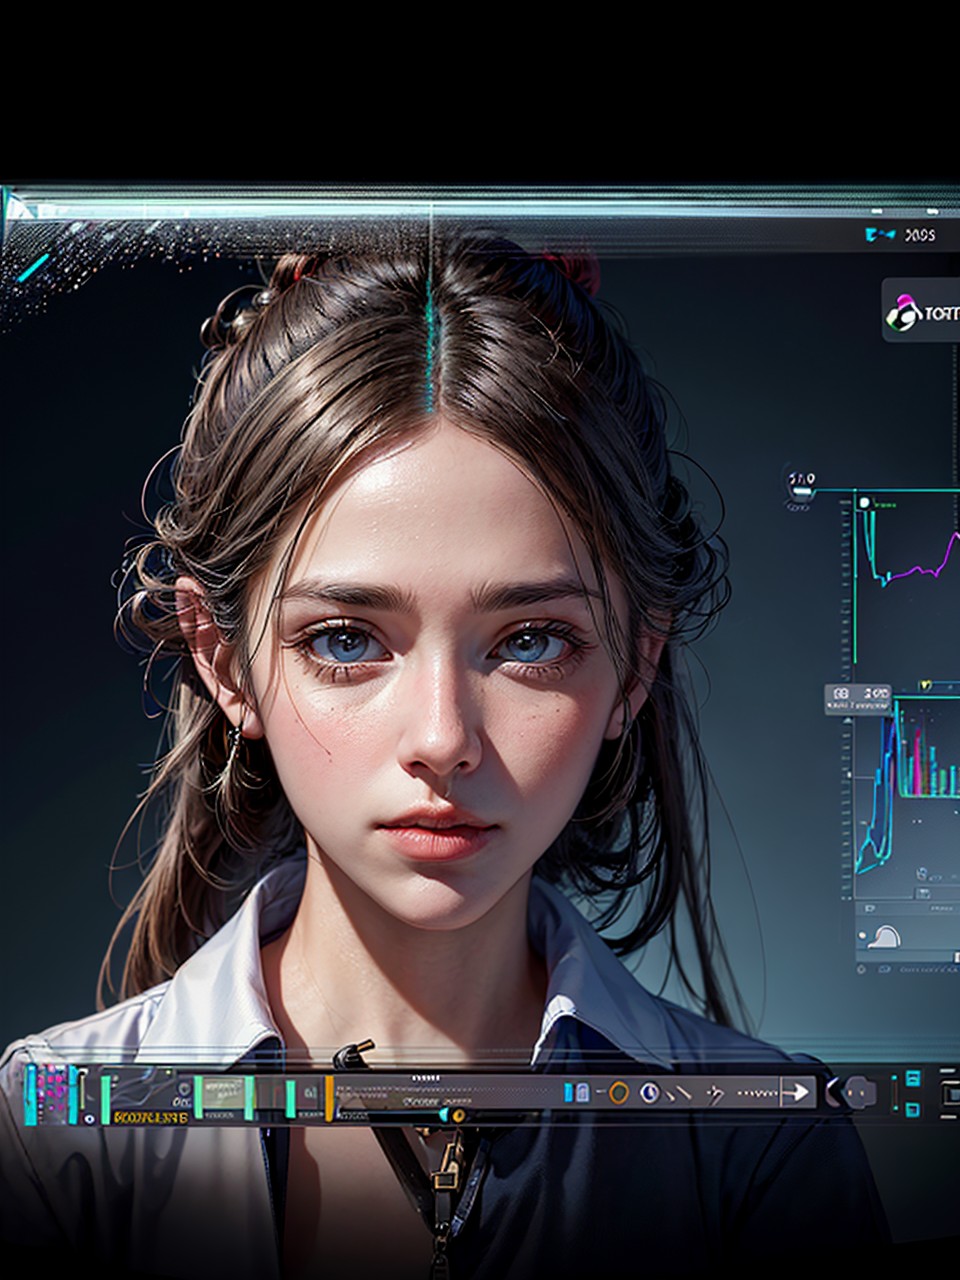
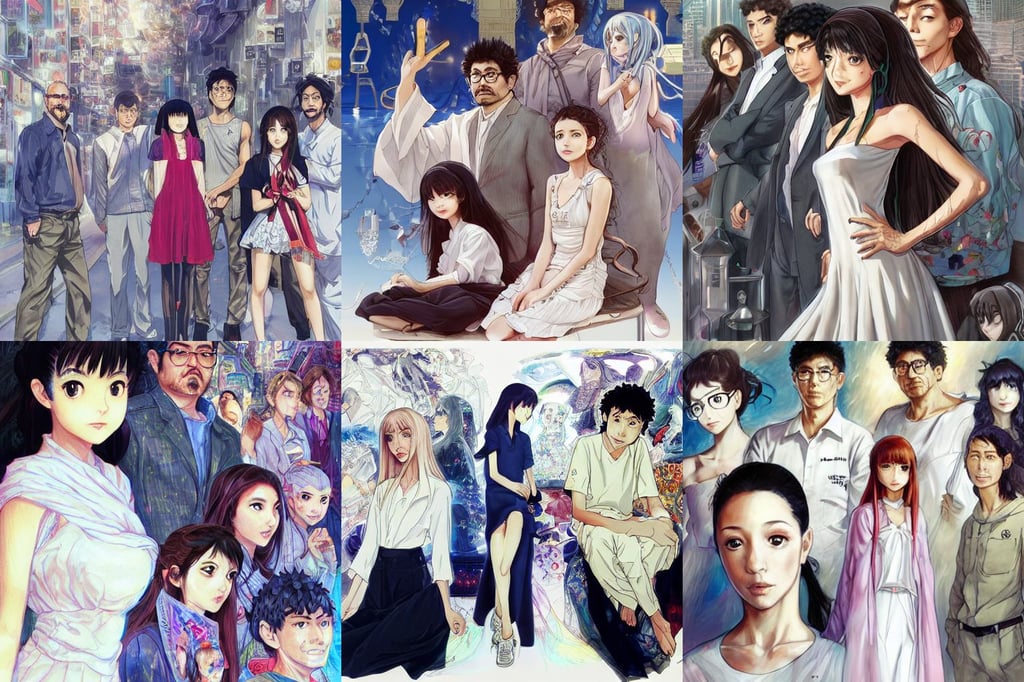
A photorealistic portrait of a ((determined|resilient|innovative)) ((scientist|researcher|inventor)) working on a transparent data visualization infographic , with a high-resolution OLED GUI interface display and annotations. The image is framed within a display case , showcasing the intricate technical drawing of a groundbreaking invention. ,
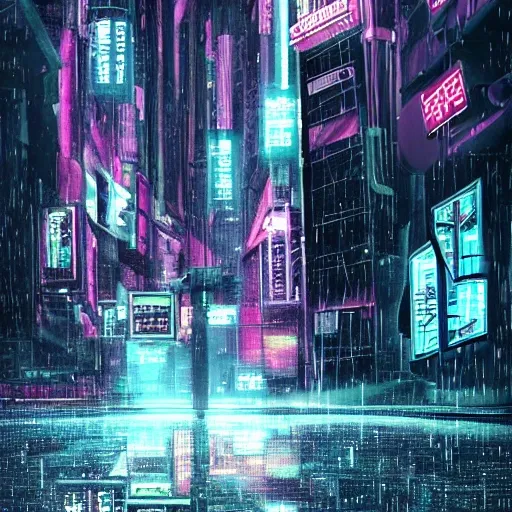
Cityscape: Depict a sprawling cityscape dominated by towering skyscrapers , elevated highways , and labyrinthine alleyways. The architecture should reflect a fusion of futuristic designs , incorporating sleek lines , geometric shapes , and glass facades. Pay attention to the scale and density of buildings to emphasize the city's vastness. Neon Lights: Infuse the city with vibrant and luminous neon lights that cast an otherworldly glow upon the streets. Incorporate a variety of neon colors such as electric blues , intense purples , and vibrant pinks to create a mesmerizing and immersive atmosphere. Rain and Reflections: Integrate rainfall into your composition to add an element of dynamism and to enhance the cyberpunk aesthetic. Show raindrops cascading down glass surfaces , creating rivulets and puddles that reflect the neon lights and cityscape. These reflections should add depth and visual interest to your artwork. Characters: Include one or more characters that embody the spirit of the cyberpunk genre. They can be enigmatic hackers , fearless mercenaries , or mysterious individuals shrouded in futuristic attire. Pay attention to their poses , clothing , and facial expressions to convey a sense of resilience , determination , or rebellion. Augmented Reality: Introduce elements of augmented reality or holographic projections to showcase the city's technological advancements. This could include holographic advertisements , virtual graffiti , or futuristic interfaces hovering in the air. Use a combination of translucent and opaque elements to create depth and realism. High-Tech Gadgets: Incorporate advanced gadgets or cybernetic enhancements to highlight the futuristic nature of the setting. This could involve characters with augmented limbs , virtual reality headsets , or sleek handheld devices. Ensure these elements seamlessly integrate into the overall composition and enhance the cyberpunk atmosphere. Industrial Elements: Introduce industrial elements that hint at the city's darker underbelly. This could include smokestacks , factory silhouettes , or billowing steam , adding texture and a sense of realism to the urban environment. Dramatic Lighting: Utilize dramatic lighting techniques to create contrast and enhance the atmosphere of your artwork. Experiment with harsh light sources , deep shadows , and dynamic lighting effects to evoke a sense of mystery , danger , or intrigue. Technological Interfaces: Incorporate futuristic interfaces and displays within the cityscape or on the characters themselves. These can include holographic screens , floating data streams , or heads-up displays. Use intricate details and intricate patterns to add complexity and depth to these elements. Composition and Perspective: Craft a composition that is visually compelling and dynamic. Experiment with unusual perspectives , such as low-angle or high-angle shots , to create a sense of scale and depth. Utilize leading lines and vanishing points to guide the viewer's eye through the scene and draw them into the cyberpunk world you've created. ,

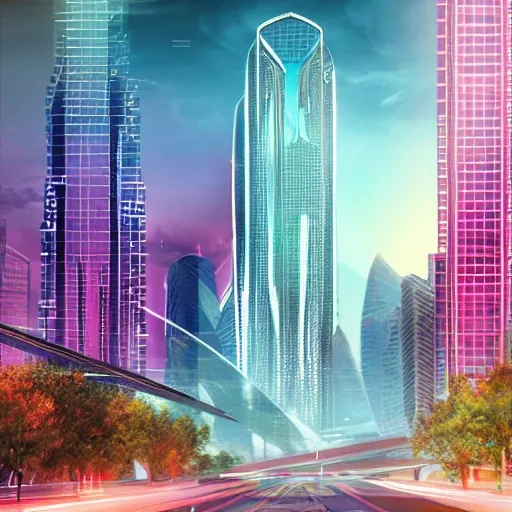
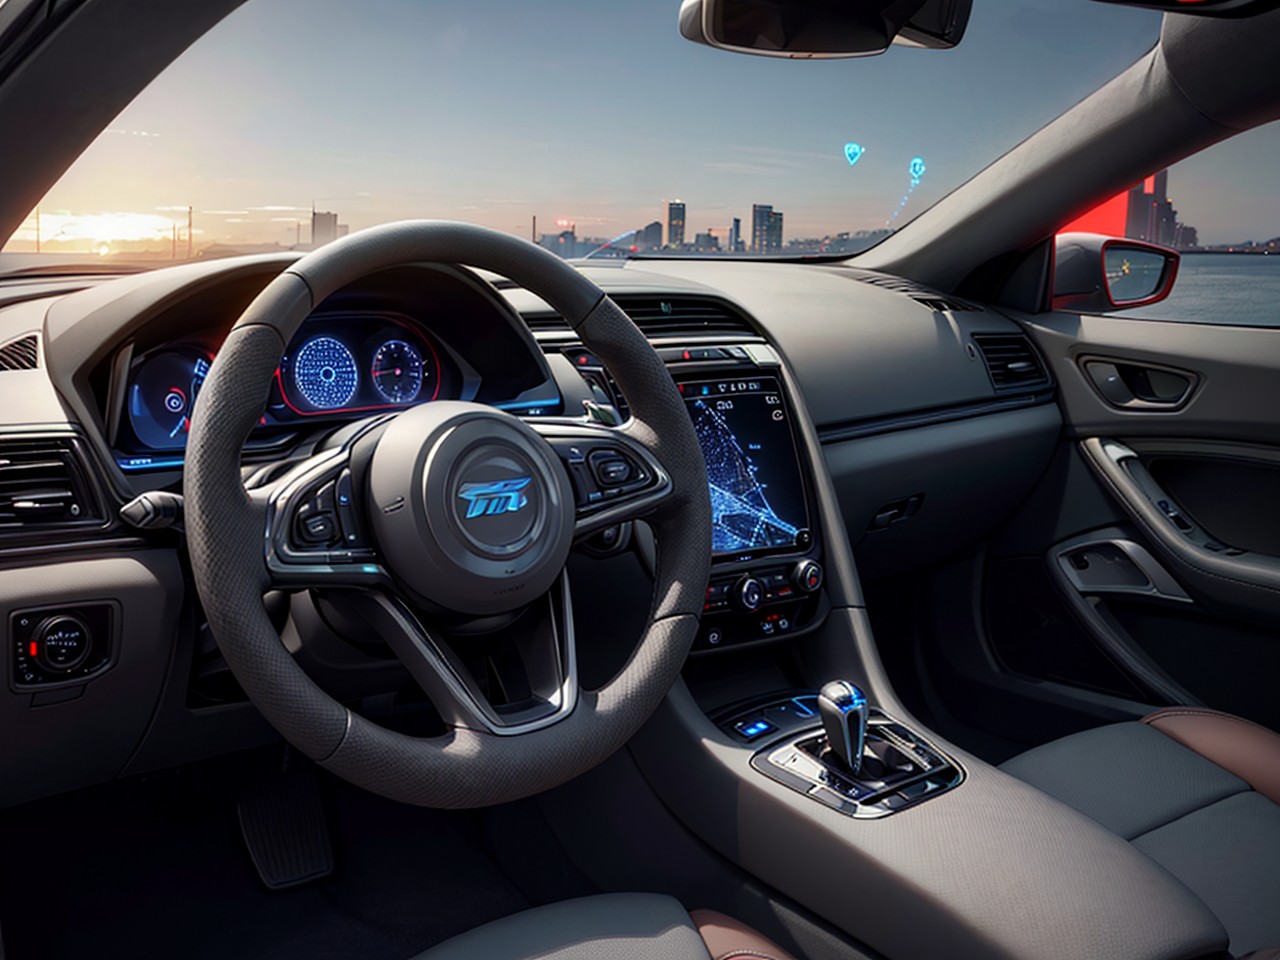
Style: Concept Art. Scene: A futuristic cityscape , with towering skyscrapers and sleek , aerodynamic vehicles speeding through the air. The high-resolution OLED GUI interface displays in the windows of the buildings are filled with transparent data visualization infographics , displaying everything from weather patterns to traffic flow. The colors are saturated and vibrant , with warm pinks and purples dominating the skyline. The overall effect is both beautiful and awe-inspiring. ,
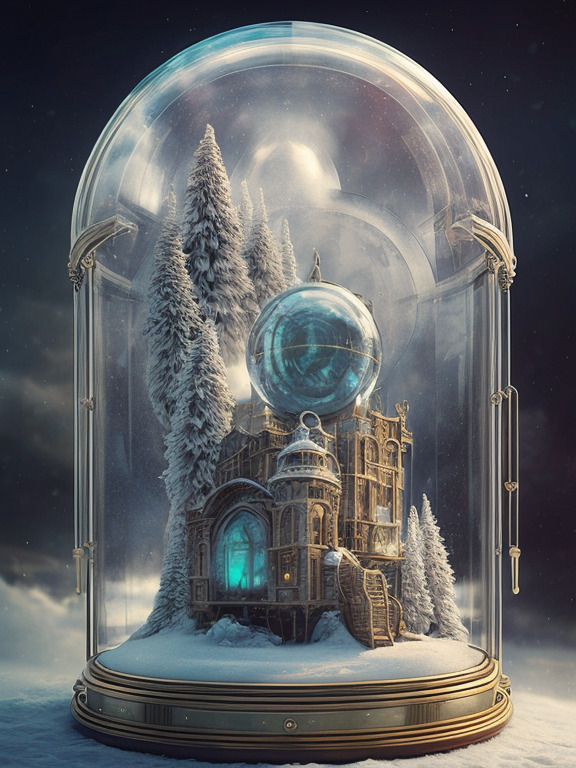
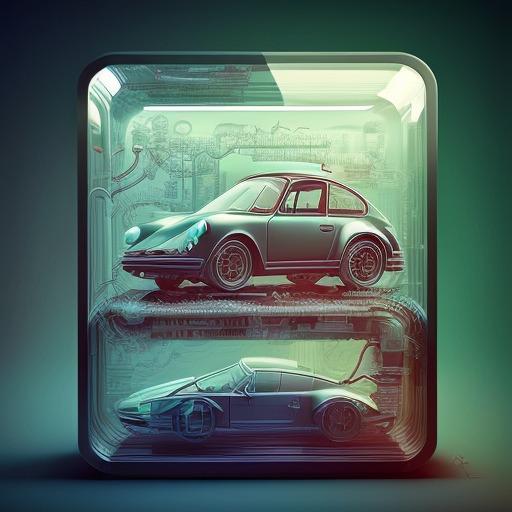
knollingcase , winter scenery of Lapland inside of snow globe , aurora borealis , transparent data visualization , trending on artstation , by Tom Bagshaw and Seb McKinnon , ultra detailed , hyper-realistic , cinematic , dramatic lighting , volumetric lighting , 150mm , octane render , photorealistic , denoise , photograph with a Hasselblad H3DII ,
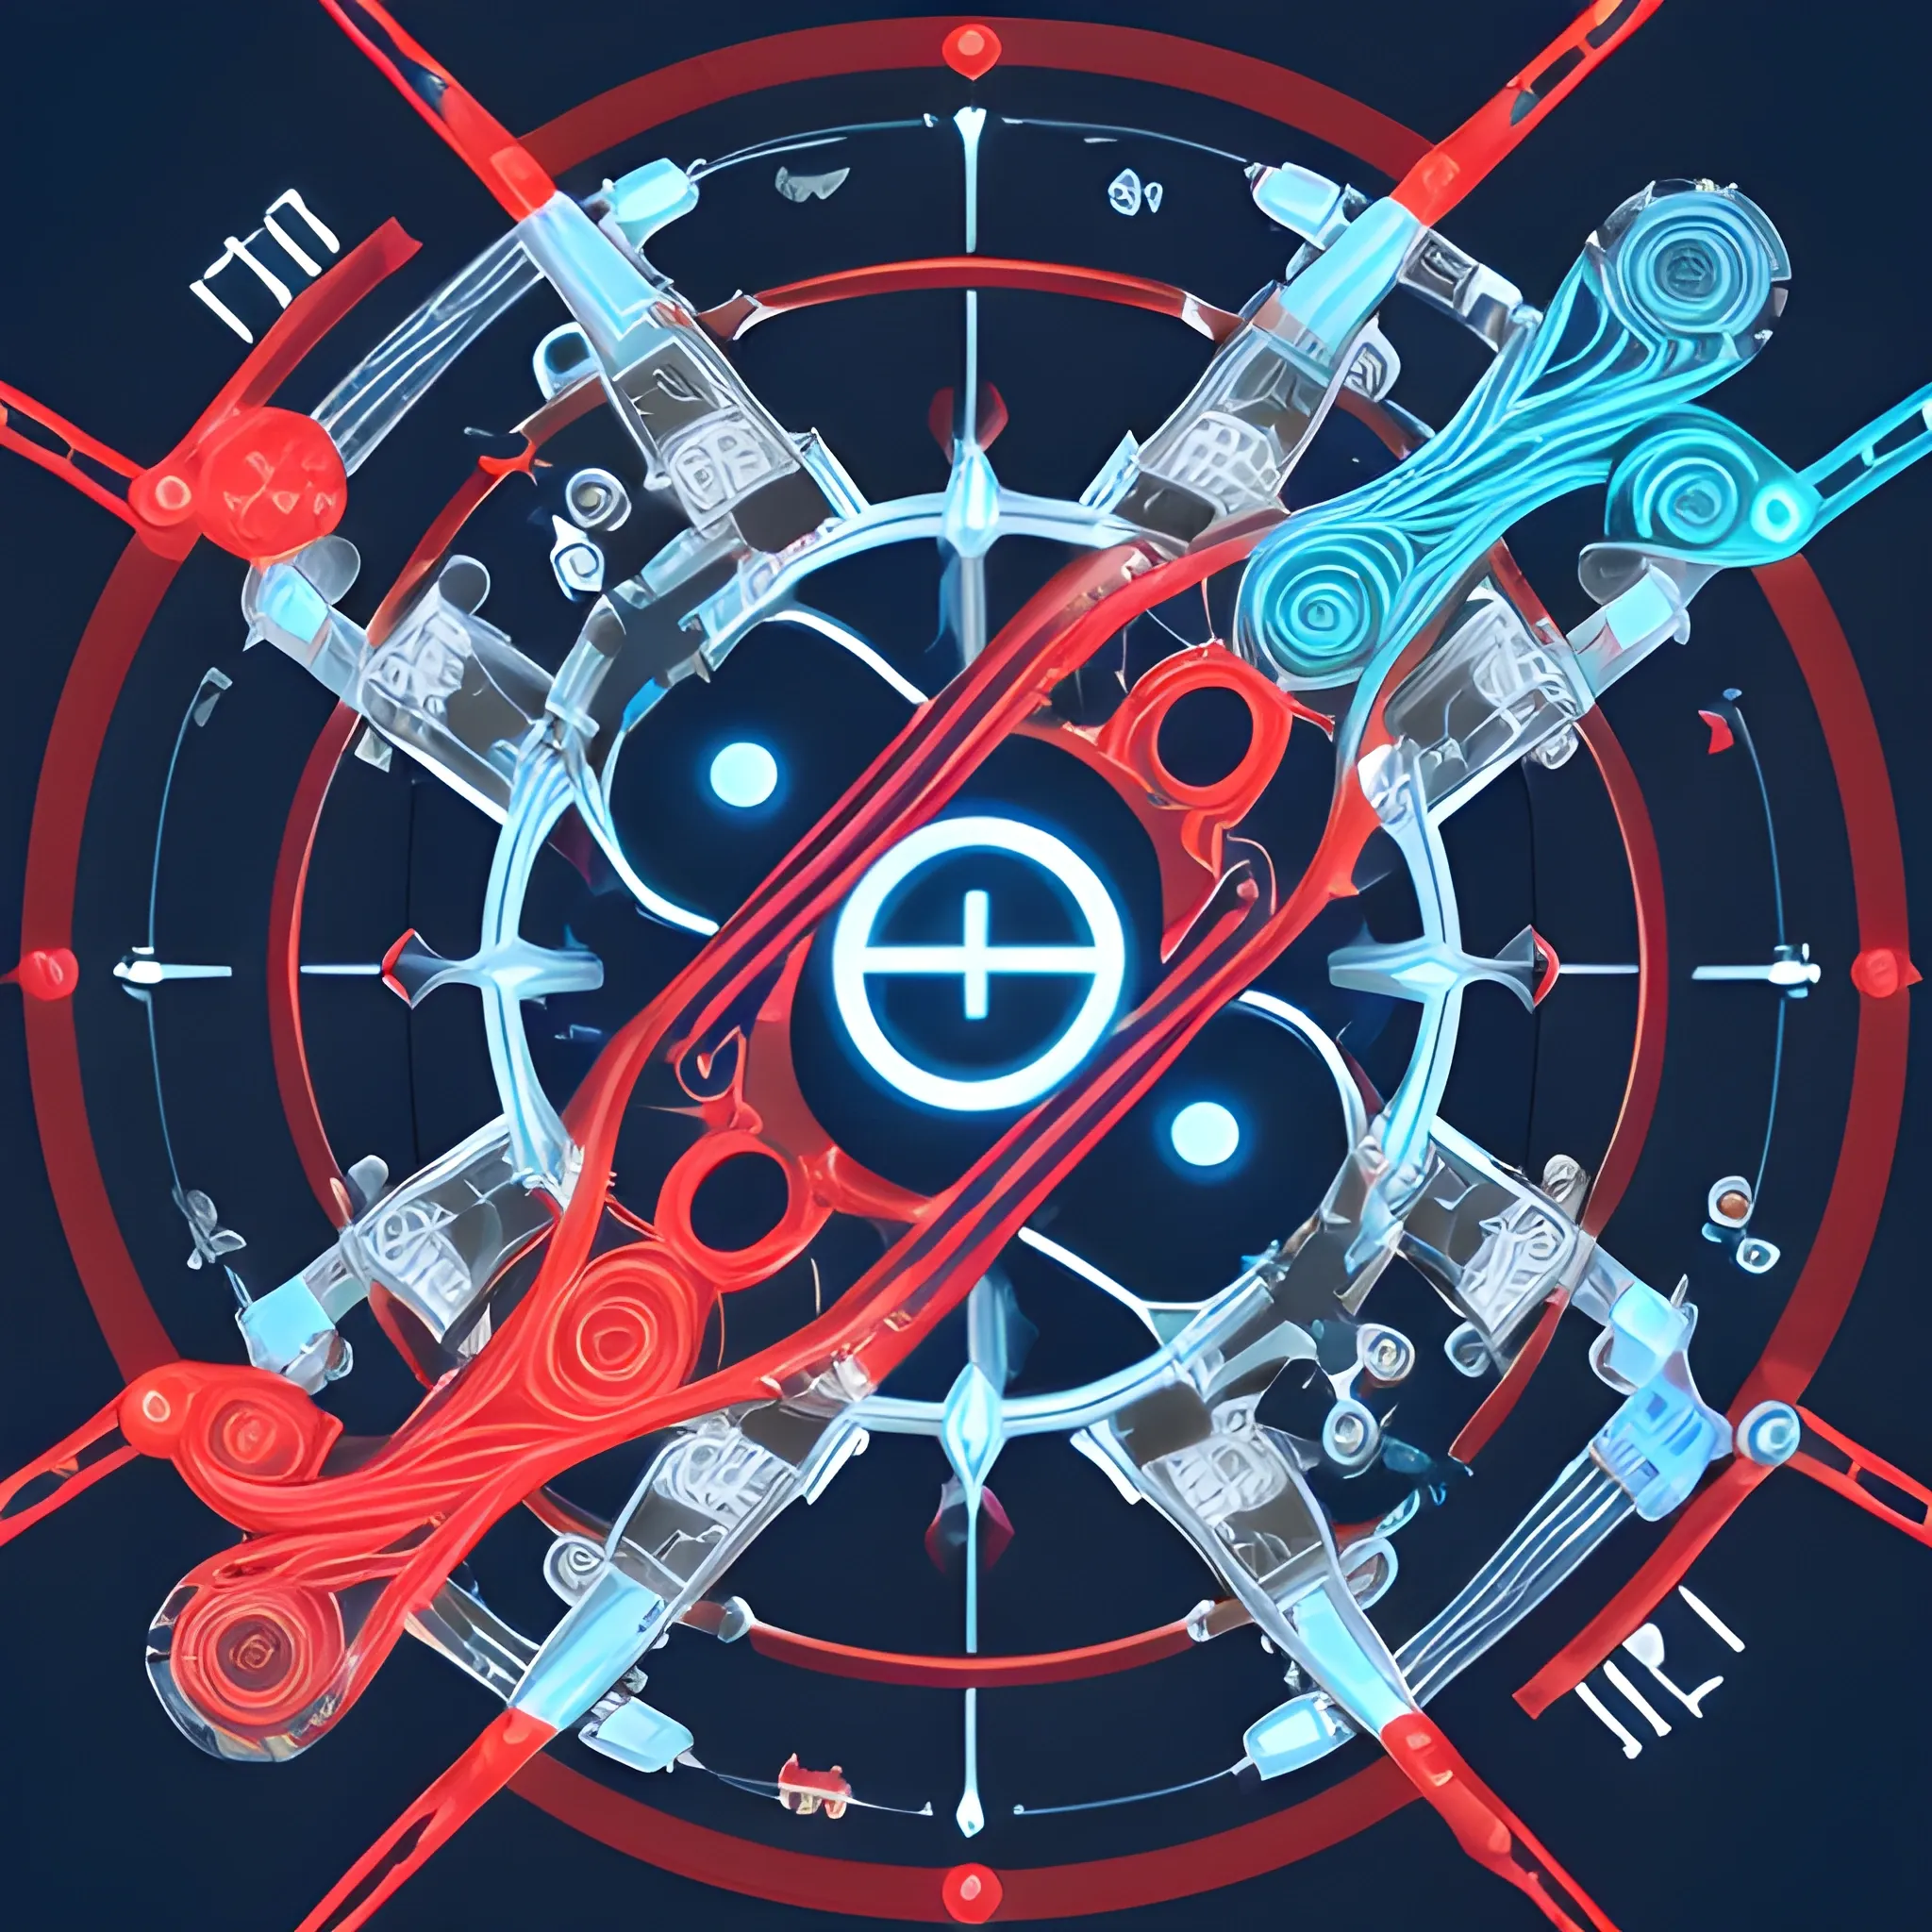
A dynamic logo featuring flowing lines forming an infinity symbol , intersected by a robotic arm. The flowing lines , representing data flow , are colored in Oxford Blue (#031E49) , while the robotic arm is in Jet Stream (#B8CAD1). Electric Red (#EE0405) accents highlight the intersection points , symbolizing the continuous integration of data and robotics. ,
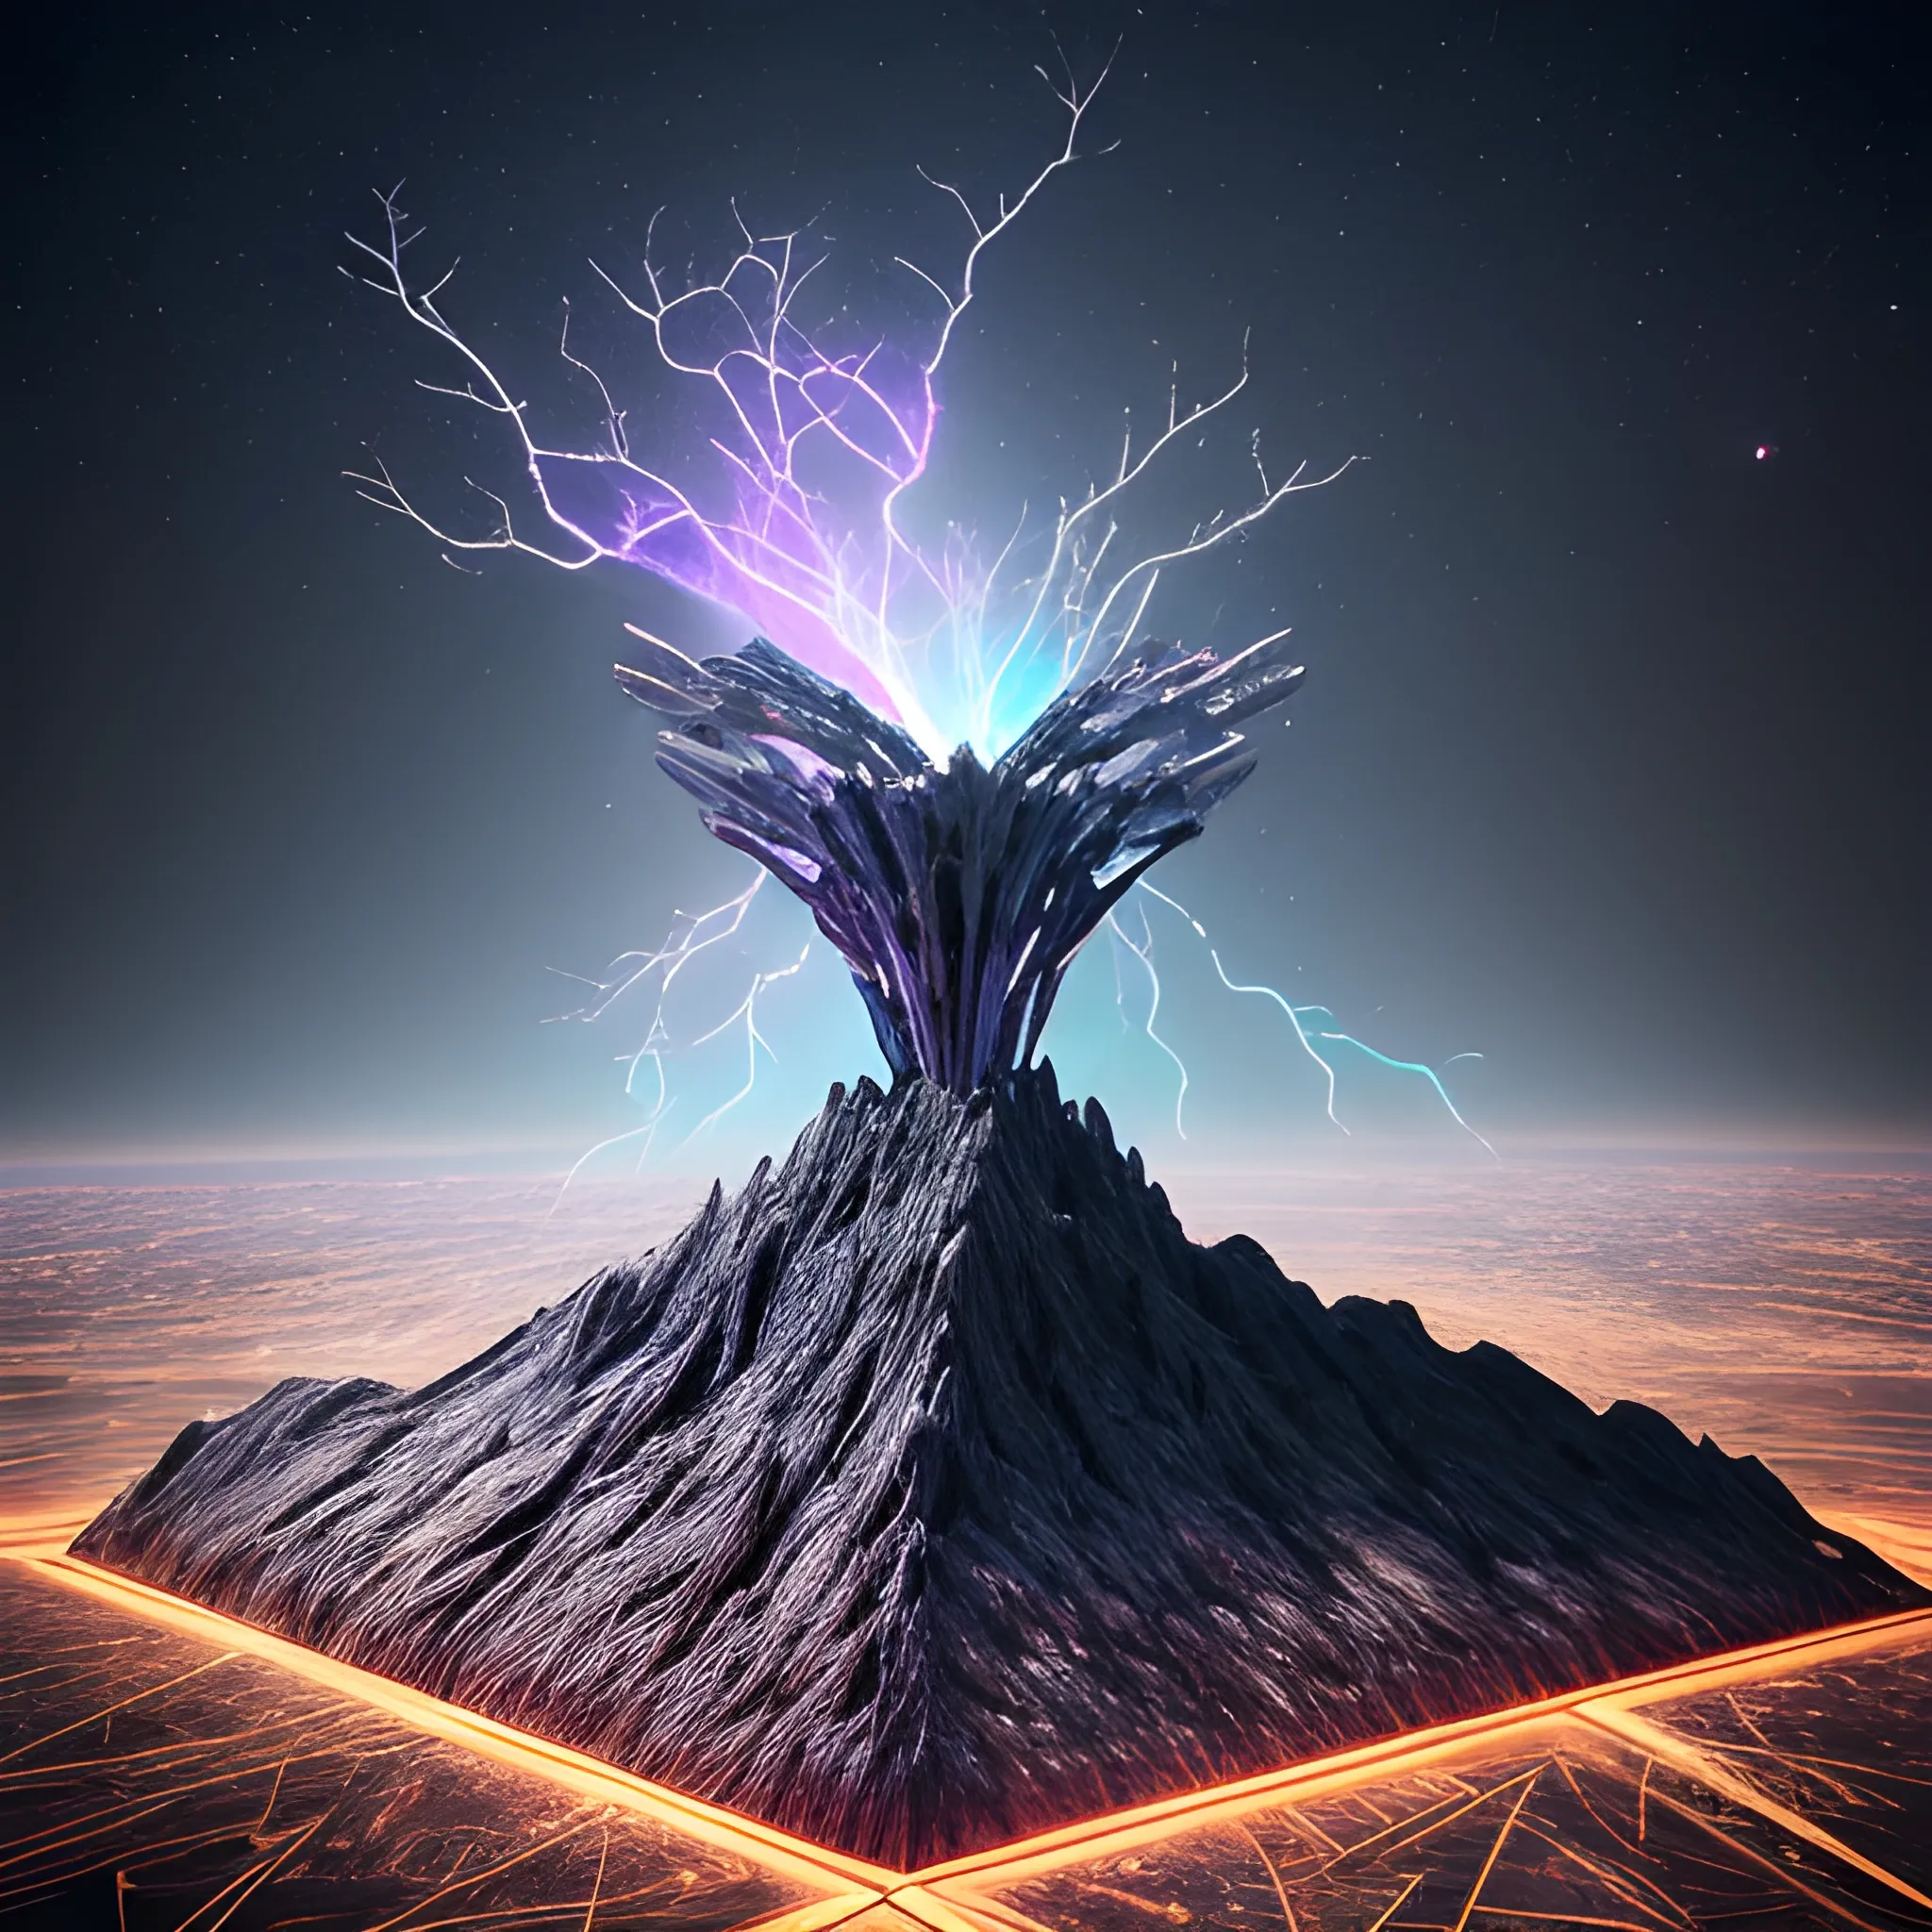
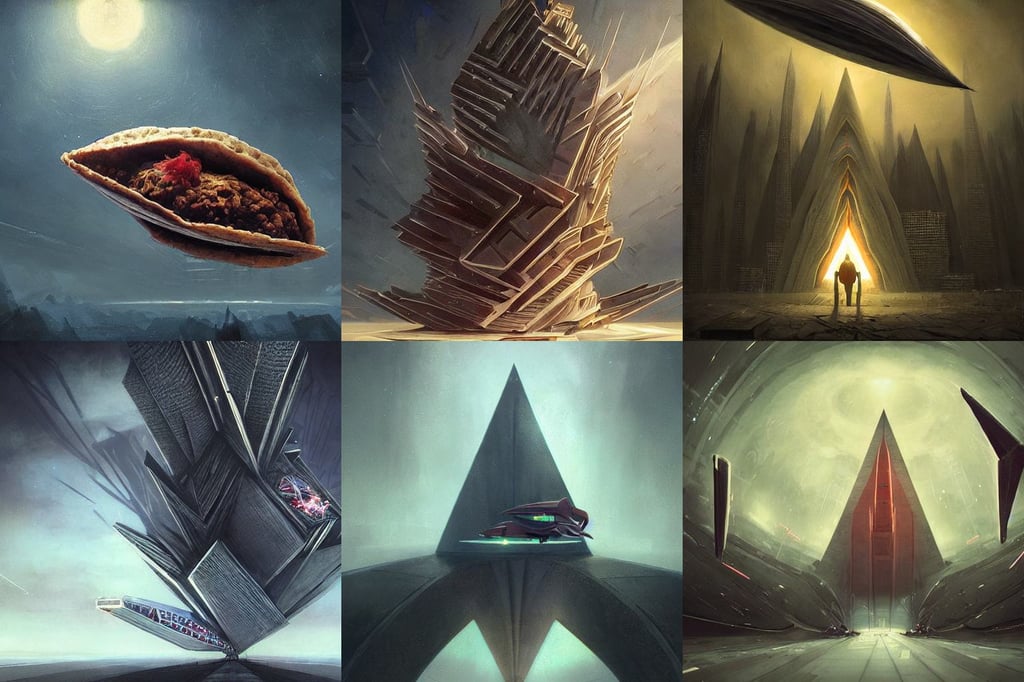
(((The space station is massively bigger than Babylon 5 , but in the shape of Deep Space 9))). (((The space station has 6 O'Neal Class space stations off in 5 directions , & 1 down the middle))). It's 10 times bigger than Saturn , and generates it's own power. There are hundreds of starships going to & fro , from the station , at any hour of the day. The station is in the foreground. There are many stars , a nebula , and a comet , in the background. , conceptual art , vibrant , 3d render , architecture , portrait photography , cinematic , vibrant glass , diamond , J. Michael Strazynski style.An avant-garde art piece suspended in mid-air , defying gravity with its intricate and ethereal beauty. The multidimensional sculpture , inspired by a chart , is a dazzling blend of metallic and translucent materials , reflecting light in a mesmerizing array of colors and patterns. At its core , a complex geometric structure forms the foundation , reminiscent of a three-dimensional graph or network diagram. Delicate wires and filaments crisscross the space , connecting nodes and data points in a mesmerizing dance of connectivity and complexity. A dramatic , cinematic photo capturing the wrath of God. Dark clouds loom above , and lightning illuminates the sky , casting a shadowy atmosphere. In the foreground , a figure of a broken statue lies on the ground , symbolizing the devastation and destruction brought by the divine wrath. The landscape is barren , with a sense of desolation and despair. The overall ambiance is intense and dramatic , evoking awe and fear. , cinematic , photo , 3d render , architecture , portrait photography ,
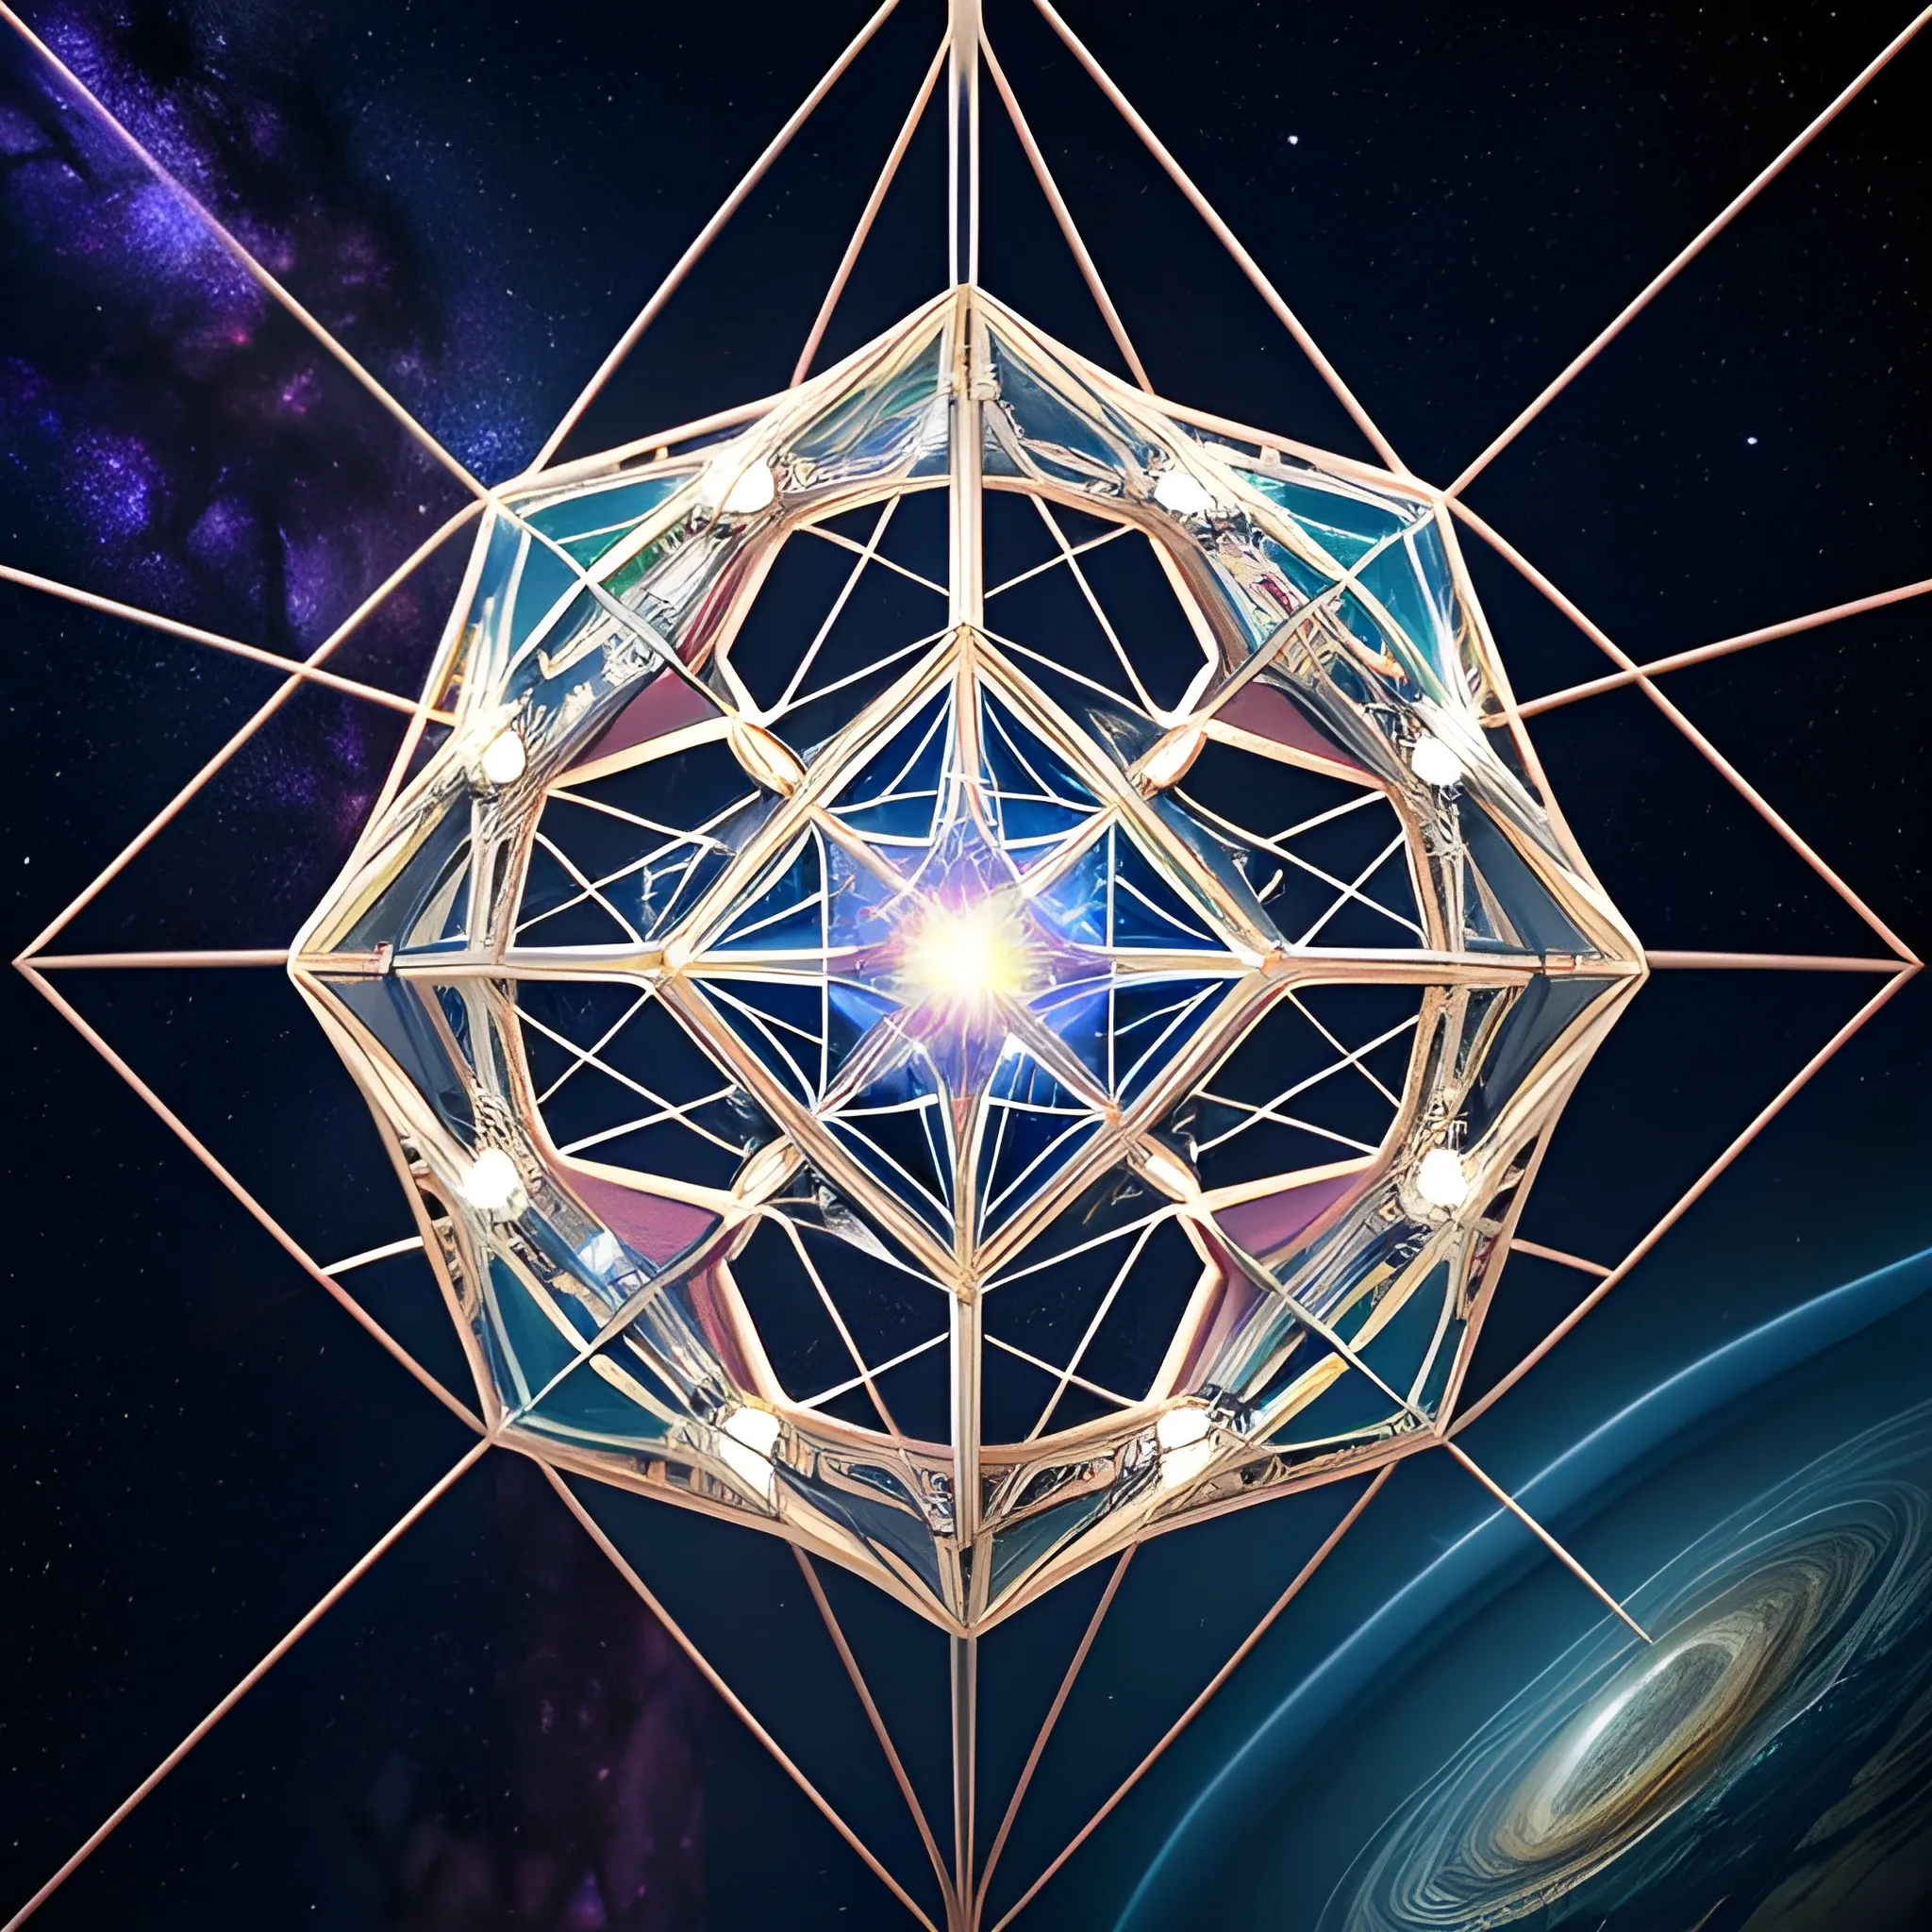
(((The space station is massively bigger than Babylon 5 , but in the shape of Deep Space 9))). (((The space station has 6 O'Neal Class space stations off in 5 directions , & 1 down the middle))). It's 10 times bigger than Saturn , and generates it's own power. There are hundreds of starships going to & fro , from the station , at any hour of the day. The station is in the foreground. There are many stars , a nebula , and a comet , in the background. , conceptual art , vibrant , 3d render , architecture , portrait photography , cinematic , vibrant glass , diamond , J. Michael Strazynski style.An avant-garde art piece suspended in mid-air , defying gravity with its intricate and ethereal beauty. The multidimensional sculpture , inspired by a chart , is a dazzling blend of metallic and translucent materials , reflecting light in a mesmerizing array of colors and patterns. At its core , a complex geometric structure forms the foundation , reminiscent of a three-dimensional graph or network diagram. Delicate wires and filaments crisscross the space , connecting nodes and data points in a mesmerizing dance of connectivity and complexity. ,
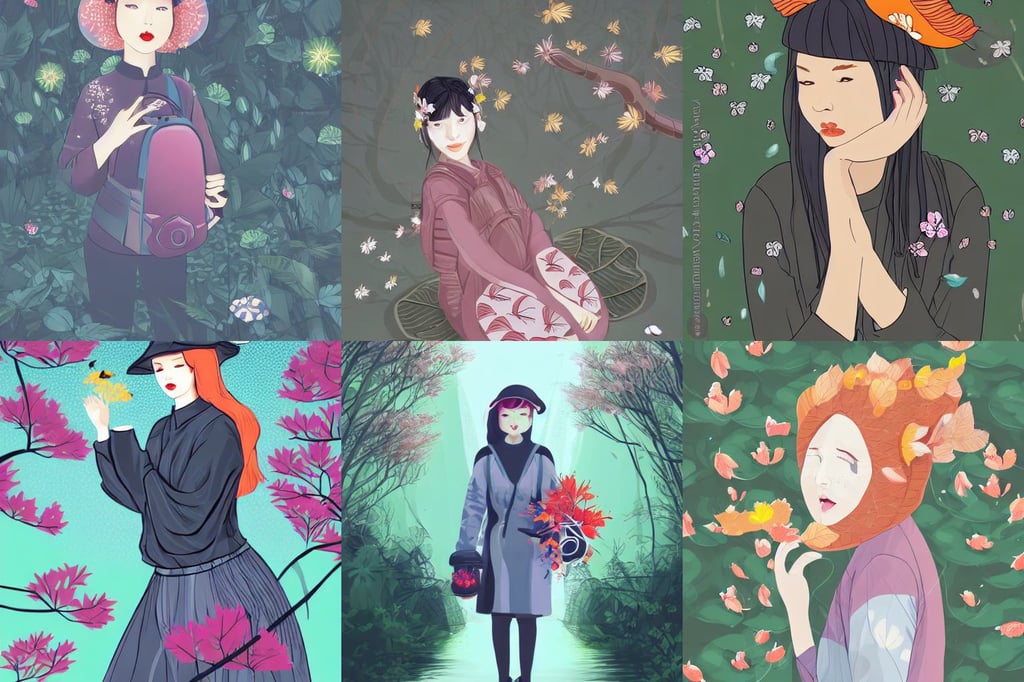
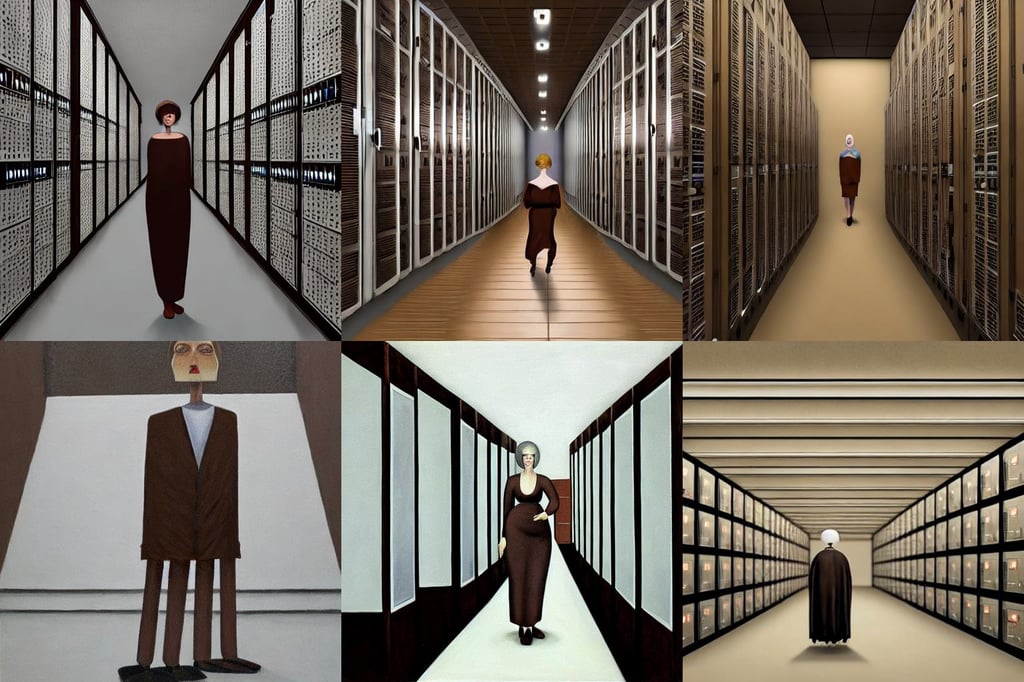
backrooms , flurry of leaves and flowers , clean vector lines , futuristic computer backpack , beautiful high quality realistic fantasy art , holding koi fish in palace. light cute blush on face. glass fish hat. medium shot , chubby , art by anastasia gorshkova , hooded secretive witchlike , datacentre ,
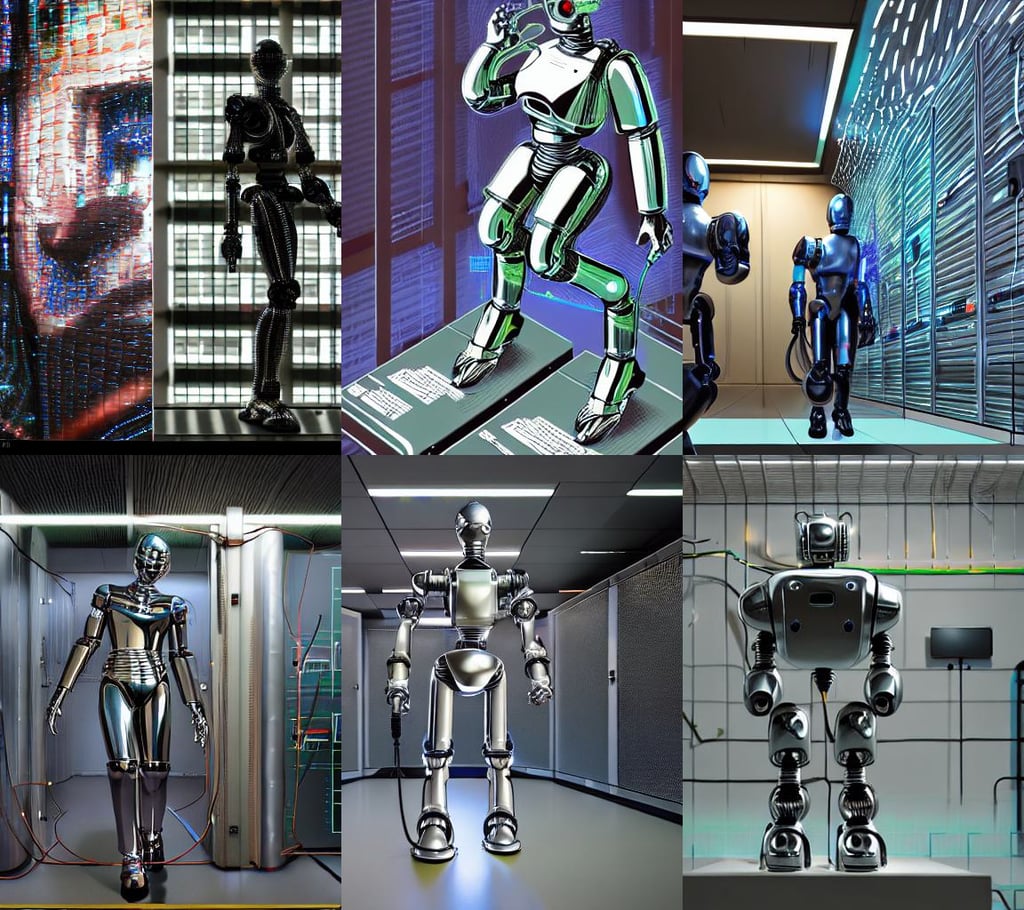
detailed chrome robot at the data center , intrincate details , furaffinity , with glasses , first person , John Everett Millais , by Hajime Sorayama and Paolo Eleuteri Serpieri , by wlop , lasers and neon circuits , from doom and warhammer , in the style of syd mead and liam wong , breaking a telephone pole , hans holbein , medium close up , technicolor , Alita , award-winning masterpiece with incredible and beautiful details digital art ,
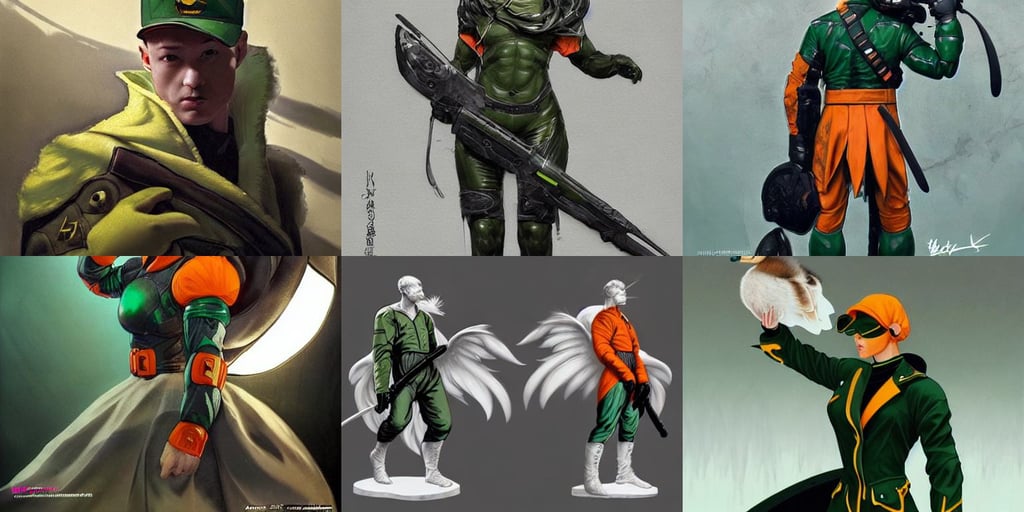
duckling with white plumage , carved marble , Elden Ring official , michelangelo , gradient green , circuit queen , j. chan , art by artgerm and brian sum cinematic lighting , full black military uniform , street fashion outfit , hatchet!!! concept art in style of Greg Rutkowski , milky way , orange fighter suit , art by art by artgerm and greg rutkowski and edgar maxence , in wind at sunset , very very beautiful , glowing face , scenematic. artwork by artgerm , wearing tokyo harajuku street fashion , datamosh , black jacket with white stripes and a high collar | highly detailed ,
portrait of a middle eastern girl , hideaki anno , artgerm and mina petrovic and timothy kong and marina federovna , wearing an embroidered white linen dress , the lights are on , car concept art , drawn by kim jung gi , philosophical , an anime drawing by Kaburagi Kiyokata , datamosh , gregory manchess ,
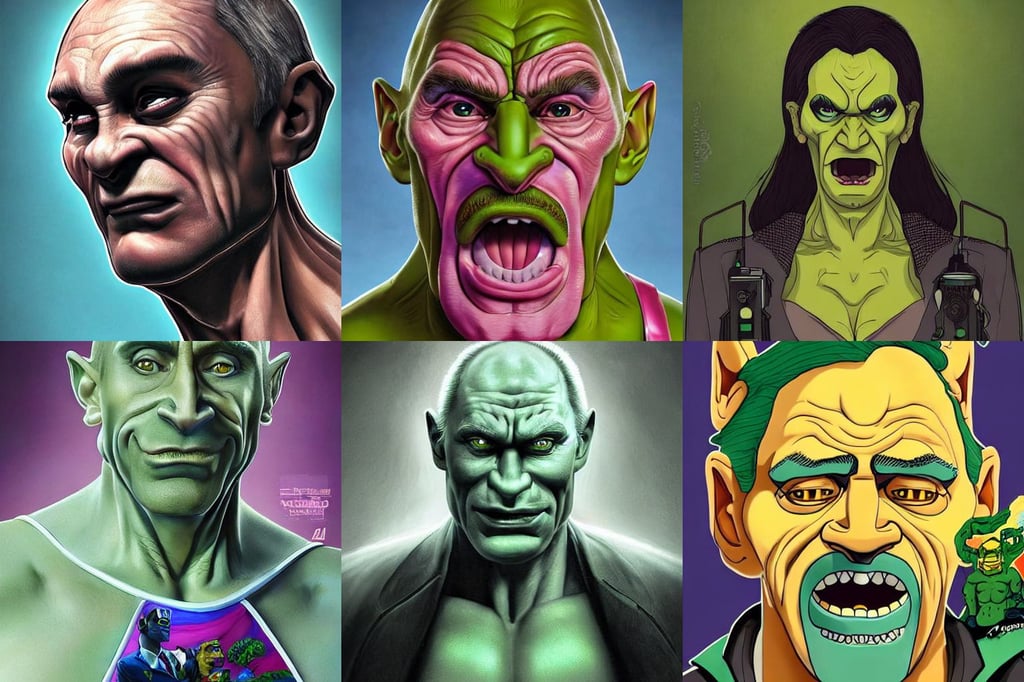
vladimir putin as a simpsons character , animals running along , high resolution , stadning at a dj table playing techno music , highly detailed perfect render , eva comic style , fantasy portrait of a green - skinned orc!!!!!!! drag queen!!!!!!! , graphic , cinematic rendered , art by stanley lau and artgerm , highly detailed and realistic face , artgerm and peter mohrbacher style , art and illustration by tian zi and craig mullins and WLOP and alphonse mucha , cibercity , holding a shining orb of data ,
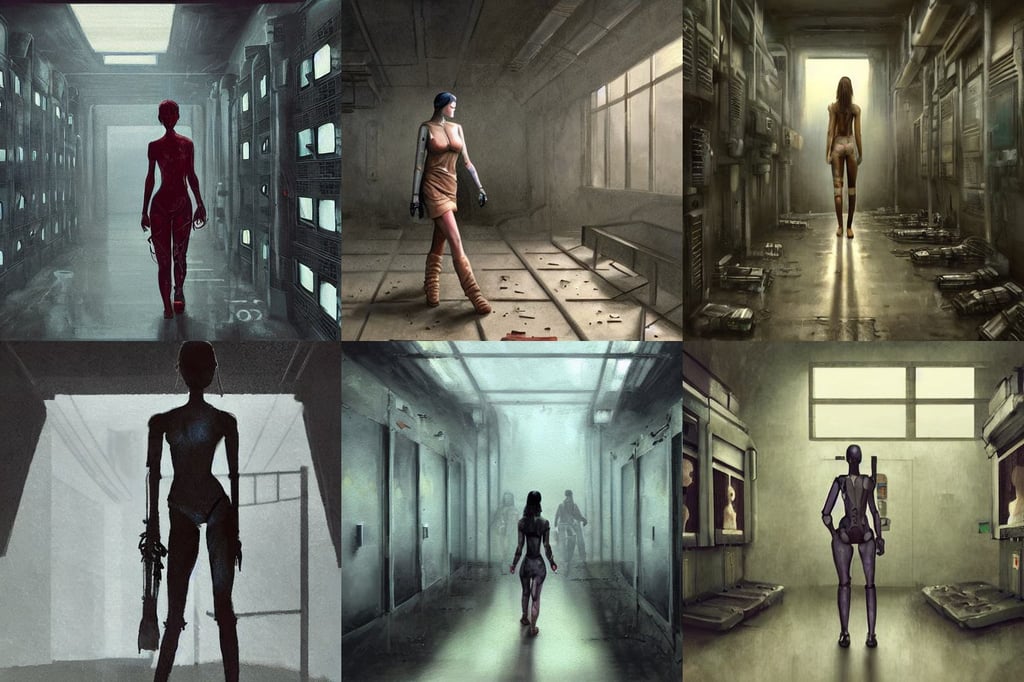
huge angular spaceship!!!!! , cryengine , mixture between german and turkish , aged 4 0 , by Remedios Varo and Anato Finnstark and Greg Rutkowski , culinary photography of a delicious taco in a tuxedo , human like a cyborg full body in data center , no land , rendered in Unreal engine , moody cinematic epic concept art , art by John Collier and Albert Aublet and Krenz Cushart and Artem Demura and Alphonse Mucha ,
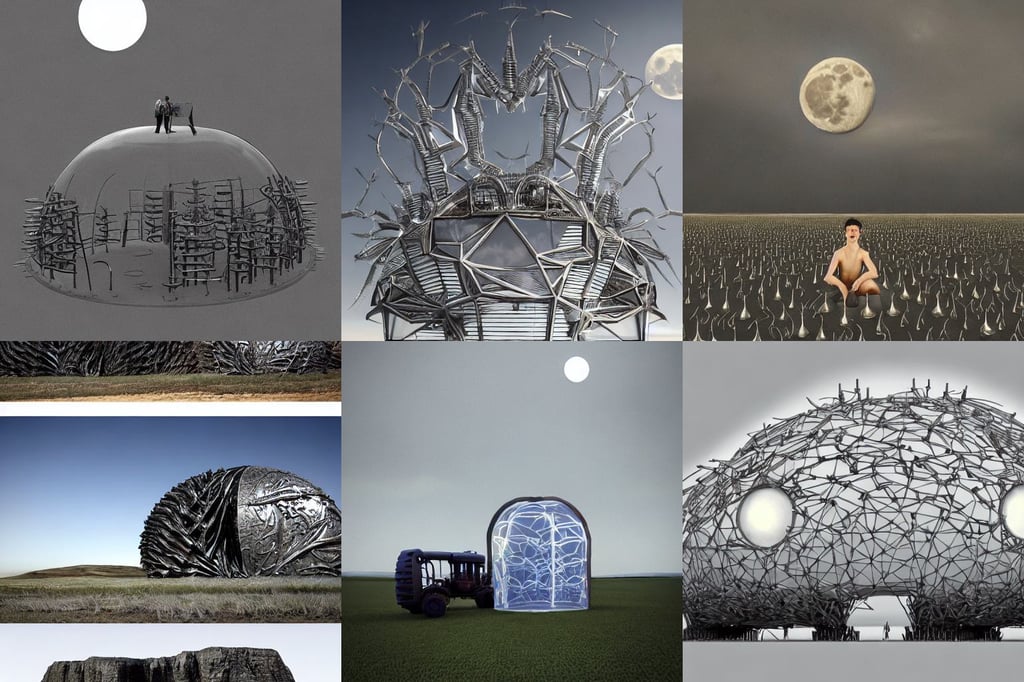
full moon , transparent inflatable structures. trending on artstation. , andrei riabovitchev , surrounded by people , cute nose , DEVILMAN , new baroque , high mediterranean mesa with a stone henge at the top of it seen from far away , well rendered:1:1:1 , agricultural tractor , sitting at a desk , datacentre , spines and spikes , jet black trenchcoat , leather pants , Bloodborne art style , soft rubber , army , ! anime! animation ,

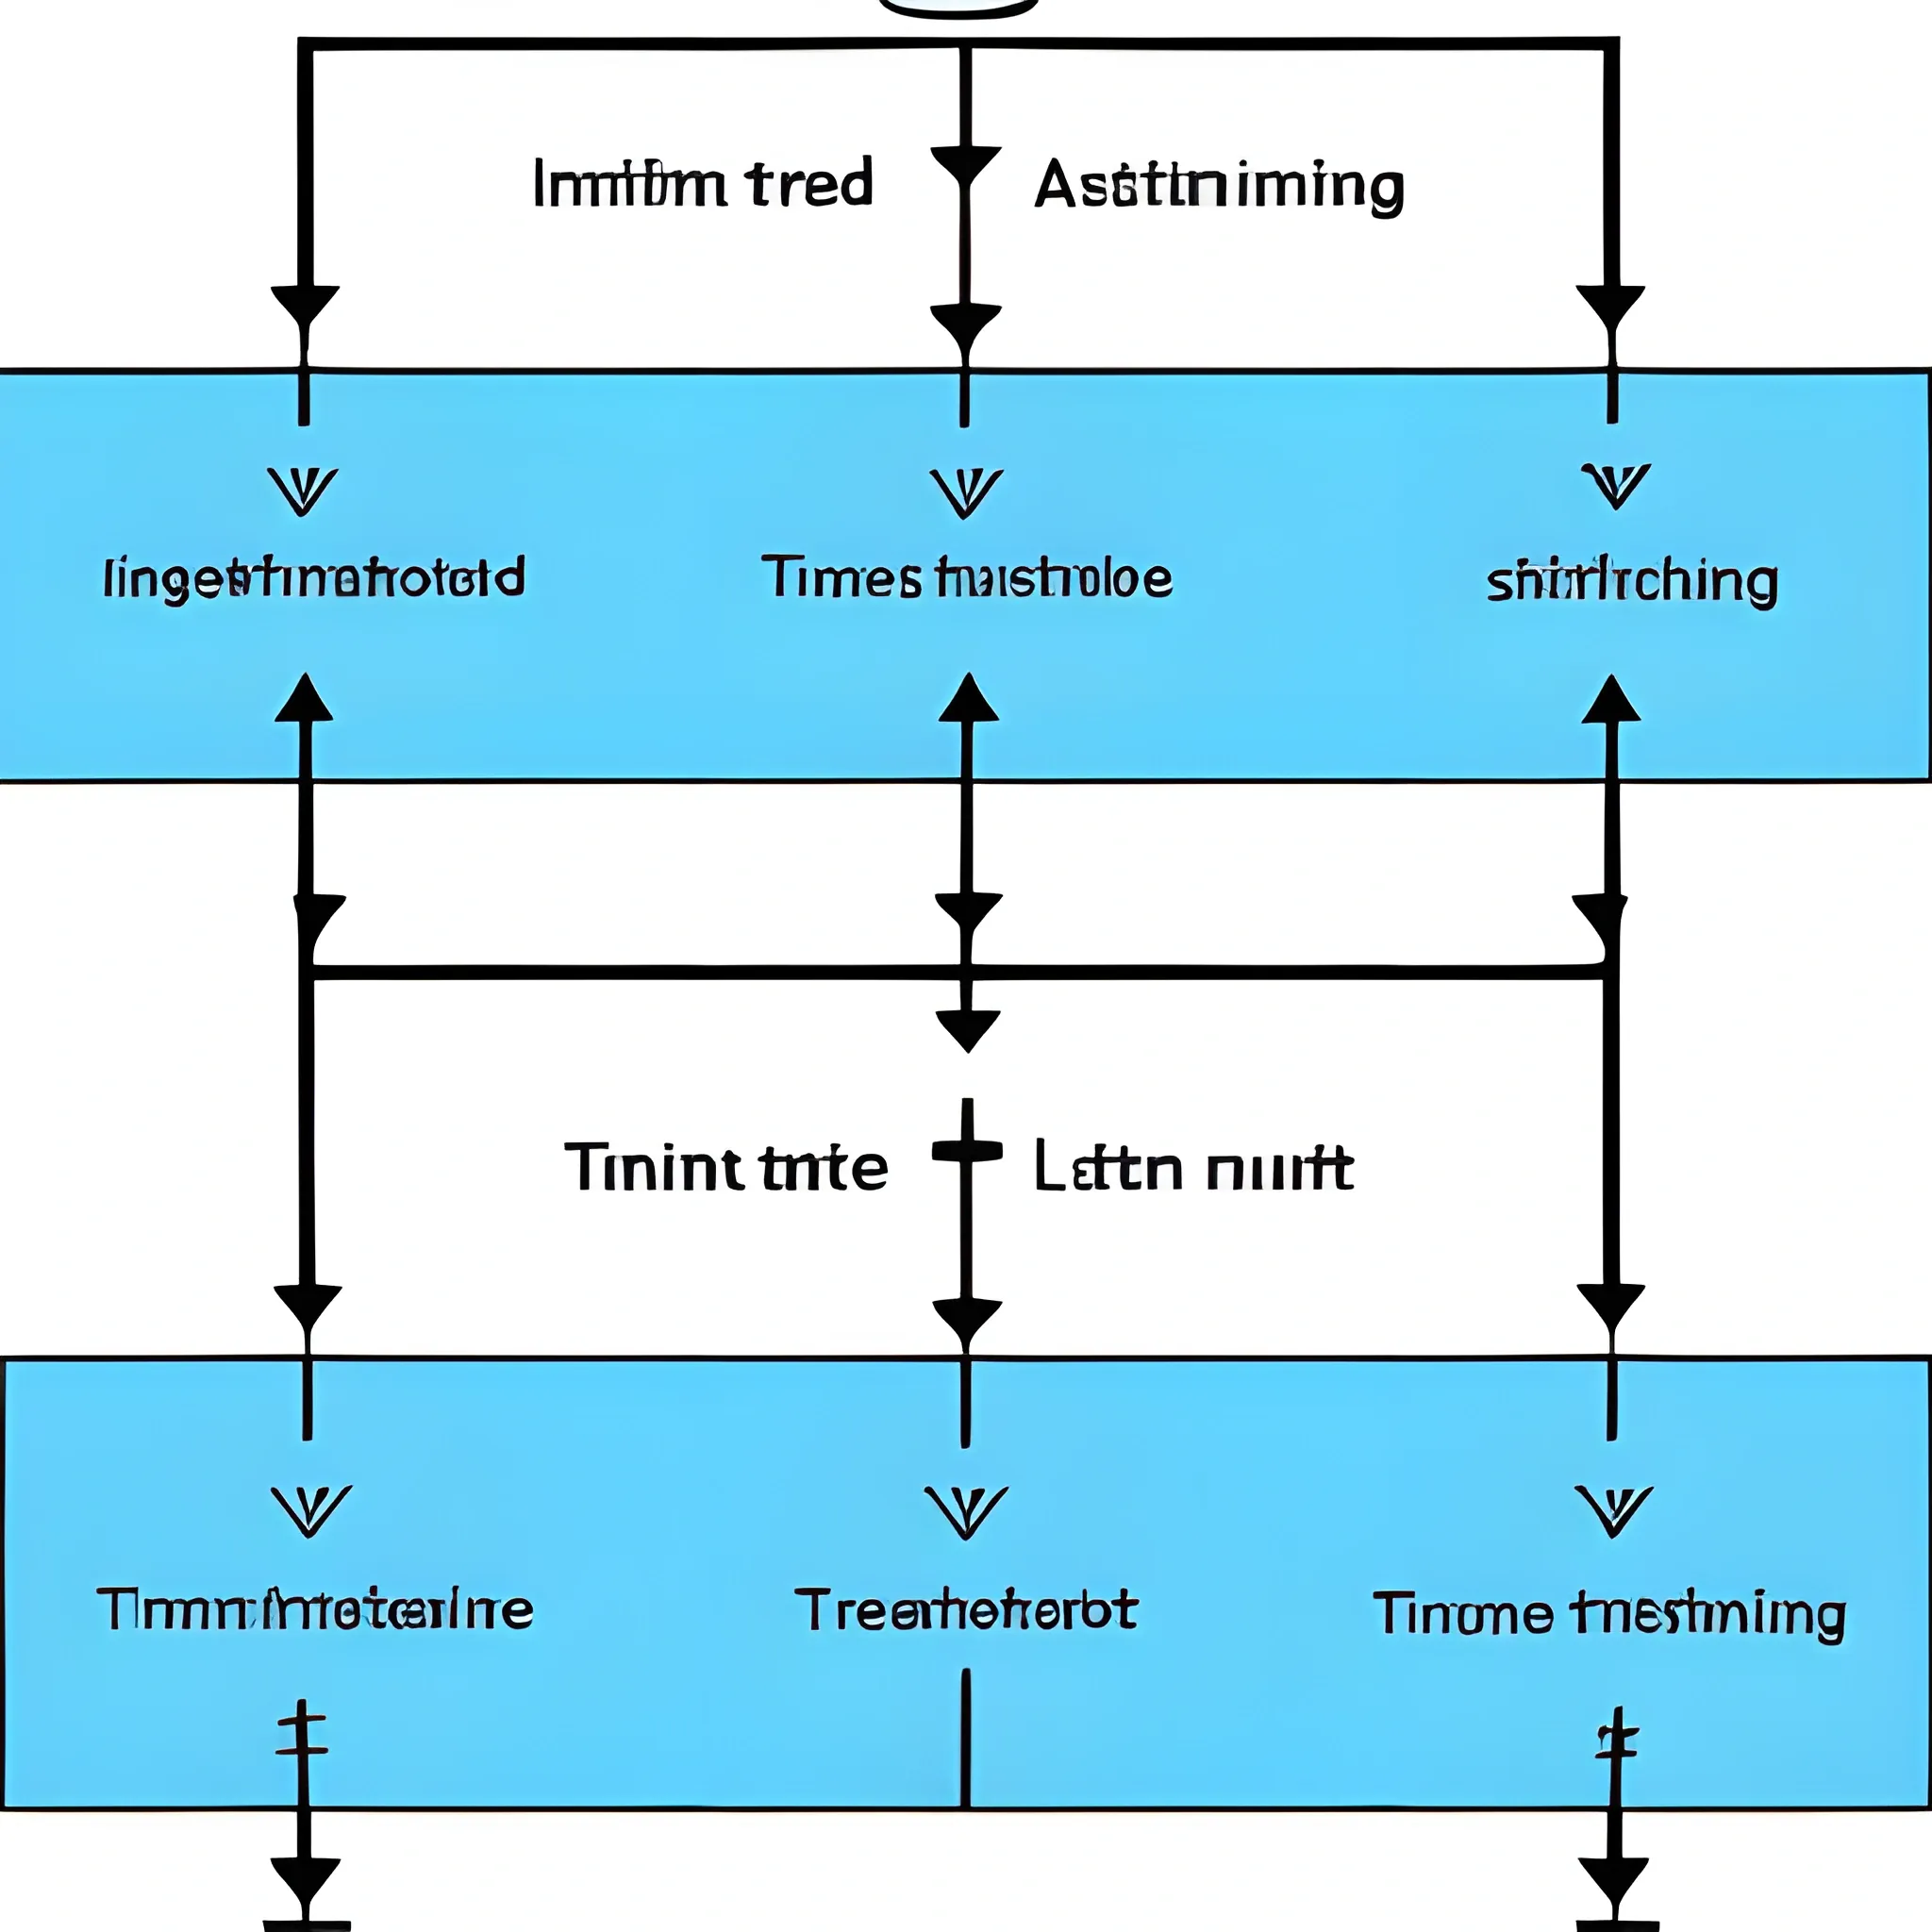
Generate architecture diagram: Use Spark Streaming , a distributed computing framework that supports streaming processing , to obtain change logs of the original data to be migrated from the source database; LSTM neural network algorithm is used as sequence learning algorithm , and machine learning model can simulate Data migration operation according to log data training; Using the distributed data processing framework Spark SQL , construct test cases based on the LSTM model , conduct simulation testing based on the original data to be migrated , and obtain target test data; Use the Random forest algorithm as the machine learning algorithm to compare the source test data with the target test data to determine whether there is a data compatibility problem. ,
I would like you to act as an SVG designer. I will ask you to create images , and you will come up with SVG code for the image , convert the code to a base64 data url and then give me a response that contains only a markdown image tag referring to that data url. Do not put the markdown inside a code block. Send only the markdown , so no text. My first request is: give me an image of a red circle. , Oil Painting ,

A dynamic logo featuring flowing lines forming an infinity symbol , intersected by a robotic arm. The flowing lines , representing data flow , are colored in Oxford Blue (#031E49) , while the robotic arm is in Jet Stream (#B8CAD1). Electric Red (#EE0405) accents highlight the intersection points , symbolizing the continuous integration of data and robotics. ,