Search Results for with backlight
Explore AI generated designs, images, art and prompts by top community artists and designers.
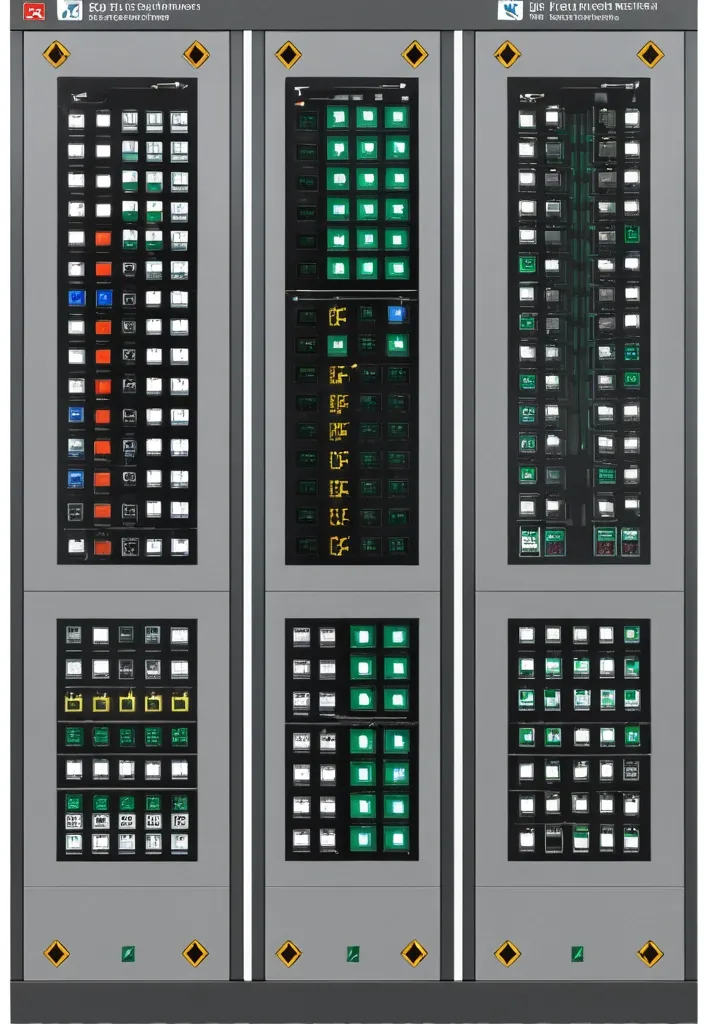

Description of the visualization and control system of the automation complex The purpose of the system is to provide the operator with a single , intuitive interface for monitoring and managing all subsystems of the complex in real time. Architecture of the main window (Generalized Status Panel): The main screen is designed according to the principle of "from general to private". The center contains critical information about the power supply system , on which all other systems depend. The remaining subsystems are grouped logically around the center. 1. Central unit: Power supply system It is visualized as a circle divided into three sectors. Large left sector (≈45%): Transformer substations (TP) 5 blocks are displayed , one for each TP. Each block contains: TP number/name (for example , TP-1 , TP-2). The indicator of the active power line: The "Network" icon with backlight (green - main , yellow - backup). Transformer status: "Main" / "Standby" (or icons). Key parameters from accounting nodes: Current (I) , Voltage (U) , Power (P). The values are output for the active line. General TP status: Color indication (Green - Normal , Yellow - Warning , Red - Emergency). Large right sector (≈45%): Main switchboards 5 blocks are displayed , one for each storage unit. Each block contains: The number/name of the GRSH (for example , GRSH-1). Active power line indicator: Similar to TP. Key parameters from accounting nodes: I , U , P. The general status of the GRS: Color indication. Lower small sector (≈10%): Uninterruptible power supply (UPS) Large text or pictogram status indicator: "Mains operation" (Green) "Battery operation" (Yellow/Orange) Battery level indicator: Percentage scale (from 0% to 100%). The color varies depending on the level (green >50% , yellow 20-50% , red <20%). 2. Peripheral blocks around the center They are arranged around a central circle , forming a "rim". Upper and lower parts of the rim: Ventilation of the web blowing Upper part: 9 installations on top. The lower part: 9 installations from the bottom. There are 18 icons/blocks in total. Each icon represents one installation and has a color indication of the status.: Green: Enabled Gray: Turned off Red: An accident (for example , the differential pressure sensor on the filter went off , an error in the drive) Black/Blue: No power supply When hovering over the cursor , a tooltip appears with details (the condition of the fan , valve , filter blockage). Left and right sides of the rim: Indoor ventilation The left and right sides are divided equally to display the 12 settings on each side. There are 24 icons/blocks in total. The same color status indication for each installation. 3. Corner blocks: Other subsystems They are located in the four corners of the screen for easy and fast perception. Upper left corner: Roller shutters (48 pcs.) Summary information is displayed as an information block.: "Closed: XX / Open: XX" (numeric values). A graphical indicator (for example , a stripe divided into green and blue parts , proportional to the number). General status: Green icon "OK" or Red icon "Emergency" (if at least one roller shutter has an emergency status). Upper right corner: Elevators (2 pcs.) Two vertical blocks , one for each elevator. Each block contains: Elevator number (Elevator 1 , Elevator 2). Floor indicator: A large number (for example , 3). Motion indicator: Up/down arrow or Stop icon. General status: The background color of the block (Green - normal , Gray - power off , Red - emergency , Blue - no connection). Lower left corner: EVIL Lights (Roof lamps) A large indicator in the form of a stylized lamp or icon. Color status indication: Bright Yellow/White: Included Gray: Off Red: Crash Black/Blue: No power supply Lower right corner: Heated storm drains Similar in style to the "Fires of EVIL" block. Color status indication: Orange/Red: Enabled Gray: Off Red (flashing): Crash Black/Blue: No power supply Navigation and management: Main Screen: It is an overview map. All the elements on it are clickable. Details: Clicking on any sector (TP , GRS , ventilation group , roller shutter unit) opens a new window with detailed information: TP/GRS: Single-line network diagram , status of all feeders and sectional switches , detailed power parameters. Ventilation: Detailed status of each piece of equipment in the selected group (fan , valve , filter condition) , possibility of manual control. Roller shutters: A table or plan of the building with the condition of each of the 48 roller shutters , group and individual control buttons. Control: The control buttons (Start , Stop , Open , Close) are located on the detailed screens. On the main screen , quick action buttons ("Emergency activation") can be displayed for critical systems (for example , EVIL lights). Visual style: Color scheme: An intuitive color palette is used (Green is the norm , Yellow/Orange is a warning , Red is an accident , Gray/Blue - disabled/no data). Fonts: Clear , easy-to-read fonts. Critical information is displayed larger. Animation: Minimal and informative (for example , smooth change of values , flashing for emergency states). ,

a pickle in a suit and tie , armpit , dc , Lucky star , Dreamworks , council chambers , long hair , anime key visual of a littlewitch , george lucas , house , beautiful shiny white porcelain rich galactic alt - punk clowncore russian cyborg college girl , of a old 18th century , John singer Sargent and James gurney , gurney with ambient lighting , style of by jordan grimmer and greg rutkowski , High Details , with backlight , by makoto shinkai , tim burton , a raven on his shoulder ,