Search Results for Data
Explore AI generated designs, images, art and prompts by top community artists and designers.
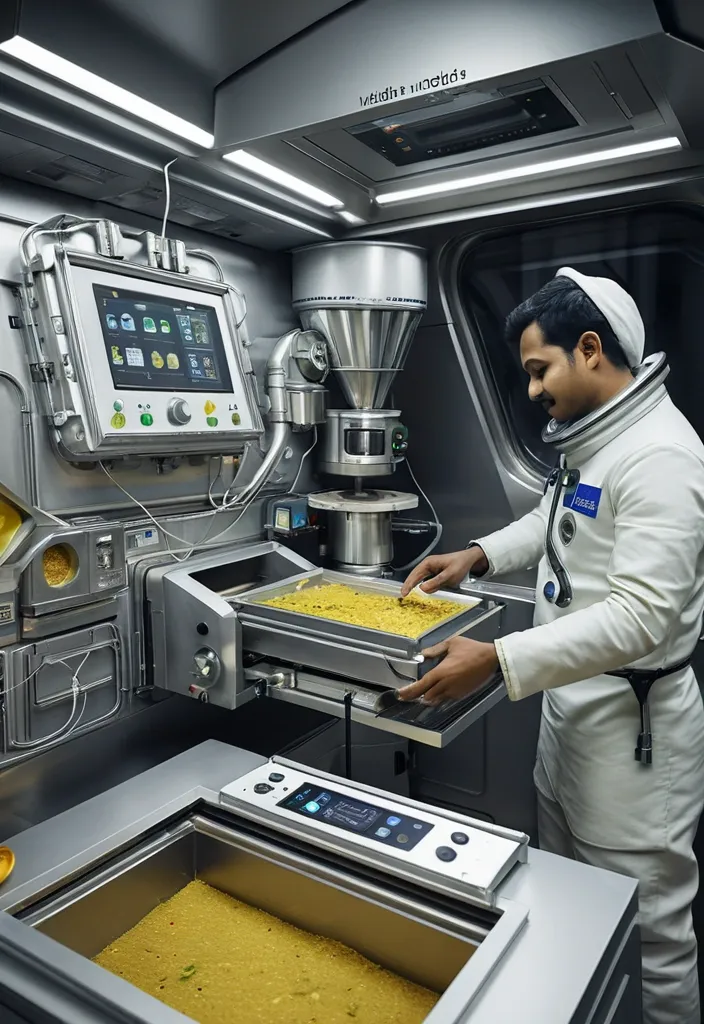

Inside a cramped , humming module of a lunar base , an astronaut is carefully tending to a samosa maker automatic digital machine , filled with vibrant , intricate holographic interface displaying complex samosa proccesing cartography. The scanner emits holographic monitoring data that showcases real-time food ingredients (Key ingredients include flour , ghee/oil , carom seeds (ajwain) , potatoes , green peas , cumin seeds , ginger , green chilies , coriander powder , dry mango powder (amchur) , and garam masala) statistics and insights above the machine , automates samosa ingredients tracking and gives you actionable insights to cut costs , reduce CO₂ , and boost efficiency , without changing how female kitchen works. The background is a sleek , minimalist command center , hinting at advanced technology and vast cosmic knowledge. The aesthetic combines the precision of 3D architectural rendering with the mystique of surreal landscapes. ,
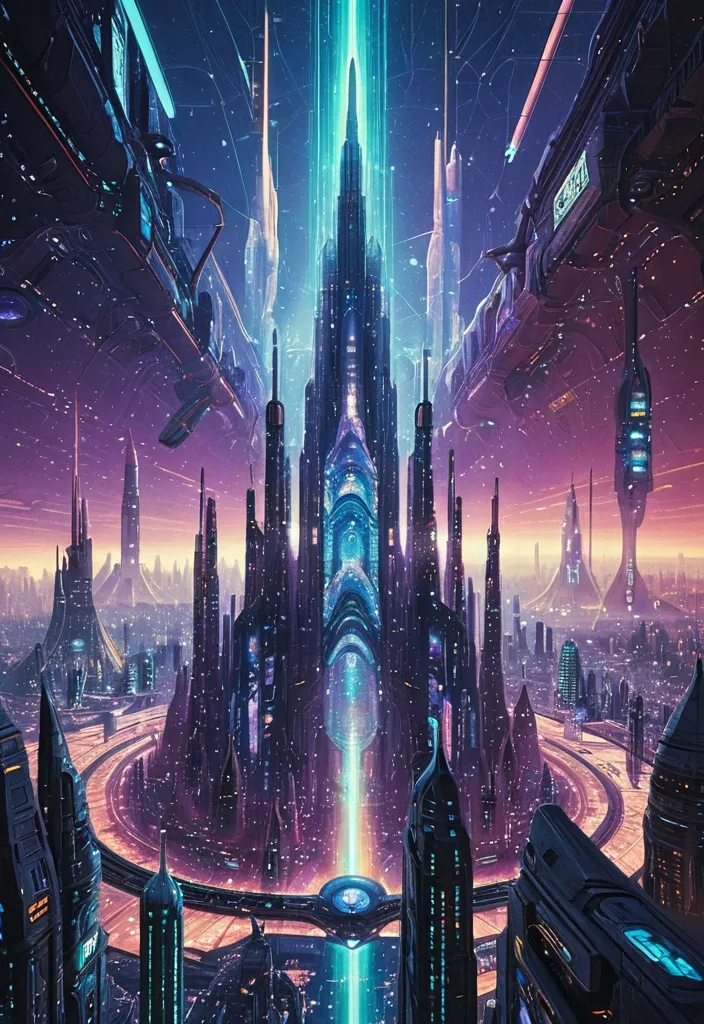
A chameleon , its scales a mosaic of shifting holographic data , navigates a sprawling , futuristic cityscape constructed from interwoven light and advanced alloys. Towering spires pierce a nebula-filled sky , reflecting the neon glow of a thousand advertisements. The mood is one of hyper-advanced civilization and technological marvel. Style: Epic space opera with cinematic lighting , reminiscent of Syd Mead and Moebius. ,
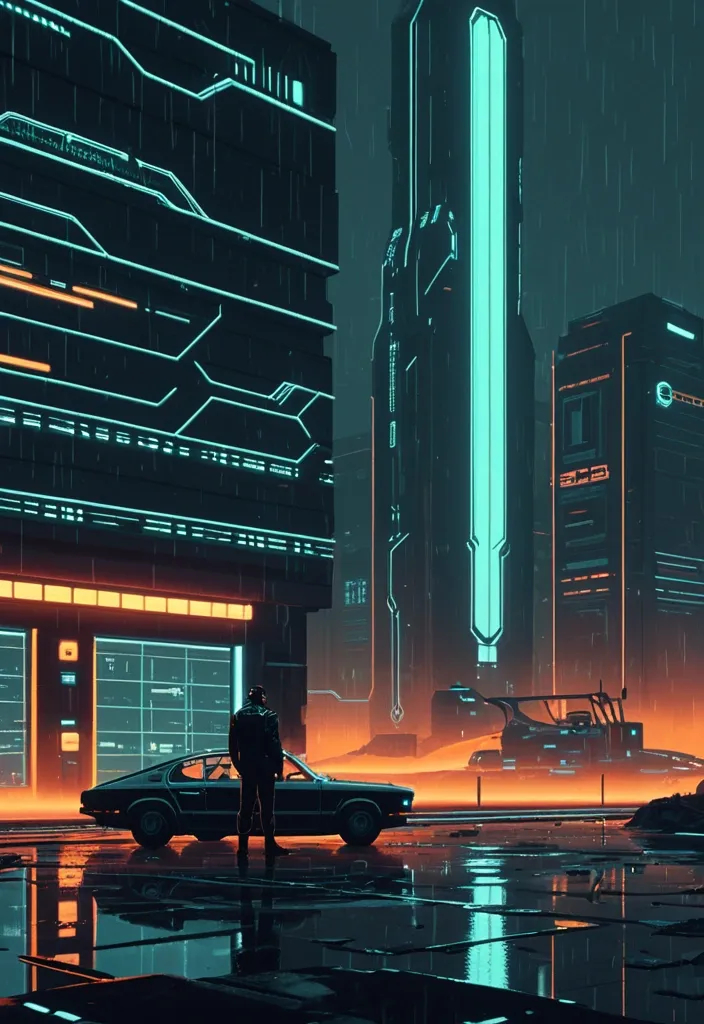
2D side-scrolling platformer , retro futuristic , minimal UI , game screenshot , moody lighting , cinematic but stylized , indie game aesthetic , 16:9 A 2D side-scrolling platformer screenshot. A tired programmer with stubble and cigarette stands next to a rusty old car in front of a massive futuristic data center. The building is simple but huge , with glowing vertical lights. Rain falls , minimalistic environment , strong silhouette composition. The car looks completely out of place. Minimal UI: small health bar , “DEBUG MODE”. Retro sci-fi vibe inspired by Another World and Inside. ,
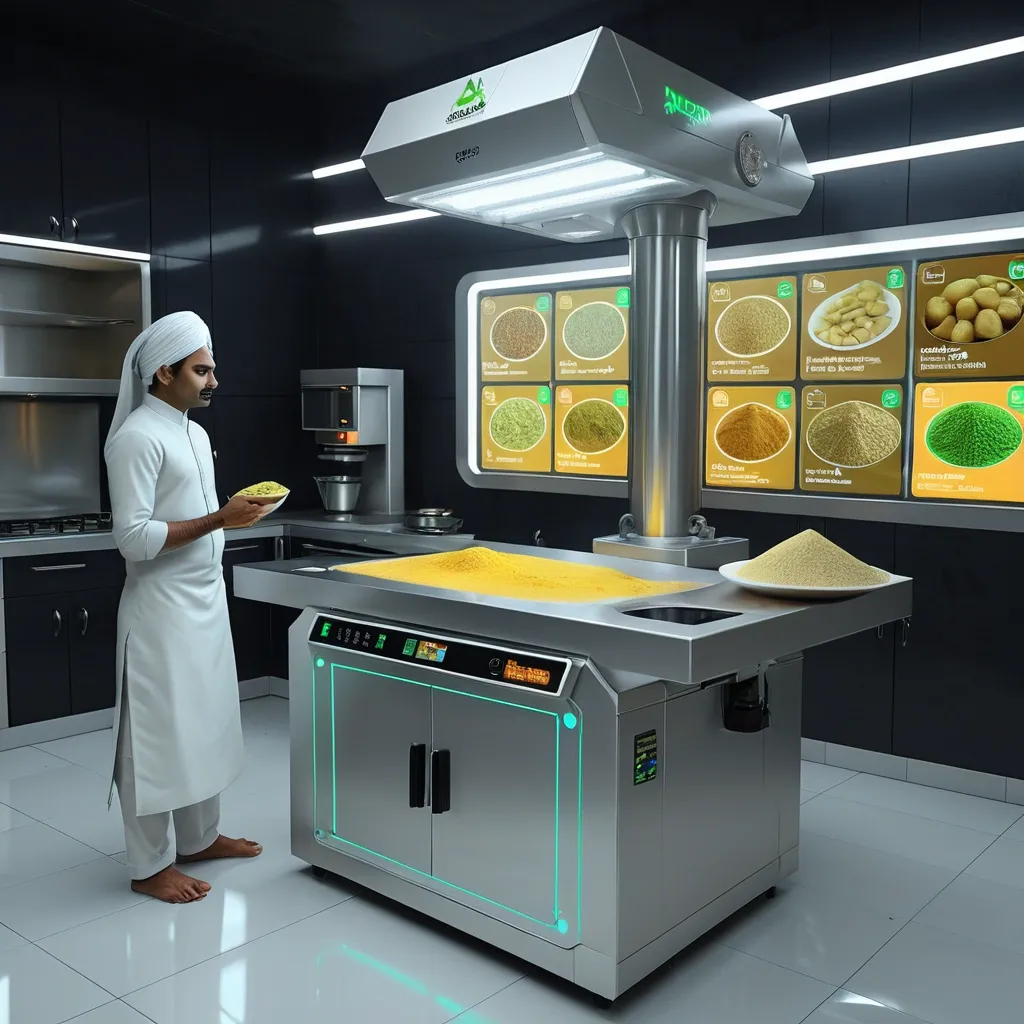
futuristic modern kitchen design , a samosa maker automatic digital machine , holographic display light , neon accents , clean sci-fi kitchen environment. The scanner emits holographic monitoring data that showcases real-time food ingredients (Key ingredients include flour , ghee/oil , carom seeds (ajwain) , potatoes , green peas , cumin seeds , ginger , green chilies , coriander powder , dry mango powder (amchur) , and garam masala) statistics and insights above the machine , automates samosa ingredients tracking and gives you actionable insights to cut costs , reduce CO₂ , and boost efficiency , without changing how female kitchen works. cinematic lighting , high detail , concept art , best quality , 16K ,
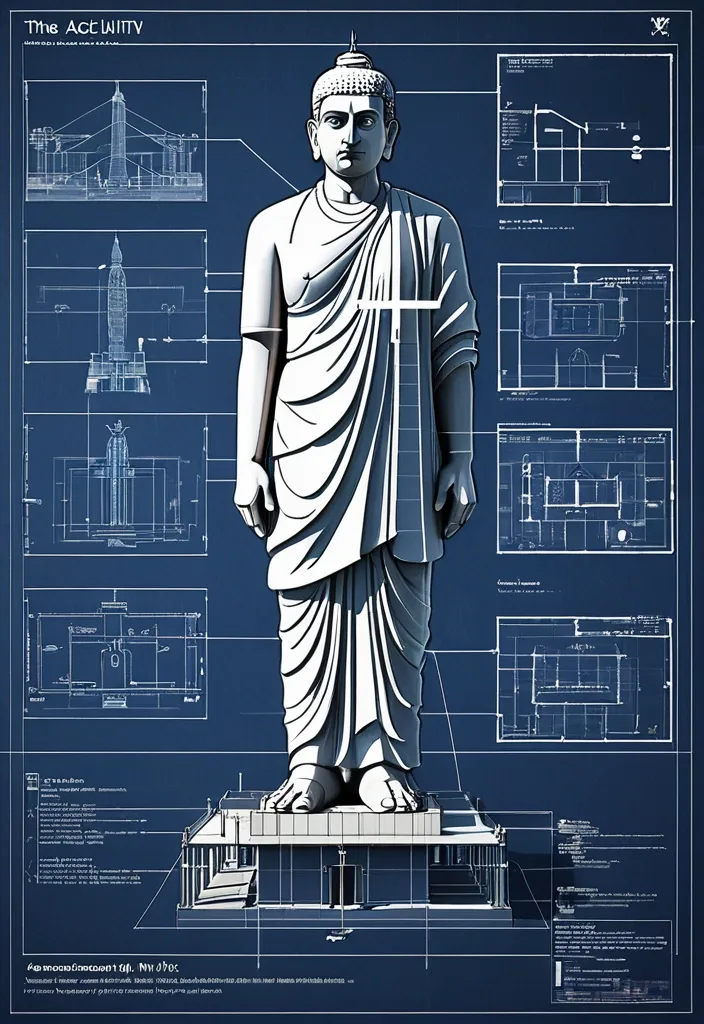
Create an infographic image of The Statue Of Unity(Statue of Unity is the world's tallest statue , with a height of 182 metres , located in Narmada valley , near Kevadia in the state of Gujarat , India) , combining a real photograph of the landmark with blueprint-style technical annotations and diagrams overlaid on the image. Include the title "The Statue Of Unity" in a hand-drawn box in the corner. Add white chalk-style sketches showing key structural data , important measurements , material quantities , internal diagrams , load-flow arrows , cross-sections , floor plans , and notable architectural or engineering features. Style: blueprint aesthetic with white line drawings on the photograph , technical/architectural annotation style , educational infographic feel. ,
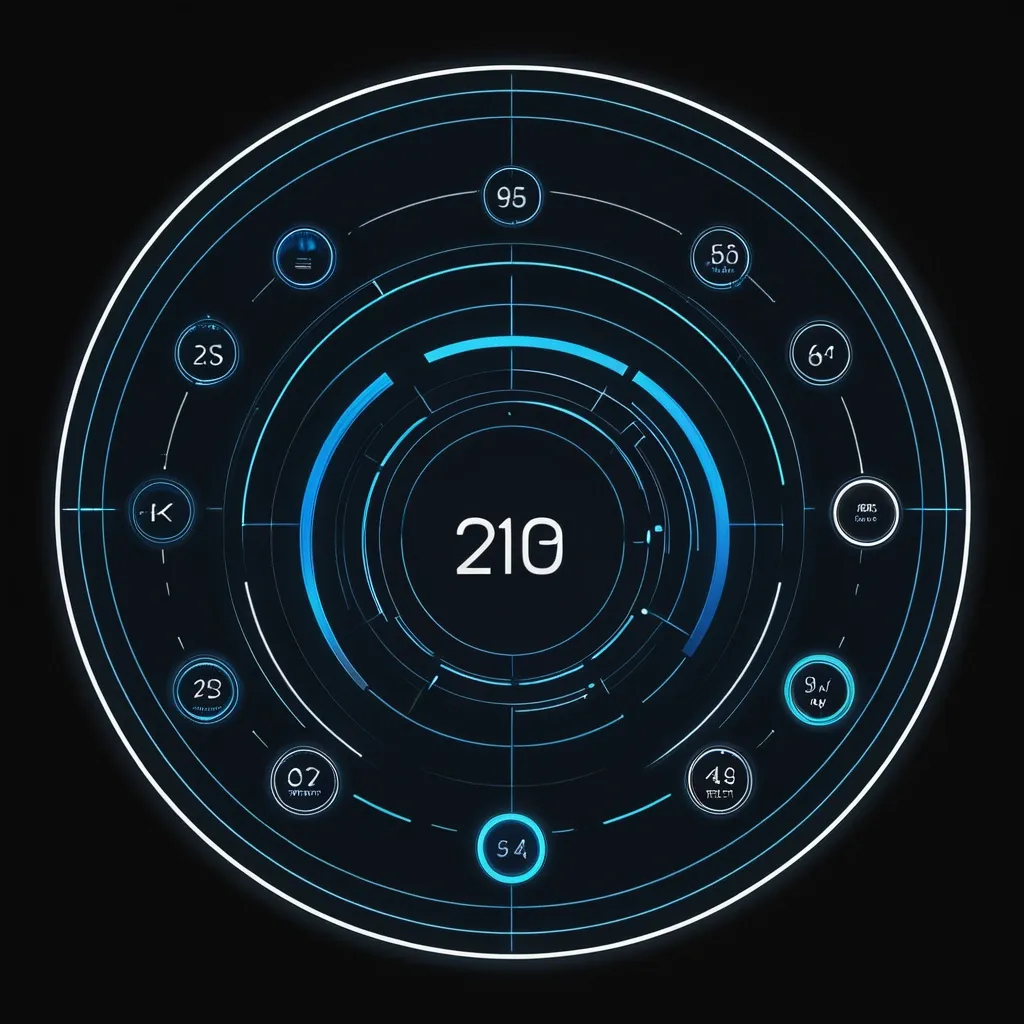
Perfectly round smartwatch face template , futuristic holographic UI , exact square canvas. Deep black background with glowing thin ice-blue and white lines. Clean minimalist circular layout. Featuring empty circular dials , blank progress rings , and empty minimalist frames reserved for UI widgets. Flat design , UI/UX dashboard , highly organized round grid. ZERO TEXT , ZERO NUMBERS , completely blank data fields. No typography. --ar 1:1 --no text , typography , numbers , digits , words ,
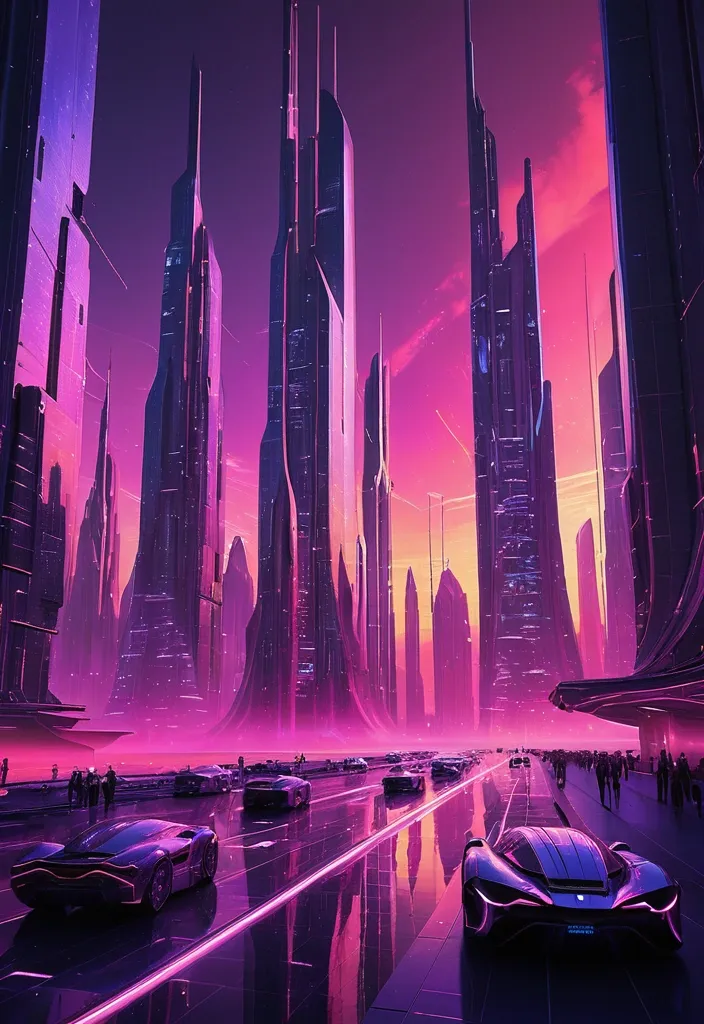
A breathtaking piece of futuristic concept art depicting a sprawling , high-tech megalopolis at the peak of a synthwave twilight. The architecture consists of soaring , needle-like skyscrapers crafted from brushed chrome and iridescent carbon fiber , their organic , aerodynamic curves piercing a vivid sky. Between these monoliths , sleek , teardrop-shaped vehicles glide through invisible aerial conduits , leaving elongated streaks of neon light in their wake. The city's facades are transformed into living canvases by colossal , transparent OLED GUI interfaces embedded directly into the glass. These shimmering holographic overlays display intricate , real-time data visualizations: flowing golden heat maps of urban traffic , rotating 3D weather systems in translucent cerulean , and cascading streams of binary data that pulse with a soft inner light. The color palette is intensely saturated and vibrant; the horizon is a brilliant explosion of warm magenta , deep amethyst , and electric coral , casting a glowing , atmospheric haze over the entire cityscape. The light reflects off the polished surfaces of the buildings , creating a mirrored world of pinks and purples. The perspective is a cinematic wide shot , emphasizing the overwhelming scale and verticality of the environment , evoking a sense of profound awe and a glimpse into a polished , utopian future. ,
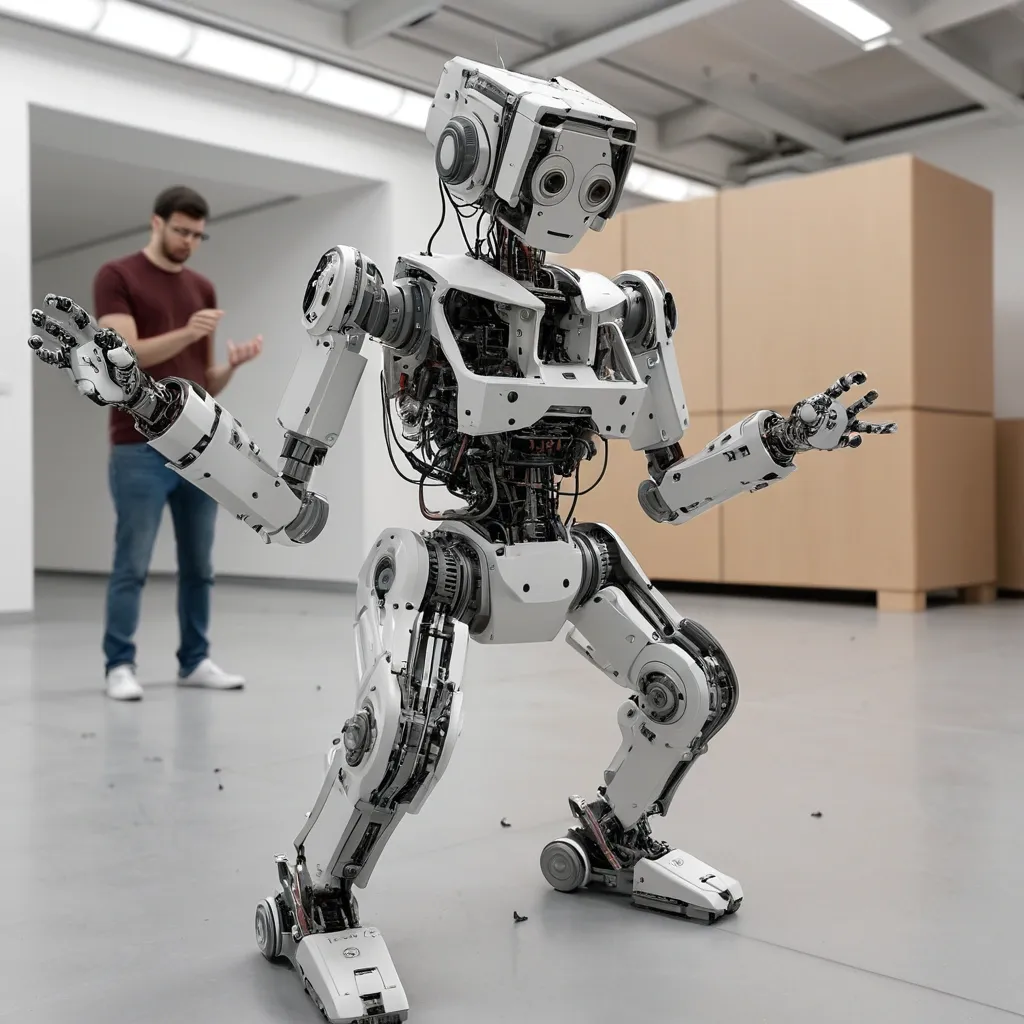
Vision-Language-Action (VLA) models have emerged as a promising paradigm for robot learning , but their representations are still largely inherited from static image-text pretraining , leaving physical dynamics to be learned from comparatively limited action data. Generative video models , by contrast , encode rich spatiotemporal structure and implicit physics , making them a compelling foundation for robotic manipulation. But their potentials are not fully explored in the literature. To bridge the gap , we introduce DiT4DiT , an end-to-end Video-Action Model that couples a video Diffusion Transformer with an action Diffusion Transformer in a unified cascaded framework. Instead of relying on reconstructed future frames , DiT4DiT extracts intermediate denoising features from the video generation process and uses them as temporally grounded conditions for action prediction. We further propose a dual flow-matching objective with decoupled timesteps and noise scales for video prediction , hidden-state extraction , and action inference , enabling coherent joint training of both modules. ,
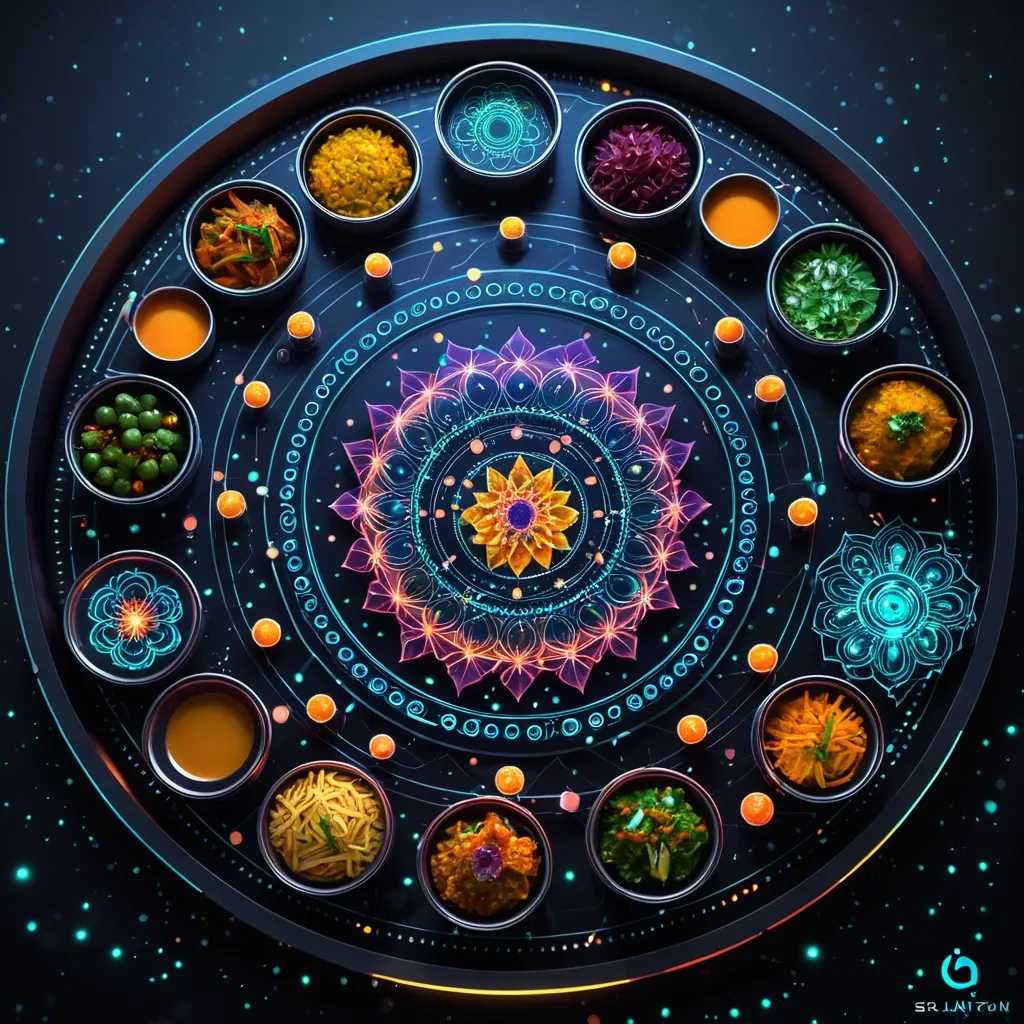
A vibrant molecular Gujarati Thali presented as a glowing , intricate hologram UI floating in a dark , futuristic laboratory. Tiny edible spheres and gels shimmer with internal light , arranged in complex geometric patterns. The UI elements pulse with soft energy , displaying intricate data streams related to the food's composition like Dal Chaval , Subji rotti , Papad. Style inspired by sci-fi concept art and digital painting , with a focus on luminous detail and clean , sharp lines. ,
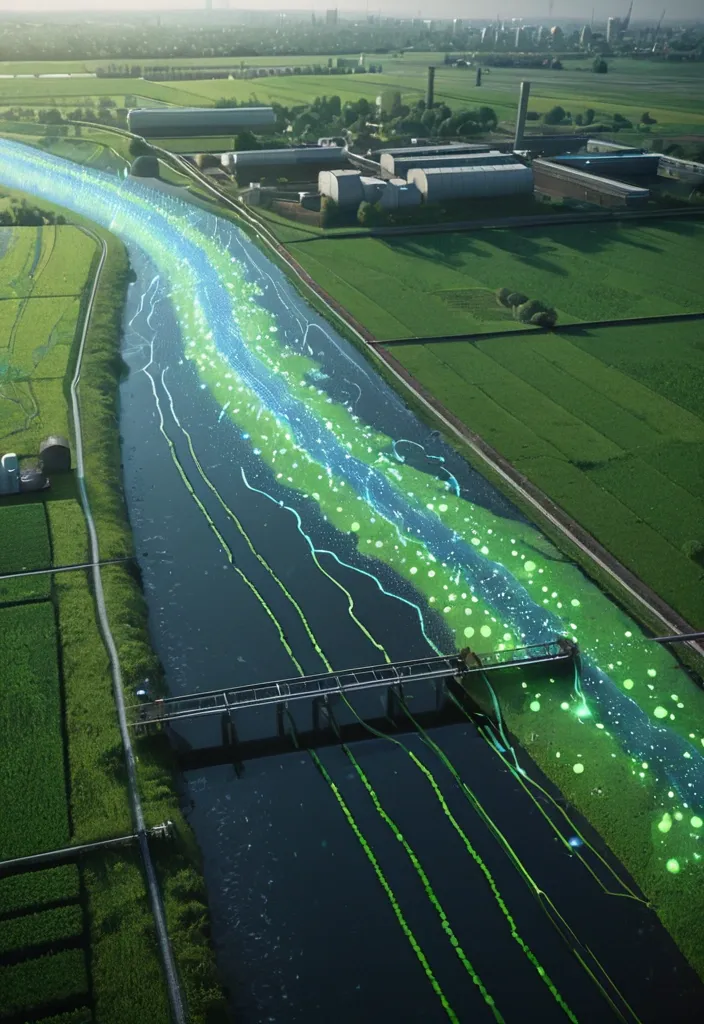
A detailed fluorescent green-dotted 3D horizontally hologram map on earth with Earth’s Ecosystems details , blue-labels and red-data (No text) overlays around him. The image is captured as a hyper-detailed cinematic film still , with sharp focus on the guardian and a soft bokeh effect on the background , emphasizing the magical threshold. A semi-realistic illustration of micro-pollutants' journey through the Earth’s Ecosystems , divided into three connected scenes: Agriculture (leftside in face shape): Fields with crops , a tractor spraying pesticides. Visible droplets seeping into the soil , contaminating groundwater (show wavy lines or faint glowing dots representing pollutants moving underground toward a river. Urban (center in face shape): A wastewater treatment plant discharging effluent into a river (use pipes with flowing water). Subtle glowing dots (micropollutants) remain in the discharged water. Factories or houses in the background. Water Treatment (rightside in face shape): A high-tech facility with reactors (UV/ozone tanks , bubbling systems) purifying water. Show scientists checking monitors (no text on screens) and clean water exiting the plant. ,

A singularly high-angled shot. A singularly close-up to the tiger. An extremely low-angled view shot is unprecedentedly bright and naturally vibrant. The high resolution and fine details are reminiscent of an electron microscope with sharpened very clearly and strongly. A vast forest rendered in utopian beauty begins to glitch like corrupted data—trees fragment into low-poly wire-frames , rivers freeze into digital circuits. Rendered in hyper-fidelity hybrid glitch realism. ,
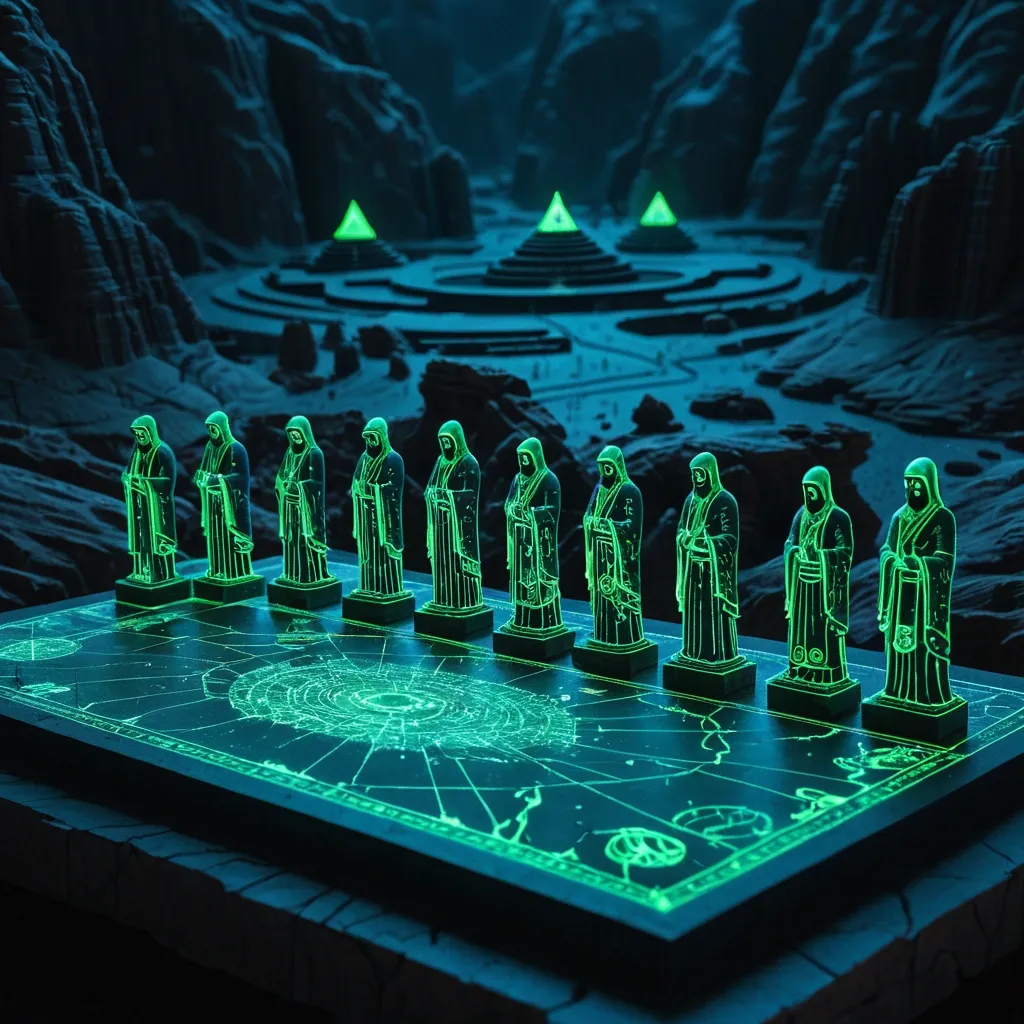
A group of enigmatic , hooded figures , covered with ancient tattoos , their blurry face are fluorescent black no facial features , etched in ether ink and forgotten runes , gather around a detailed fluorescent green-dotted 3d miniature diorama of Narmada valley lying on a surface , with the Statue of Unity is the world's tallest statue , located at bank of Narmada river as focal point , condensed into a tiny tabletop world with technical schematics in red , It should have icon of tall statue icon somewhere in map , labels and data overlays vortex around him. Behind them stretches a vast , deep night desert with bioluminescent caves. The image is captured as a hyper-detailed cinematic film still , with sharp focus on the guardian and a soft bokeh effect on the background , Rendered in Octane , rich detailing --ar 16:9 --raw --stylize 200 ,
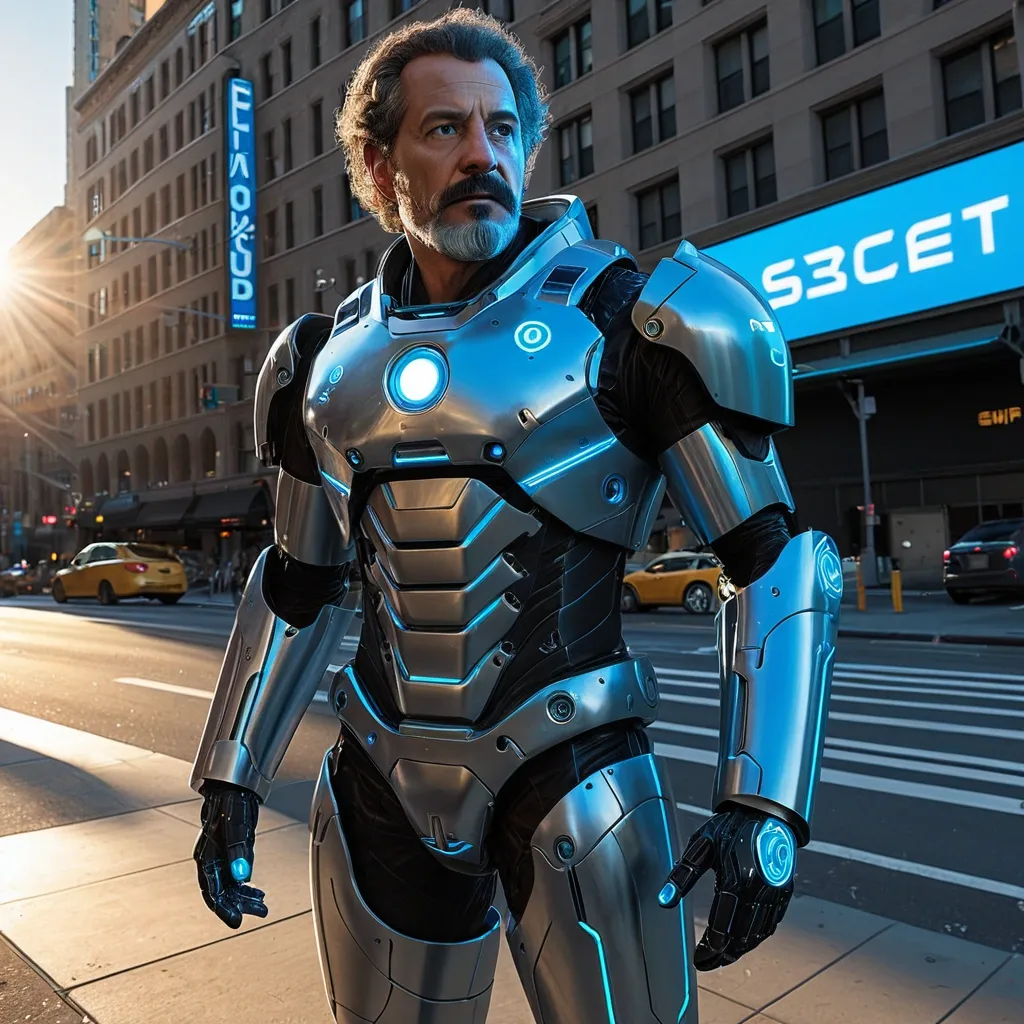
Transform the provided reference photo into a dense urban street scene , golden hour warm sunlight , clear sky , Every advertising surface belongs to SpaceX — building facade wraps , rooftop signs , full bus and taxi wraps , subway entrance tunnels , LED screens , street furniture , crosswalk markings , scaffolding hoardings. Preserve the landscape exactly as it is , with one hundred percent expressions , and natural details. Do not alter , enhance , beautify , or modify any physical characteristics. insert into portrait a hauntingly man in a realistic manner. He is wearing a life-size holographic armored exosuit beside him with curly white mustache , detailed blue hologram UI with technical schematics , labels and data overlays floating around him , advanced AR interface , sci-fi technology concept , warm indoor lighting mixed with cool neon blue glow from hologram , rich detailing --ar 9:16 --raw --stylize 200 ,
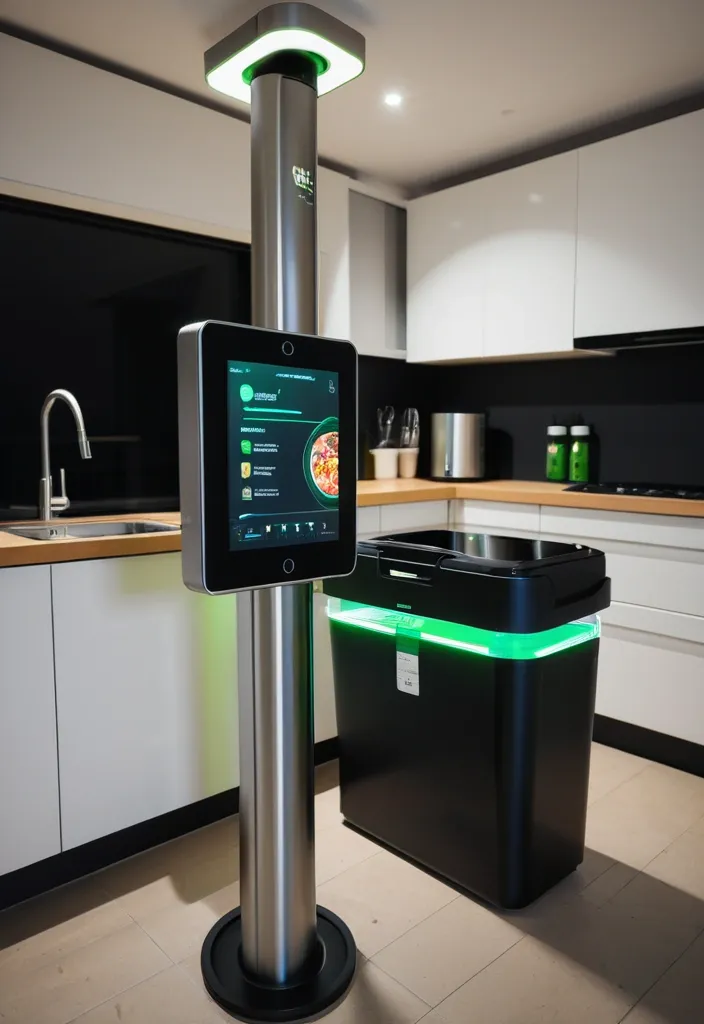
At night In a modern kitchen , at corner green trash bin stands prominently equipped with a sleek horizontally digital scanner mounted on a pole directly facing it. The scanner emits neon holographic monitoring data that showcases real-time food waste statistics and insights over the bin on screen. The kitchen surroundings are clean and bright , featuring contemporary appliances and vibrant decor. automates food waste tracking and gives you actionable insights to cut costs , reduce CO₂ , and boost efficiency - without changing how your kitchen works. ,
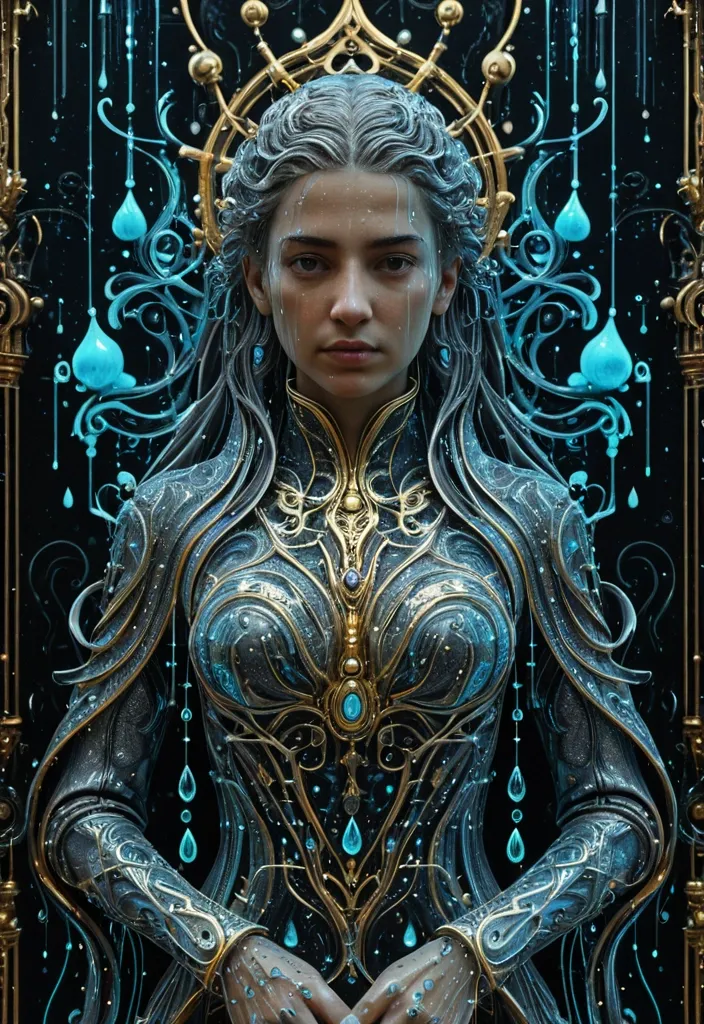
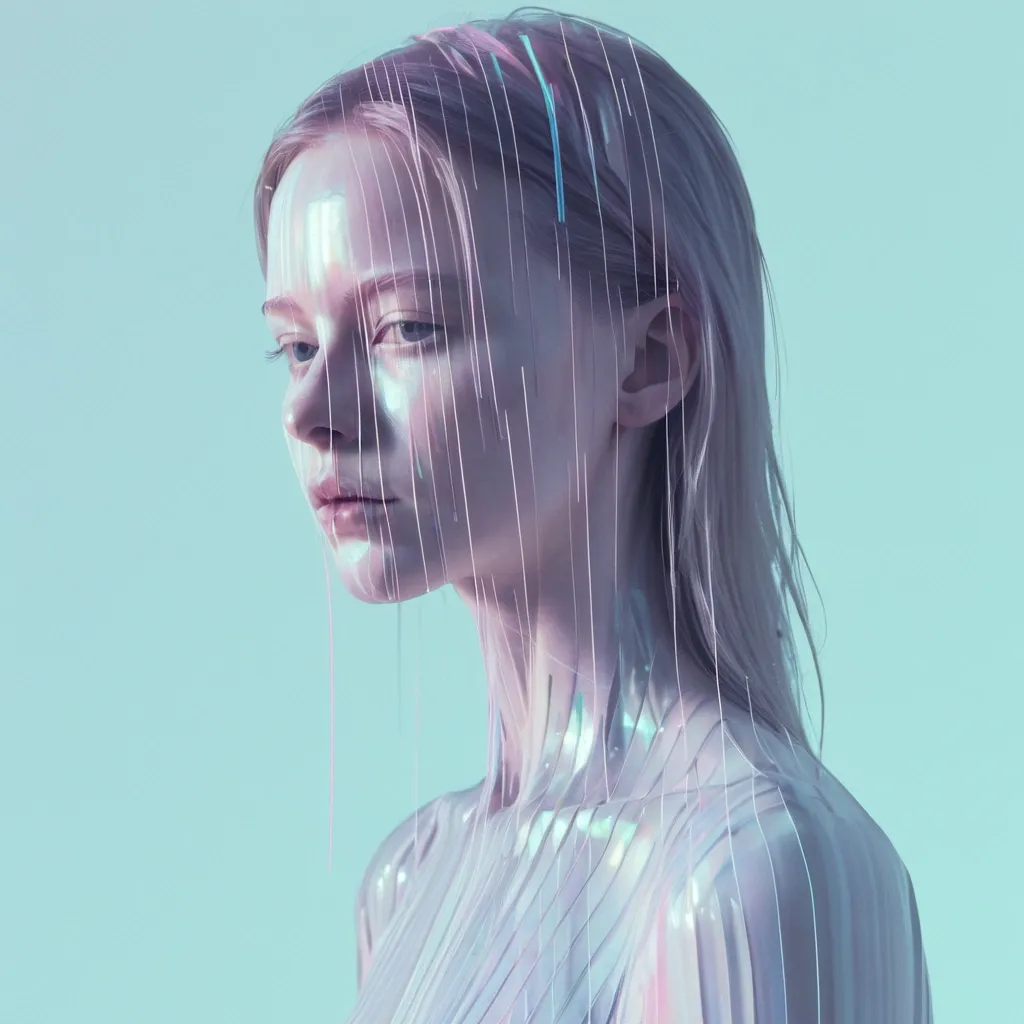
masterpiece) , (best quality) , ultra detailed , highly detailed , 8k resolution , sharp lineart , intricate hair strands , crisp details , perfect anatomy , detailed clothing , cinematic lighting , vibrant colors , rich textures , detailed background , A female sovereign draped in [anti-Soak-cide] raindrops—water that kills wetness , droplets that repel absorption while appearing liquid—each bead a [holo-Liquid-phase] holographic state-shift suspended between solid , fluid , and data. The entire composition viewed through a [hyper-Omni-rain-scope] field: an all-encompassing , hyper-influential atmospheric dominion where rain becomes omniscient observer. Rendered in deep-infographical-baroque style: ornate baroque flourishes interwoven with layered data-visualization geometry , calligraphic flow-charts as decorative filigree , cinematic sci-fi painting technique with volumetric ionized lighting , 8K resolution , palette of mercury-silver , ionized cyan , baroque gold-leaf accents , and deep void-black negative space. ,
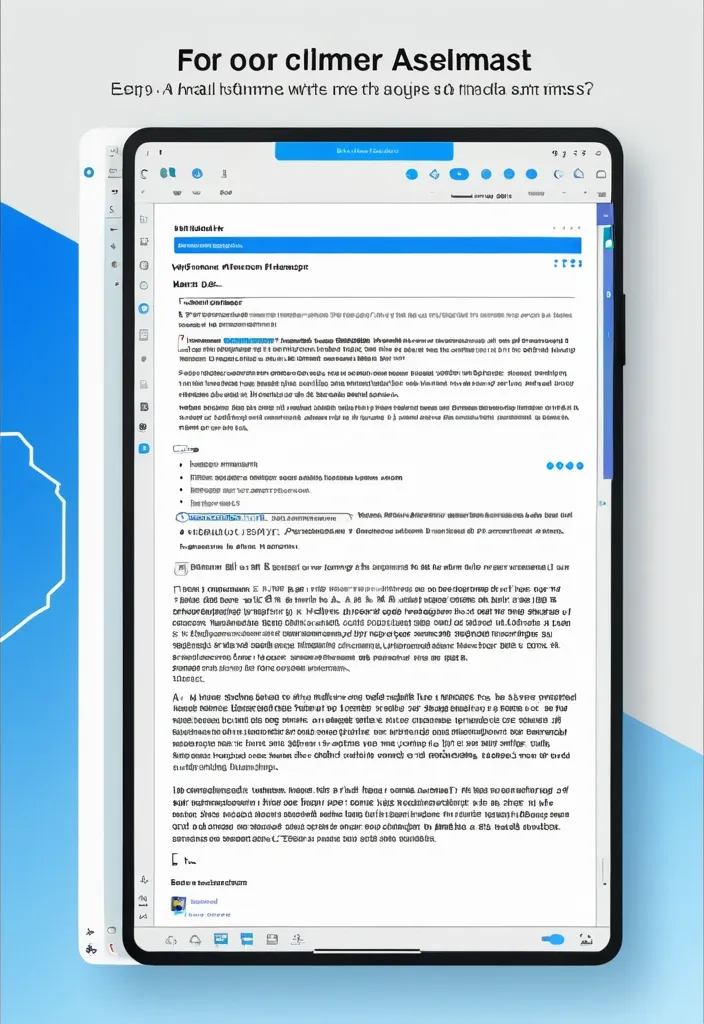
Modern SaaS hero image for an AI Document Assistant page at . Show a realistic browser window displaying the FlexFiles AI Document Assistant interface. Include a chat panel where the AI summarizes a PDF and answers questions. Visible document preview on the side with highlighted text. Toolbar showing options like summarize , translate , extract data , explain content. Clean white interface with blue accent colors. Subtle gradient background. Floating PDF and AI icons around the screen. Professional , trustworthy , minimal UI design. High resolution , 16:9 aspect ratio. ,
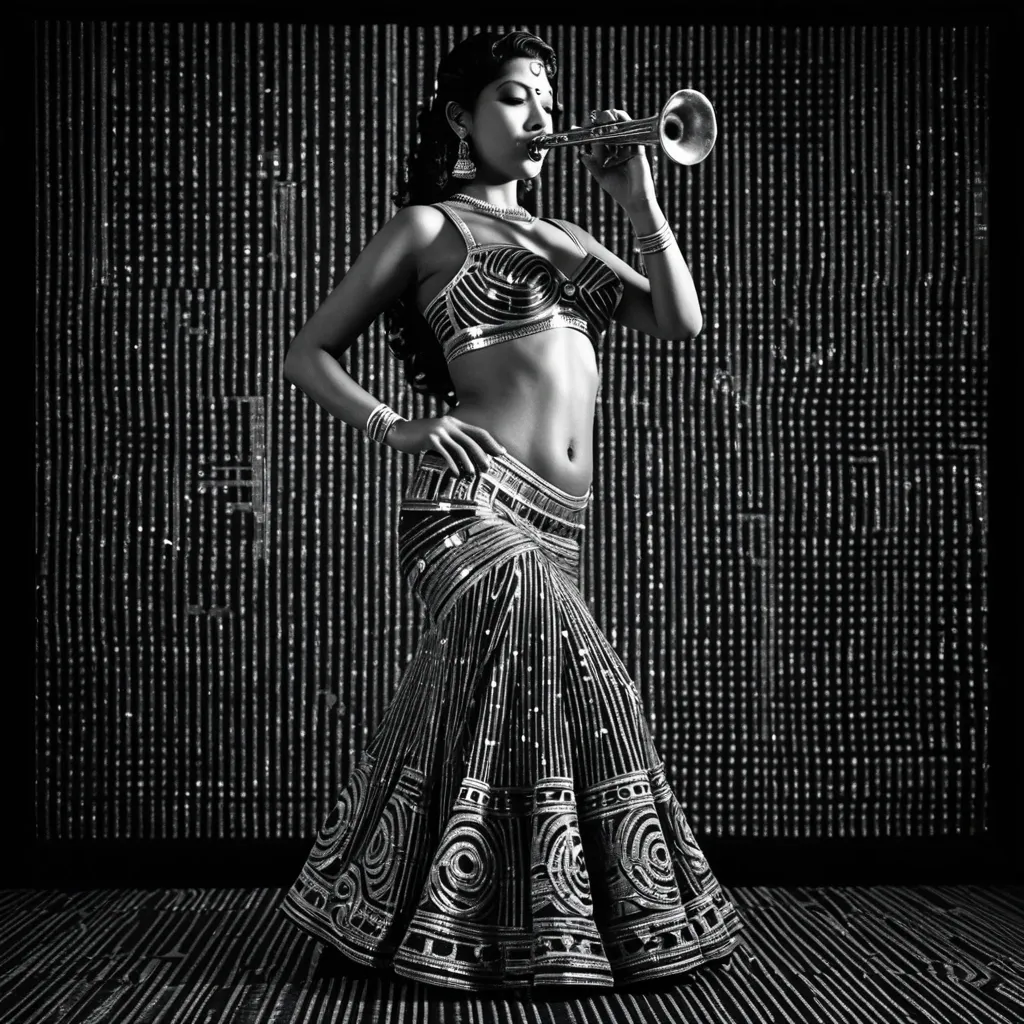
A Aztec style , horizontal scan lines and digital interference , vertical full body of a sensual pin-up jazz singer , playing Trumpet , wearing Sequin Embroidery Semi-Stitched Lehenga Choli , embodying the irresistible allure of classic film noir and vintage Hollywood glamour , fantasy , horizontally distorted figure with scan line interference pattern , soft diffused lighting , corrupted data aesthetic with noise texture and horizontal artifacts ,
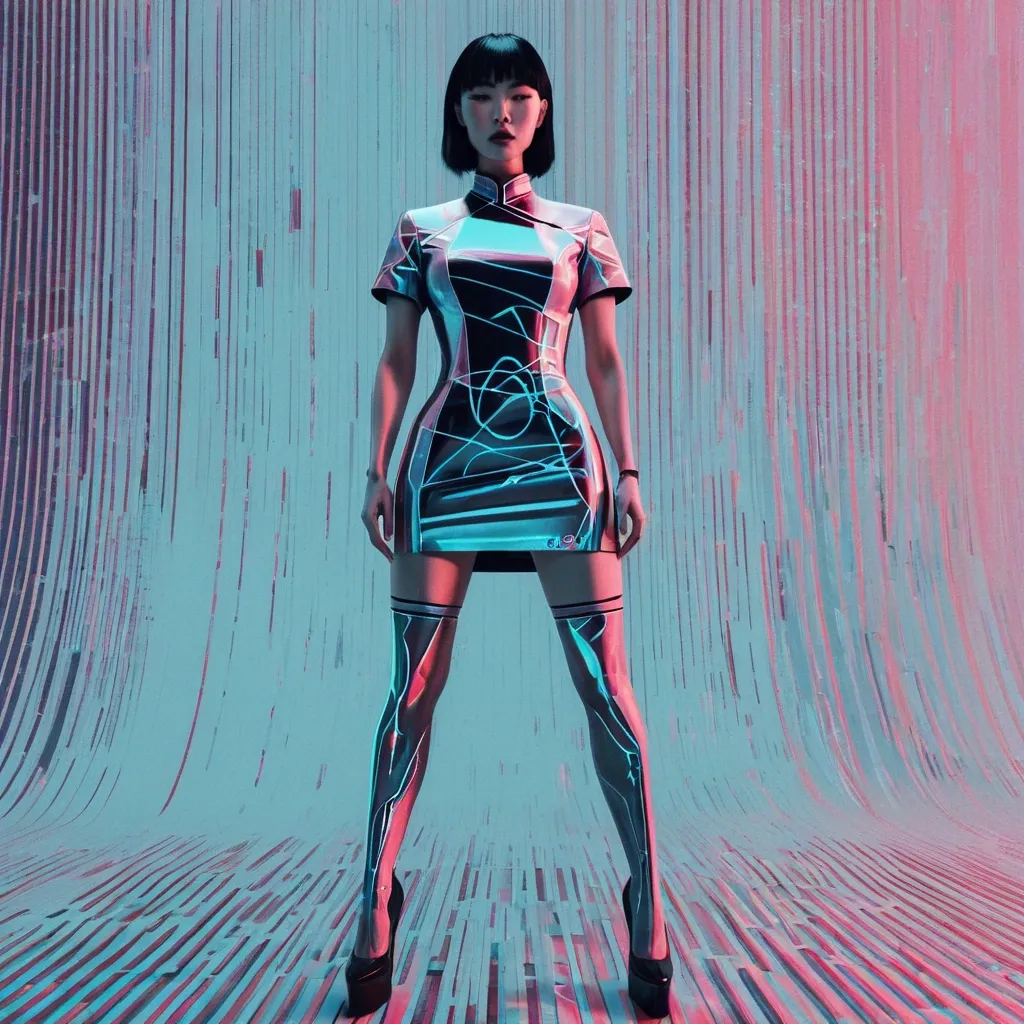
glitch portrait , minimalistic of cheongsam girl. modern cheongsam style , realistic proportions. pop designed Logo Marked "No Rules , Just Punk". dynamic angle perspective , extreme foreshortening , epic pose dramatic perspective. full body , clearly defined edges , clean minimal aesthetic , vertical digital distortion and fragmented interference patterns overlaying figure , pixelation , randomized vertical glitch artifacts , data corruption aesthetic , softly diffused ambient lighting , pastel hues accentuating glitches , high-definition digital noise texture --ar 9:16 --raw --stylize 300 ,
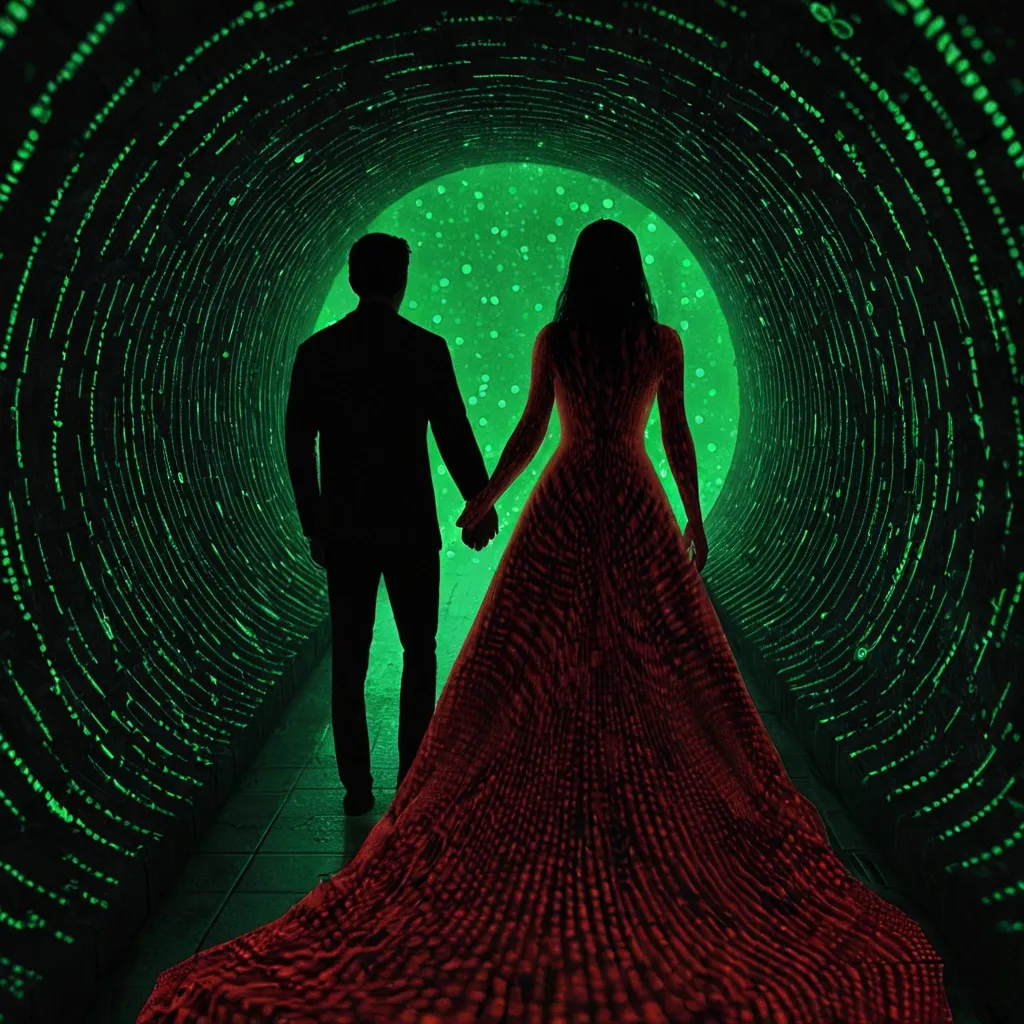
horizontal scan dots and digital interference , microscopic marvels of a woman in a resplendent , yet deep v cut red long dress , shares a romantic meeting with a mythical beasts speaks as a lovers , minimal night underground tunnel background , horizontally distorted monster walking with scan green dot interference pattern , soft diffused lighting , corrupted data aesthetic with noise texture and horizontal artifacts ,
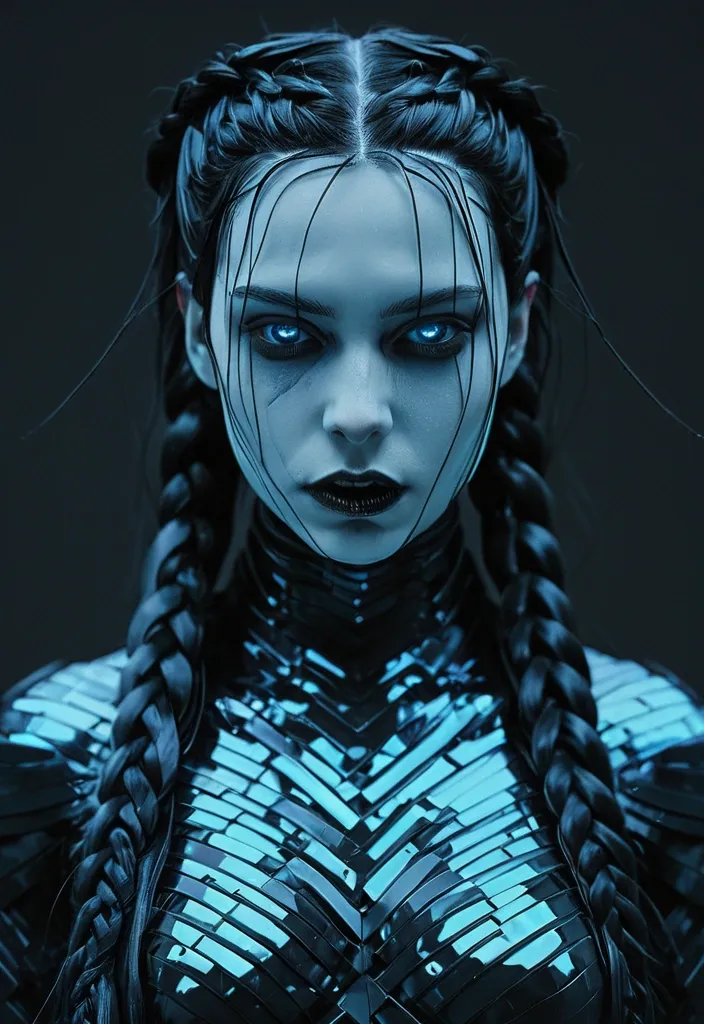
A hyper-detailed portrait of a female vampire figure , pale blue iridescent skin , monochromatic black , jet black hair in thick braids , subtle glitch art interference , data-mosh textures on the shoulders , cold artificial lighting , deep blue shadows , minimalist futuristic tribalism , sharp focus on the eyes ,
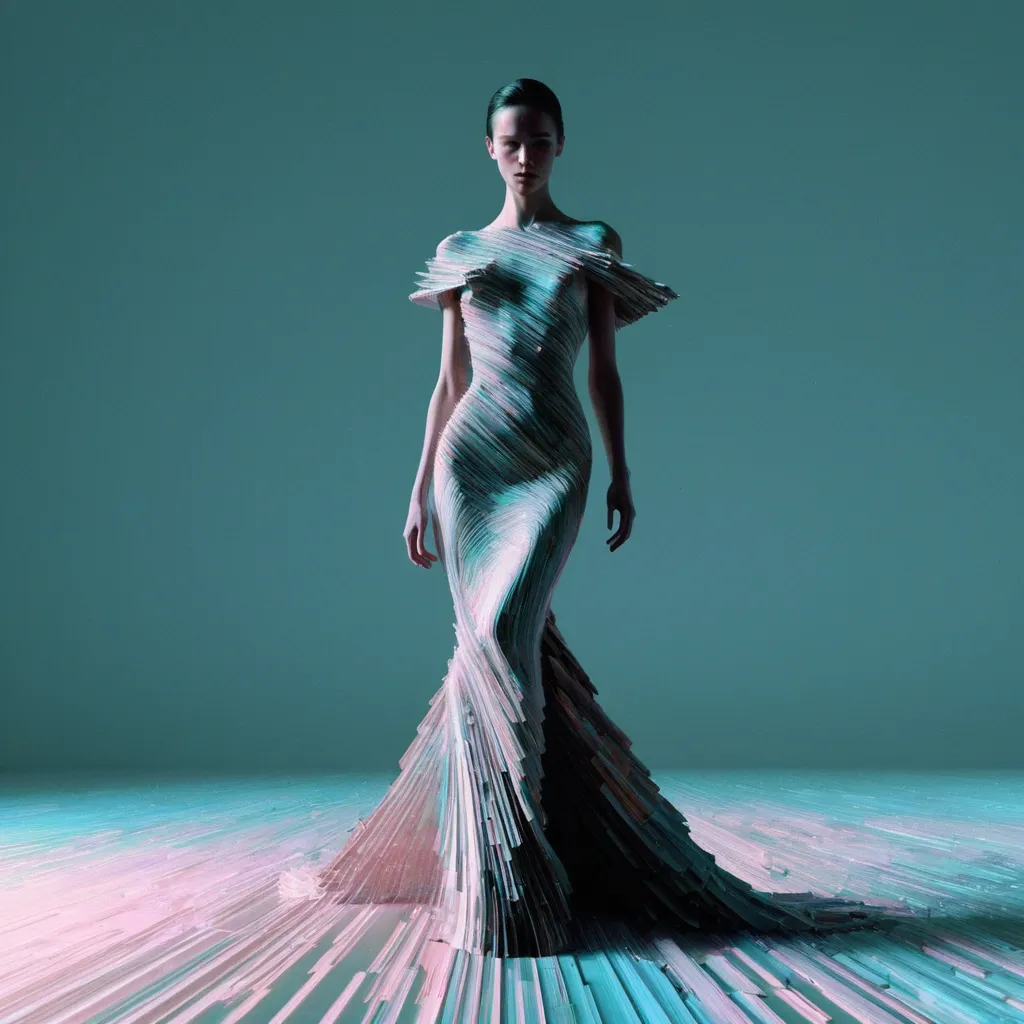
Professional photograph , full-length shot of glitch art , minimalistic of elegant woman striding forward in a dramatic , heavily textured haute couture gown , with a delicate presence silhouette , clearly defined edges , clean minimal aesthetic , vertical digital distortion and fragmented interference patterns overlaying figure , pixelation , randomized vertical glitch artifacts , data corruption aesthetic , softly diffused ambient lighting , pastel hues accentuating glitches , high-definition digital noise texture. ,
glitch portrait , minimalistic of Hyper-realistic pale female model with a delicate presence silhouette , clearly defined edges , clean minimal aesthetic , vertical digital distortion and fragmented interference patterns overlaying figure , pixelation , randomized vertical glitch artifacts , data corruption aesthetic , softly diffused ambient lighting , pastel hues accentuating glitches , high-definition digital noise texture ,
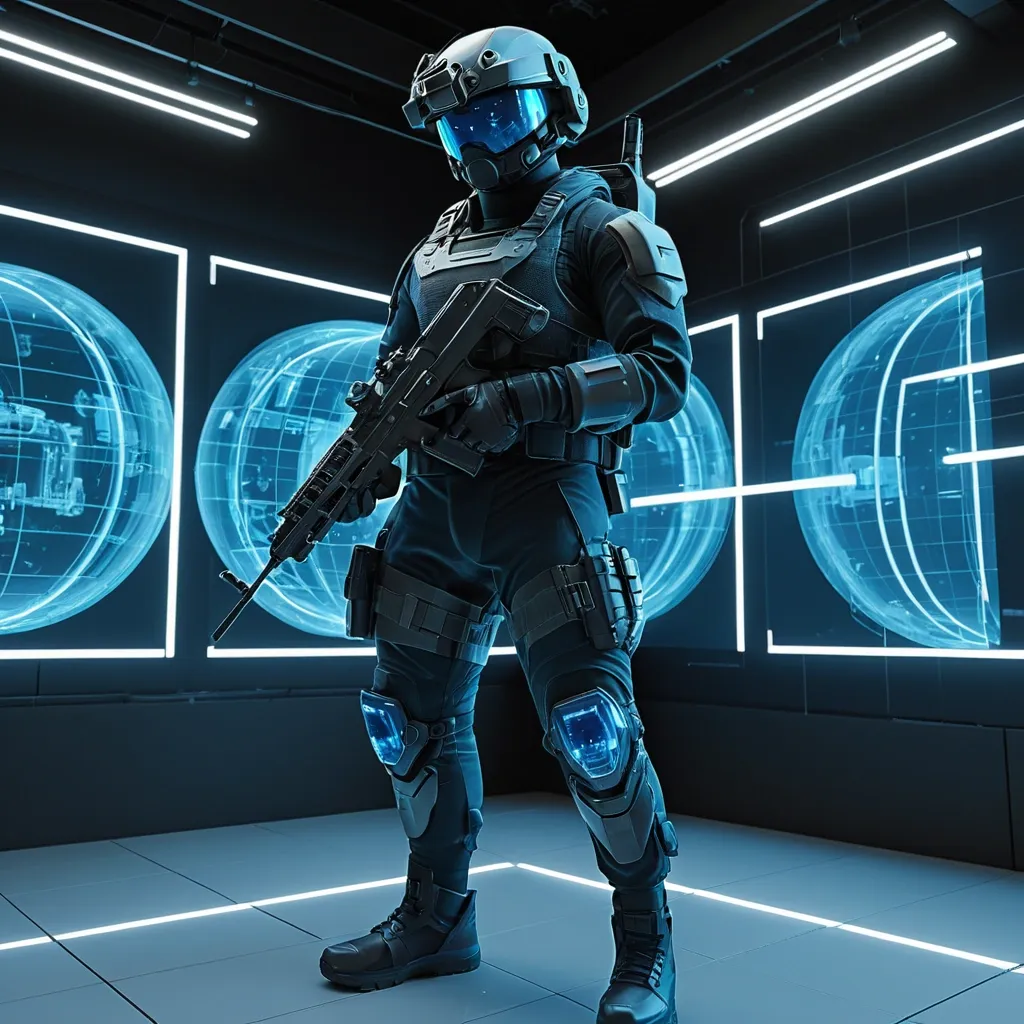
Generate a hyper-realistic 3D render of a modern (full body) soldier wearing an advanced AI-powered mixed-reality combat helmet named “SpaceX” The helmet glows with subtle holographic AR projections over the visor , displaying tactical data , drone feeds , and enemy positions in transparent blue overlays sliced into multiple horizontal layers , with each layer floating vertically in mid-air at slightly different heights. The subject should appear freshly , showcasing intricate cross-section details. Use soft , diffused smokes coming from the upper left to create subtle shadows beneath each layer while maintaining vibrant illumination on the surfaces. The background is Silicon Valley innovation. Employ a natural and juicy color palette that highlights the object’s freshness , with rich , saturated tones for the interior textures. Render in a highly detailed , photo-realistic style with precise focus on material properties. ,
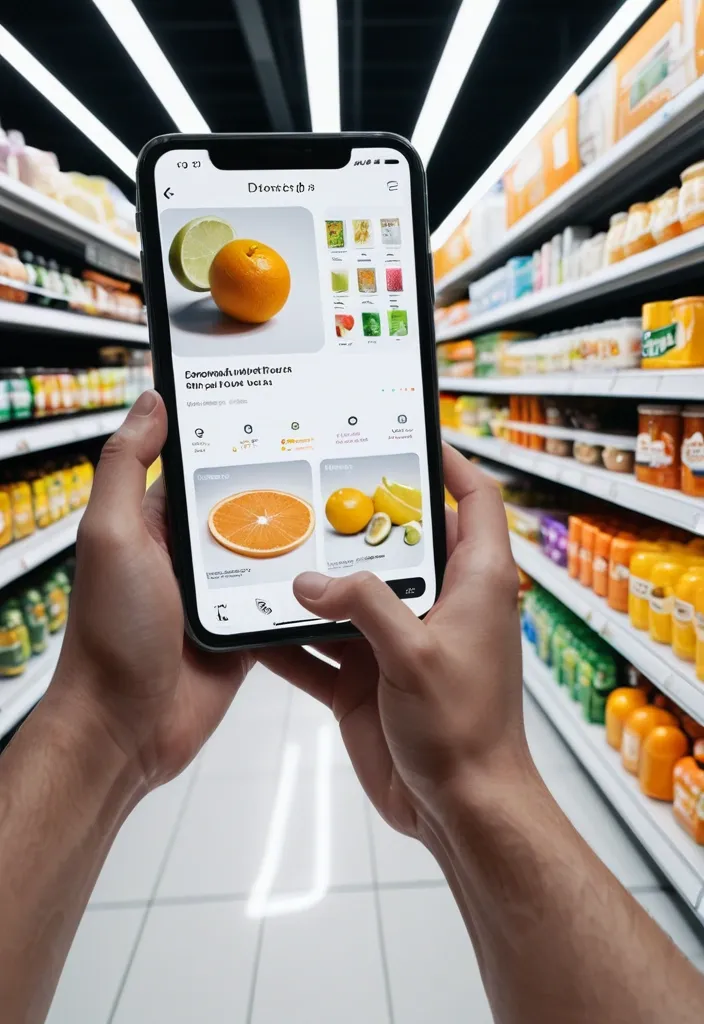
First-person perspective inside a brightly lit supermarket aisle or section. Realistic human hands are holding Limonia close to the camera. The product’s [key visual traits: color , texture , packaging , freshness details] are clearly visible under natural store lighting. The Limonia is surrounded by a multi-layered holographic augmented reality interface displaying relevant product information , including [nutritional or product data such as calories , protein/sugar/caffeine , vitamins , freshness indicator , origin , expiration date , usage or recipe suggestions]. The AR UI elements smoothly shift and reorganize based on the viewer’s gaze direction , as if dynamically responding to user focus. In the left peripheral vision , a vertical semi-transparent shopping list is visible with checked-off items , where Limonia is highlighted as the currently active selection. Hyper-realistic mixed reality , clean futuristic AR design , glass-like UI panels , soft ambient glow , realistic lighting and shadows , natural depth of field , immersive first-person interface , showcasing next-generation retail technology. ,
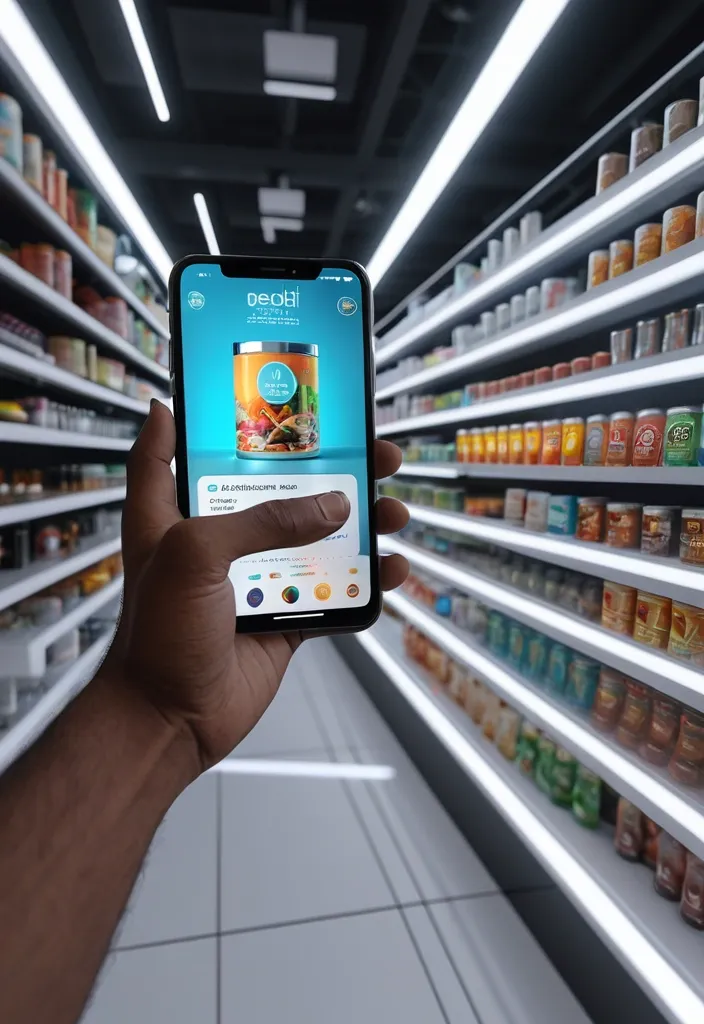
First-person perspective at a brightly lit beach aisle. Realistic human hands are holding a Desi Bidi of Indian smoking product to the camera. The vivid smoking product in its iconic branded Bidi is surrounded by a multi-layered holographic augmented reality interface displaying nutritional data , including calorie count , Tobeco content , caffeine level , freshness indicator , expiration date , and recommended refreshing ingredients and cocktails based on DESI. The UI elements smoothly shift and reorganize based on the viewer’s gaze direction , as if dynamically responding to user focus. In the left peripheral vision , a vertical semi-transparent shopping list is visible with checked-off items , where Desi is highlighted as the currently active selection. Hyper-realistic mixed reality , clean futuristic AR design , glass-like UI panels , soft ambient glow , realistic lighting and shadows , natural depth of field , immersive first-person interface , showcasing next-generation retail technology. ,
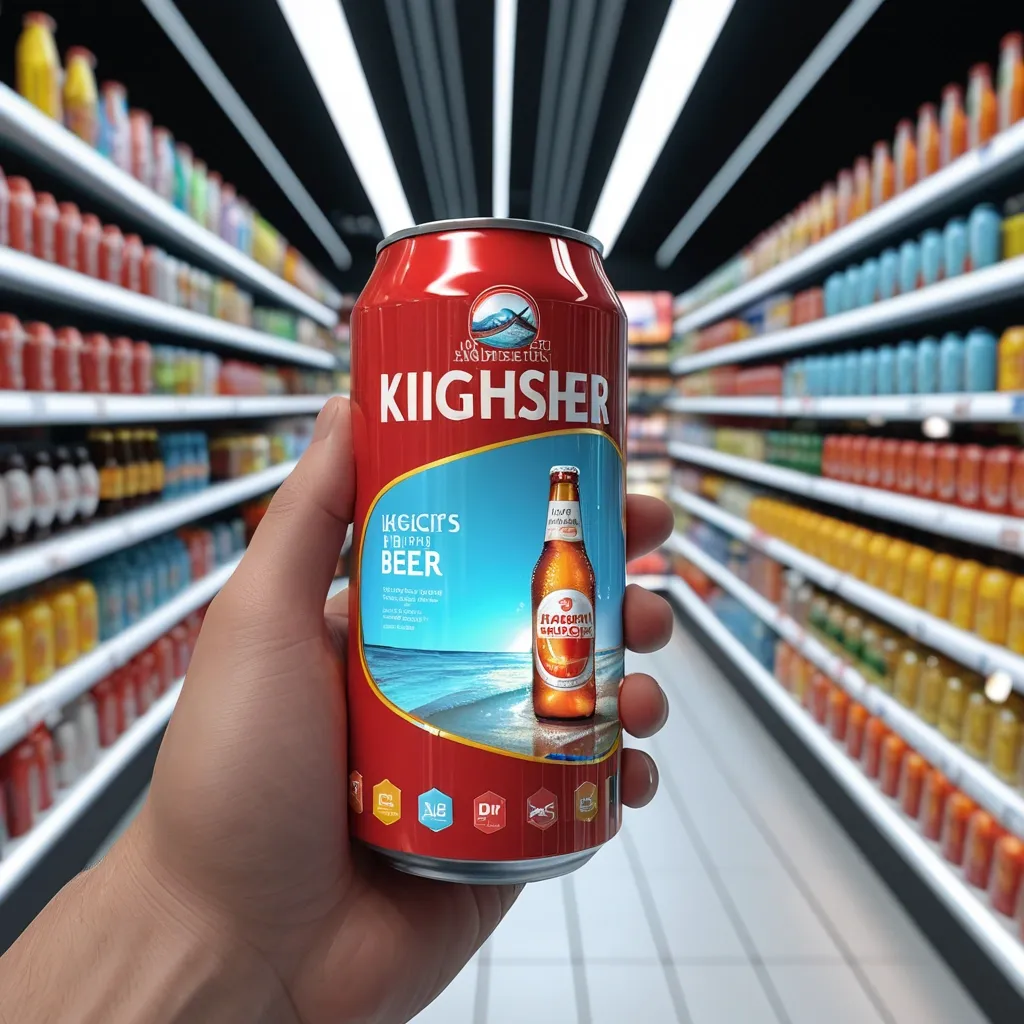
First-person perspective at a brightly lit beach aisle. Realistic human hands are holding a tin of kingfisher beer close to the camera. The vivid beer drink in its iconic branded red tin is surrounded by a multi-layered holographic augmented reality interface displaying nutritional data , including calorie count , alcohol content , caffeine level , freshness indicator , expiration date , and recommended refreshing recipes and cocktails based on Kingfisher. The UI elements smoothly shift and reorganize based on the viewer’s gaze direction , as if dynamically responding to user focus. In the left peripheral vision , a vertical semi-transparent shopping list is visible with checked-off items , where Kingfisher is highlighted as the currently active selection. Hyper-realistic mixed reality , clean futuristic AR design , glass-like UI panels , soft ambient glow , realistic lighting and shadows , natural depth of field , immersive first-person interface , showcasing next-generation retail technology. ,
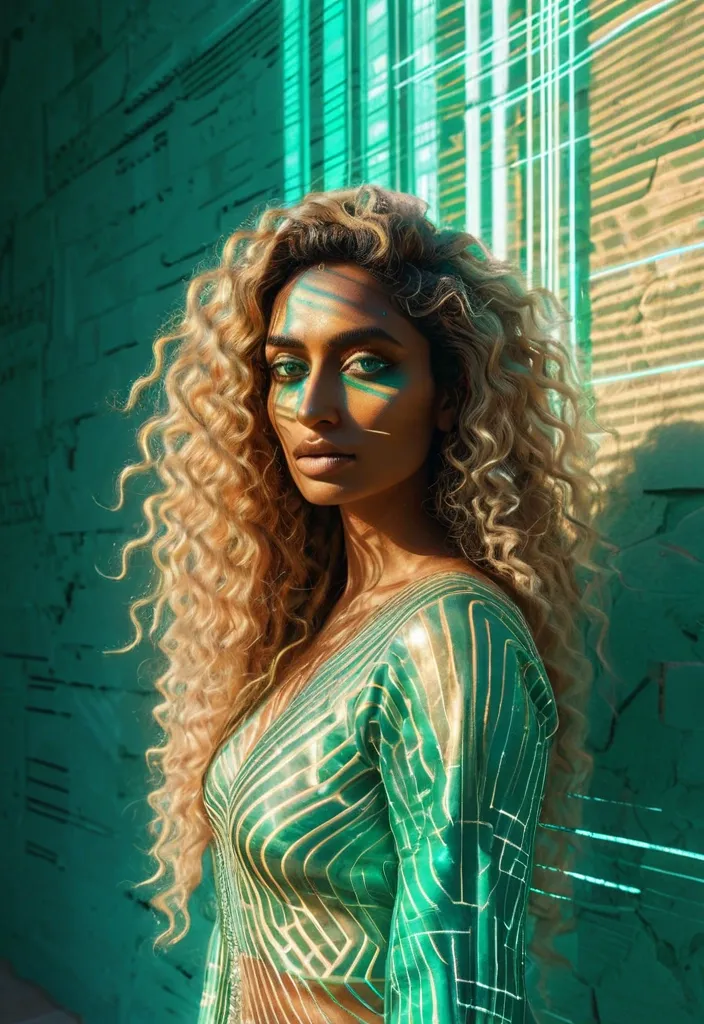
A full-height glitch art portrait of a rajasthani young woman with dusky skin and vibrant , curly honey-blonde hair. She has captivating emerald green , blue , silver , and gold eyes , gazing directly at the camera. The setting is a sun-drenched gap between a wall , clean minimal aesthetic , vertical digital distortion and fragmented interference patterns overlaying figure , corrupted pixelation , randomized vertical glitch artifacts , subtle data corruption aesthetic , softly diffused ambient lighting , gentle pastel hues accentuating glitches , ,
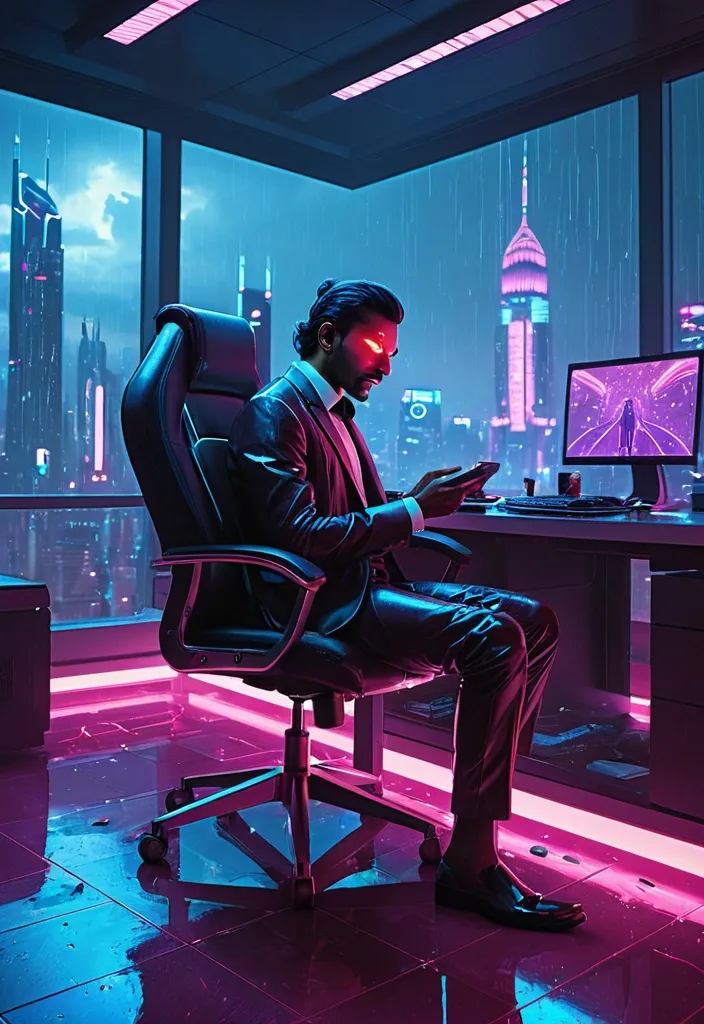
A cinematic wide shot in a hyper-realistic cyberpunk office high above a glowing neon metropolis. Indian man (from attached image) , wearing a tuxedo sits calmly in an ergonomic leather chair , talking on iPhone. In front of him , several translucent blue holographic Design Software interfaces like Photoshop , illustrator , CoralDrow , Canva , float in the air , flickering with data. Lying obediently at his feet is a massive , maroon hound with glowing red eyes; the heads move independently , sniffing the air and growling softly. The camera slowly pans around the desk , showing the rain streaking against the floor-to-ceiling windows and the vibrant pink and blue city lights reflecting off the polished floor. High-fidelity , 8k , detailed textures , ambient lighting , cinematic slow-motion. ,
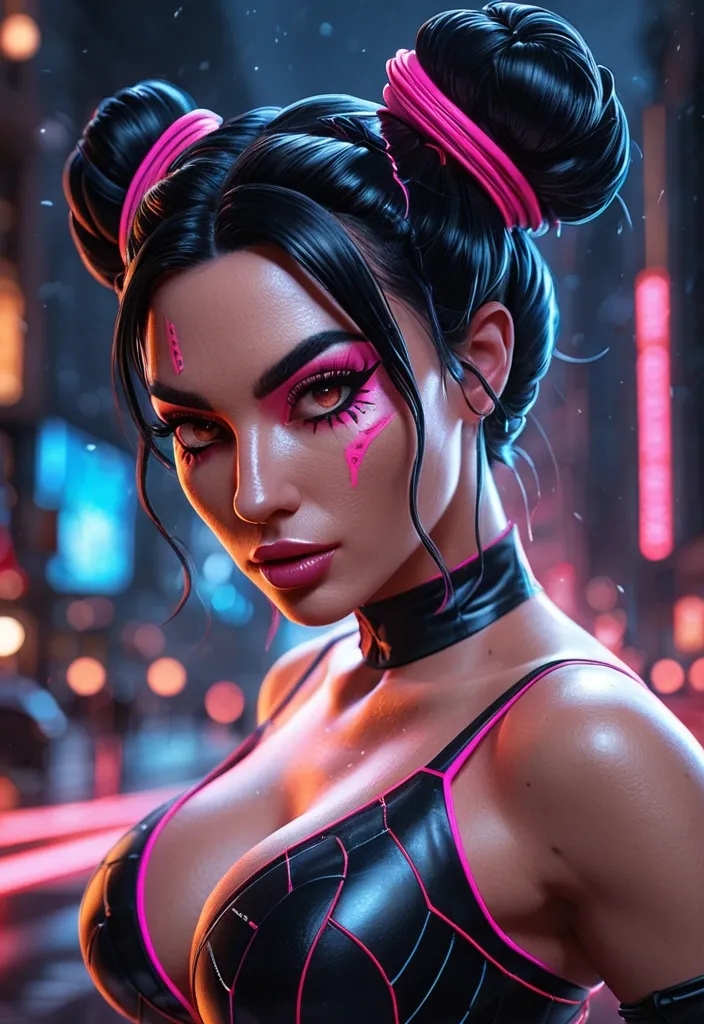
(masterpiece , best quality , absurdres , highres) , ultra-detailed , very aesthetic , amazing quality , sharp focus , UHD , 8k , skin texture , , high depth of field , warm lighting , ray tracing , best lighting , nighttime , outside , concept painting , digital art style , drawn aesthetic , ultrahigh definition , perfect quality , absolutely eye-catching , detailed illustration , detailed background , handscdata not found matic , dynamic pose , dynamic angle , dynamic position , dynamic background , dynamic details , dynamic action , random position , random details , random decorations , randome pose , extremely detailed , random background , 1 girl , female , feminine , black hair , with neon pink highlights , space buns , dark make up , black camisole , net gloves , heavy eyeliner , modern , close up , extreme close up , looking_at_viewer , DeepNegative_xl_v1 ,
Landing Page Hero Section Reimagined: Create a modern , immersive hero section featuring a dynamic holographic gradient background that subtly shifts between deep purple (#6B46C1) to electric blue (#3B82F6) to cyan (#06B6D4) , creating a futuristic AI-inspired atmosphere. The gradient should have a gentle animated flow (3-5 second loop) suggesting data streams or neural networks. Visual Elements & Depth: Add floating geometric shapes (translucent hexagons , nodes , and connection lines) that subtly parallax scroll , suggesting AI neural networks and automated systems Integrate a glassmorphism card overlaying the gradient for your main content area , with frosted glass effect (backdrop-filter: blur(12px) , white/10% opacity) to create sophisticated depth Replace the static photo with an AI-enhanced portrait that has subtle edge glow in accent colors (cyan/purple) and animated particle effects around the edges , suggesting tech proficiency Typography & Content: Use fluid , variable typography for the headline with a gradient text effect (purple to cyan) that responds to cursor proximity with subtle scale animations Add a pricing transparency badge in the top right ("Competitive Rates - Premium Quality") with a subtle pulse animation in your accent color Include micro-animations on hover for navigation items—subtle underline draws with gradient effect Color Palette: Primary gradient: Deep Purple (#6B46C1) → Electric Blue (#3B82F6) → Cyan (#06B6D4) Accent: Warm Orange (#F97316) for CTAs to create powerful contrast and confidence Background: Rich dark (#0A0A0F) with subtle noise texture for depth Text: White (#FFFFFF) with reduced opacity variations for hierarchy Interactive Elements: Transform "Hire me" button into a premium CTA with orange gradient background , white text , and animated hover state (expands slightly , adds glow effect) Add scroll-triggered animations revealing a "Tech Stack" section with floating tech icons (TypeScript , React , Node.js , AI tools) that fade in with stagger effect Include a "Built with AI Assistance" badge with robot icon and subtle animation to showcase your AI-forward approach Unique Differentiators: Animated code snippets running in the background (subtle , low opacity) showing TypeScript/functional programming patterns Interactive pricing calculator widget that slides in from the side , demonstrating transparency and reasonable rates "Precision Meter" visualization—an animated circular progress indicator showing "99.9% Attention to Detail" with gradient stroke AI Assistant chatbot icon (bottom right) with pulsing gradient glow suggesting immediate , automated responses Additional Sections: Add a "Why Choose Me" grid with hover cards that reveal detailed benefits—each card lifts with shadow and gradient border on hover Include client testimonials with star ratings and subtle fade-in animations emphasizing quality and detail Feature a "Process" timeline with AI integration points highlighted , showing how you leverage AI for better results ,