Search Results for Data visualization
Explore AI generated designs, images, art and prompts by top community artists and designers.

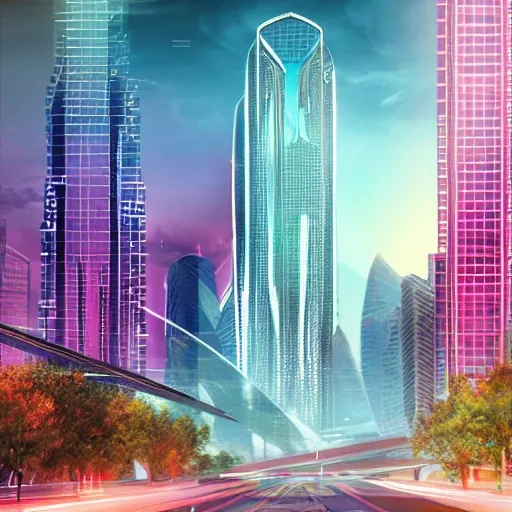
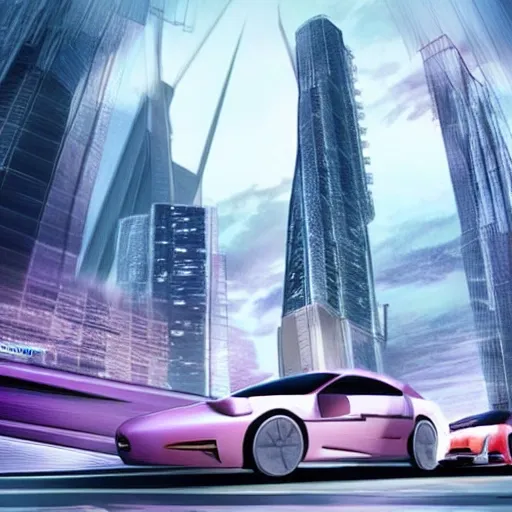
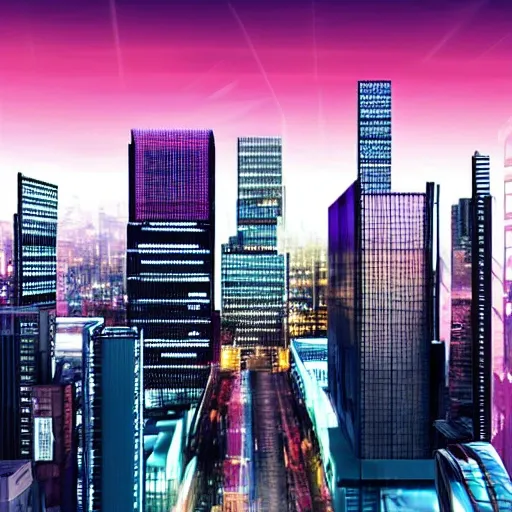
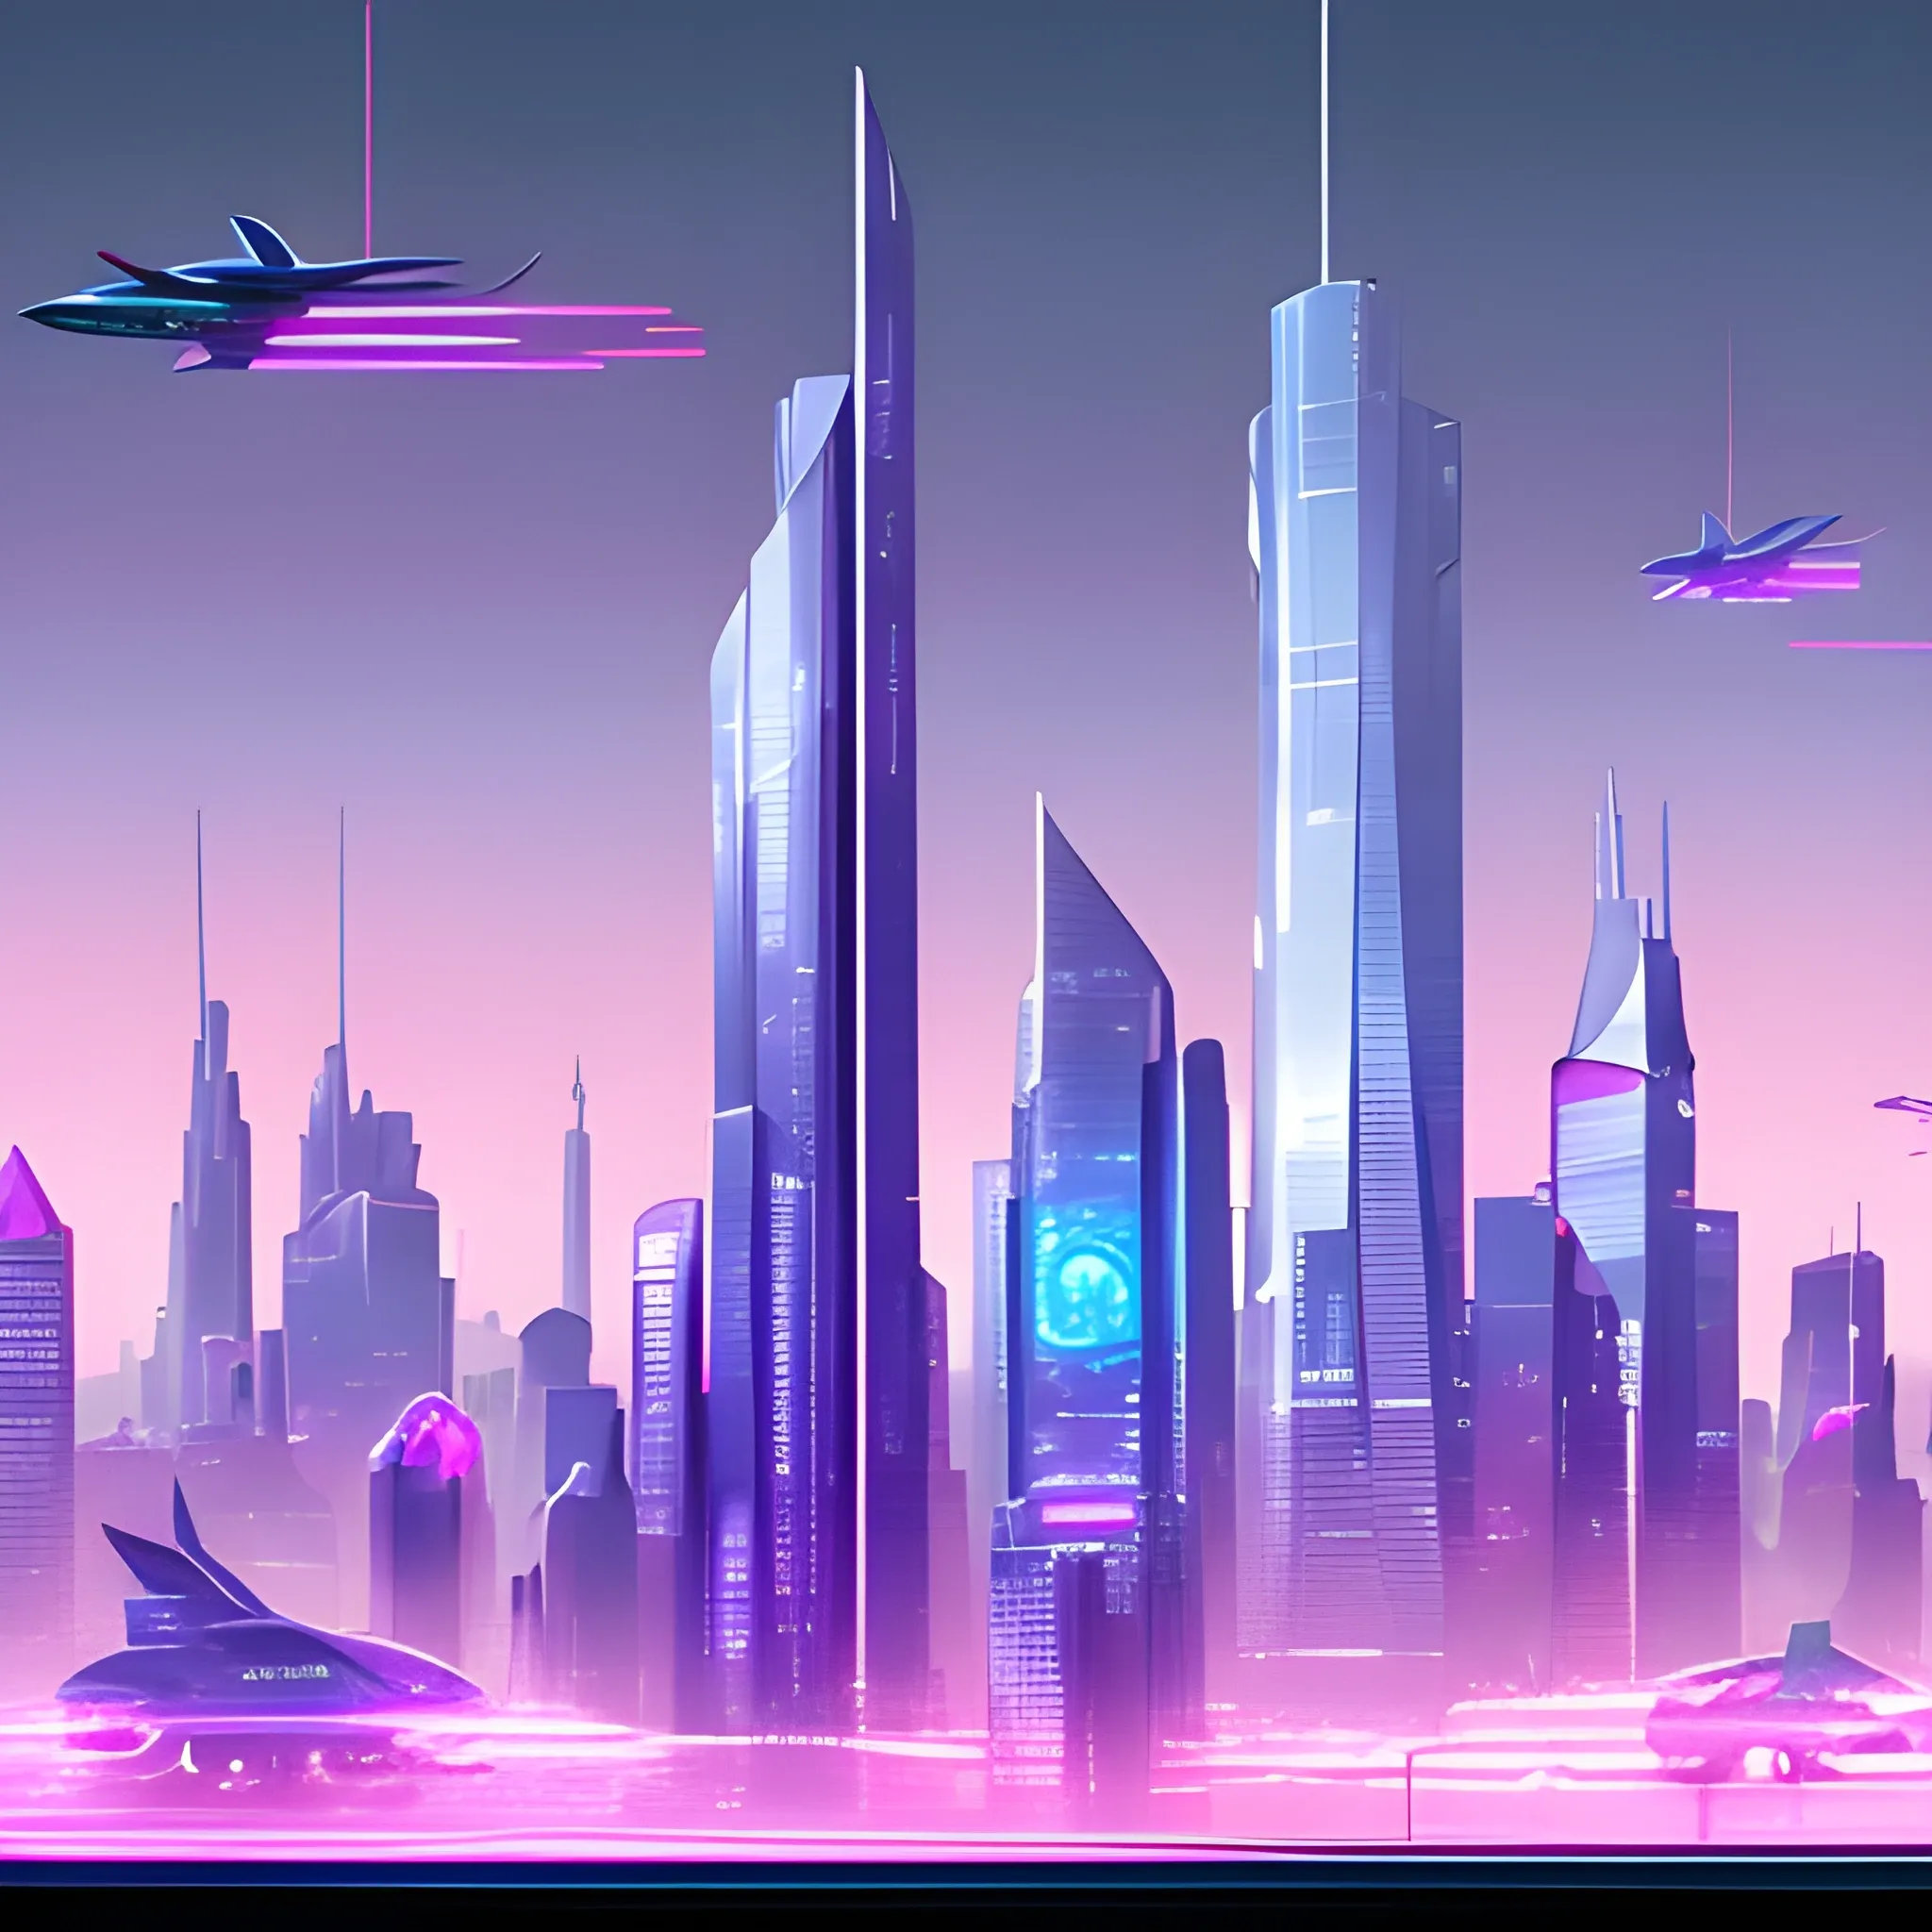
Style: Concept Art. Scene: A futuristic cityscape , with towering skyscrapers and sleek , aerodynamic vehicles speeding through the air. The high-resolution OLED GUI interface displays in the windows of the buildings are filled with transparent data visualization infographics , displaying everything from weather patterns to traffic flow. The colors are saturated and vibrant , with warm pinks and purples dominating the skyline. The overall effect is both beautiful and awe-inspiring. ,
A breathtaking piece of futuristic concept art depicting a sprawling , high-tech megalopolis at the peak of a synthwave twilight. The architecture consists of soaring , needle-like skyscrapers crafted from brushed chrome and iridescent carbon fiber , their organic , aerodynamic curves piercing a vivid sky. Between these monoliths , sleek , teardrop-shaped vehicles glide through invisible aerial conduits , leaving elongated streaks of neon light in their wake. The city's facades are transformed into living canvases by colossal , transparent OLED GUI interfaces embedded directly into the glass. These shimmering holographic overlays display intricate , real-time data visualizations: flowing golden heat maps of urban traffic , rotating 3D weather systems in translucent cerulean , and cascading streams of binary data that pulse with a soft inner light. The color palette is intensely saturated and vibrant; the horizon is a brilliant explosion of warm magenta , deep amethyst , and electric coral , casting a glowing , atmospheric haze over the entire cityscape. The light reflects off the polished surfaces of the buildings , creating a mirrored world of pinks and purples. The perspective is a cinematic wide shot , emphasizing the overwhelming scale and verticality of the environment , evoking a sense of profound awe and a glimpse into a polished , utopian future. ,
Ultimate Sanctions Infographic Prompt Style: "Geopolitical editorial illustration blended with data visualization , in the style of The Economist meets protest art – sophisticated yet confrontational" Core Elements: Title Treatment "GLOBAL SANCTIONS vs RUSSIA (2023-2024)" in fractured bold font (like "Bebas Neue" with cracks) Subtitle: "Economic Countermeasures to the Ukraine Invasion" in white on red ribbon Structural Layout 5 interconnected hexagons (honeycomb pattern) representing sanction categories Flowing red "impact waves" radiating from a stylized Russian map outline Category Visuals (per section) FINANCE: 3D golden vault with "$300B" padlock Falling SWIFT logo shattering like glass TECH TRADE: Broken semiconductor wafer forming stop sign Airbus/Boeing parts with "BANNED" stamps ELITE TARGETS: Flat-design oligarch portraits with red "X" overlays Pixelating superyacht sinking into money waves Data Highlights Animated-style percentage badges: "90%" (EU oil reduction) burning like fuel "$60" (price cap) as barrel-shaped neon sign Mini-timeline showing sanction escalation phases Technical Parameters: Resolution: 8K (7680x4320 for print/presentation) Color Profile: CMYK for professional printing Layers: Separate text/background layers (for easy editing) Format Options: ,
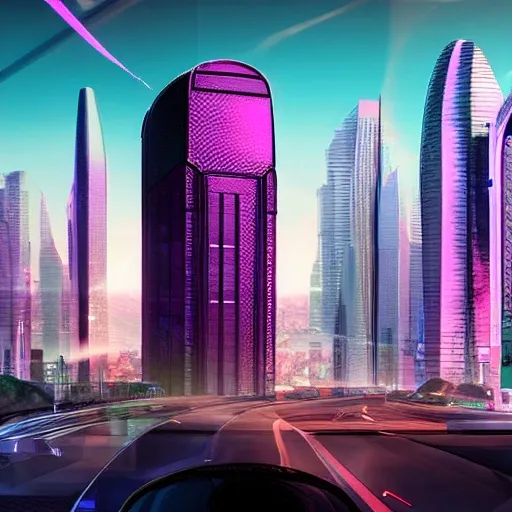
Style: Concept Art. Scene: A futuristic cityscape , with towering skyscrapers and sleek , aerodynamic vehicles speeding through the air. The high-resolution OLED GUI interface displays in the windows of the buildings are filled with transparent data visualization infographics , displaying everything from weather patterns to traffic flow. The colors are saturated and vibrant , with warm pinks and purples dominating the skyline. The overall effect is both beautiful and awe-inspiring. ,
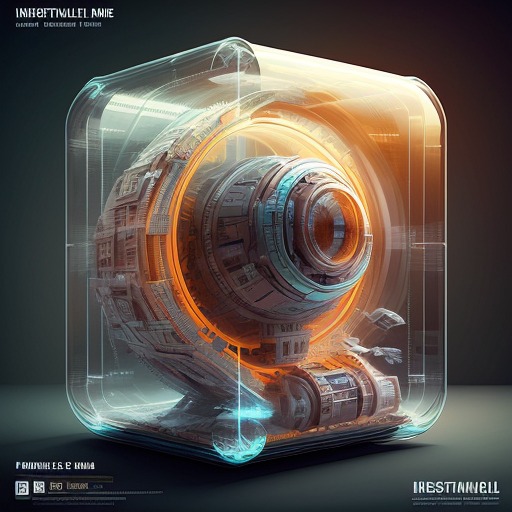

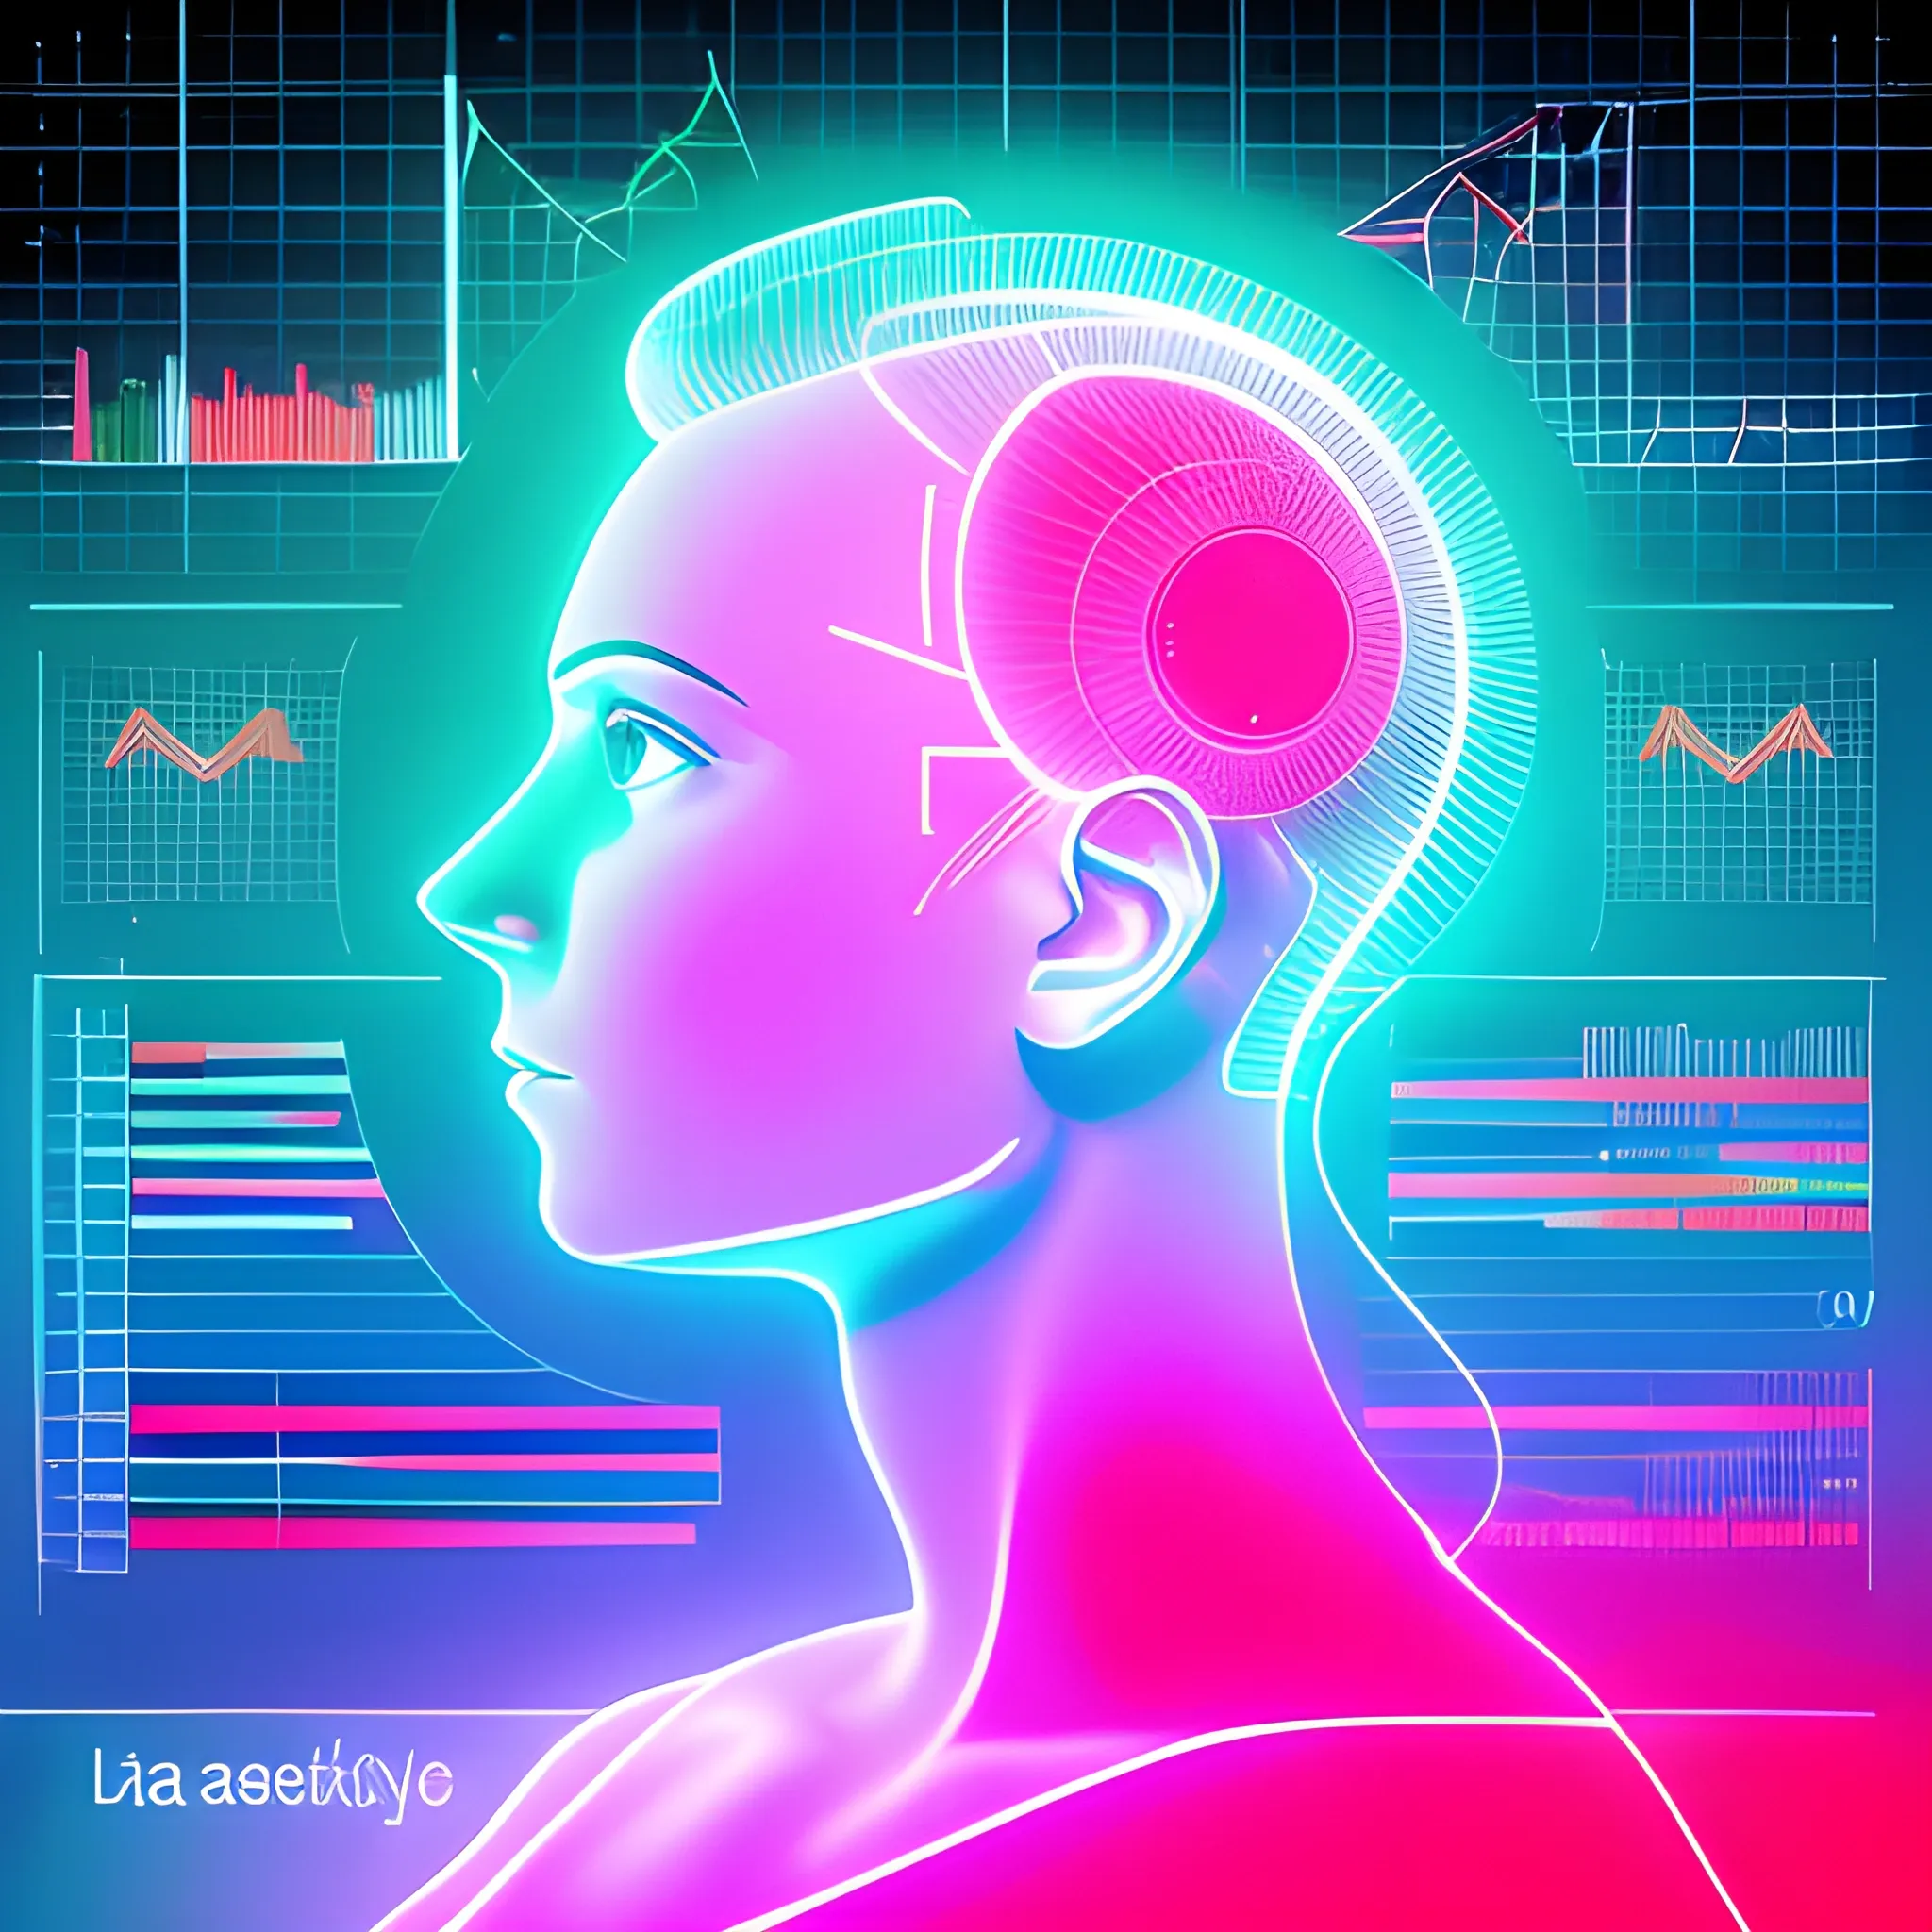
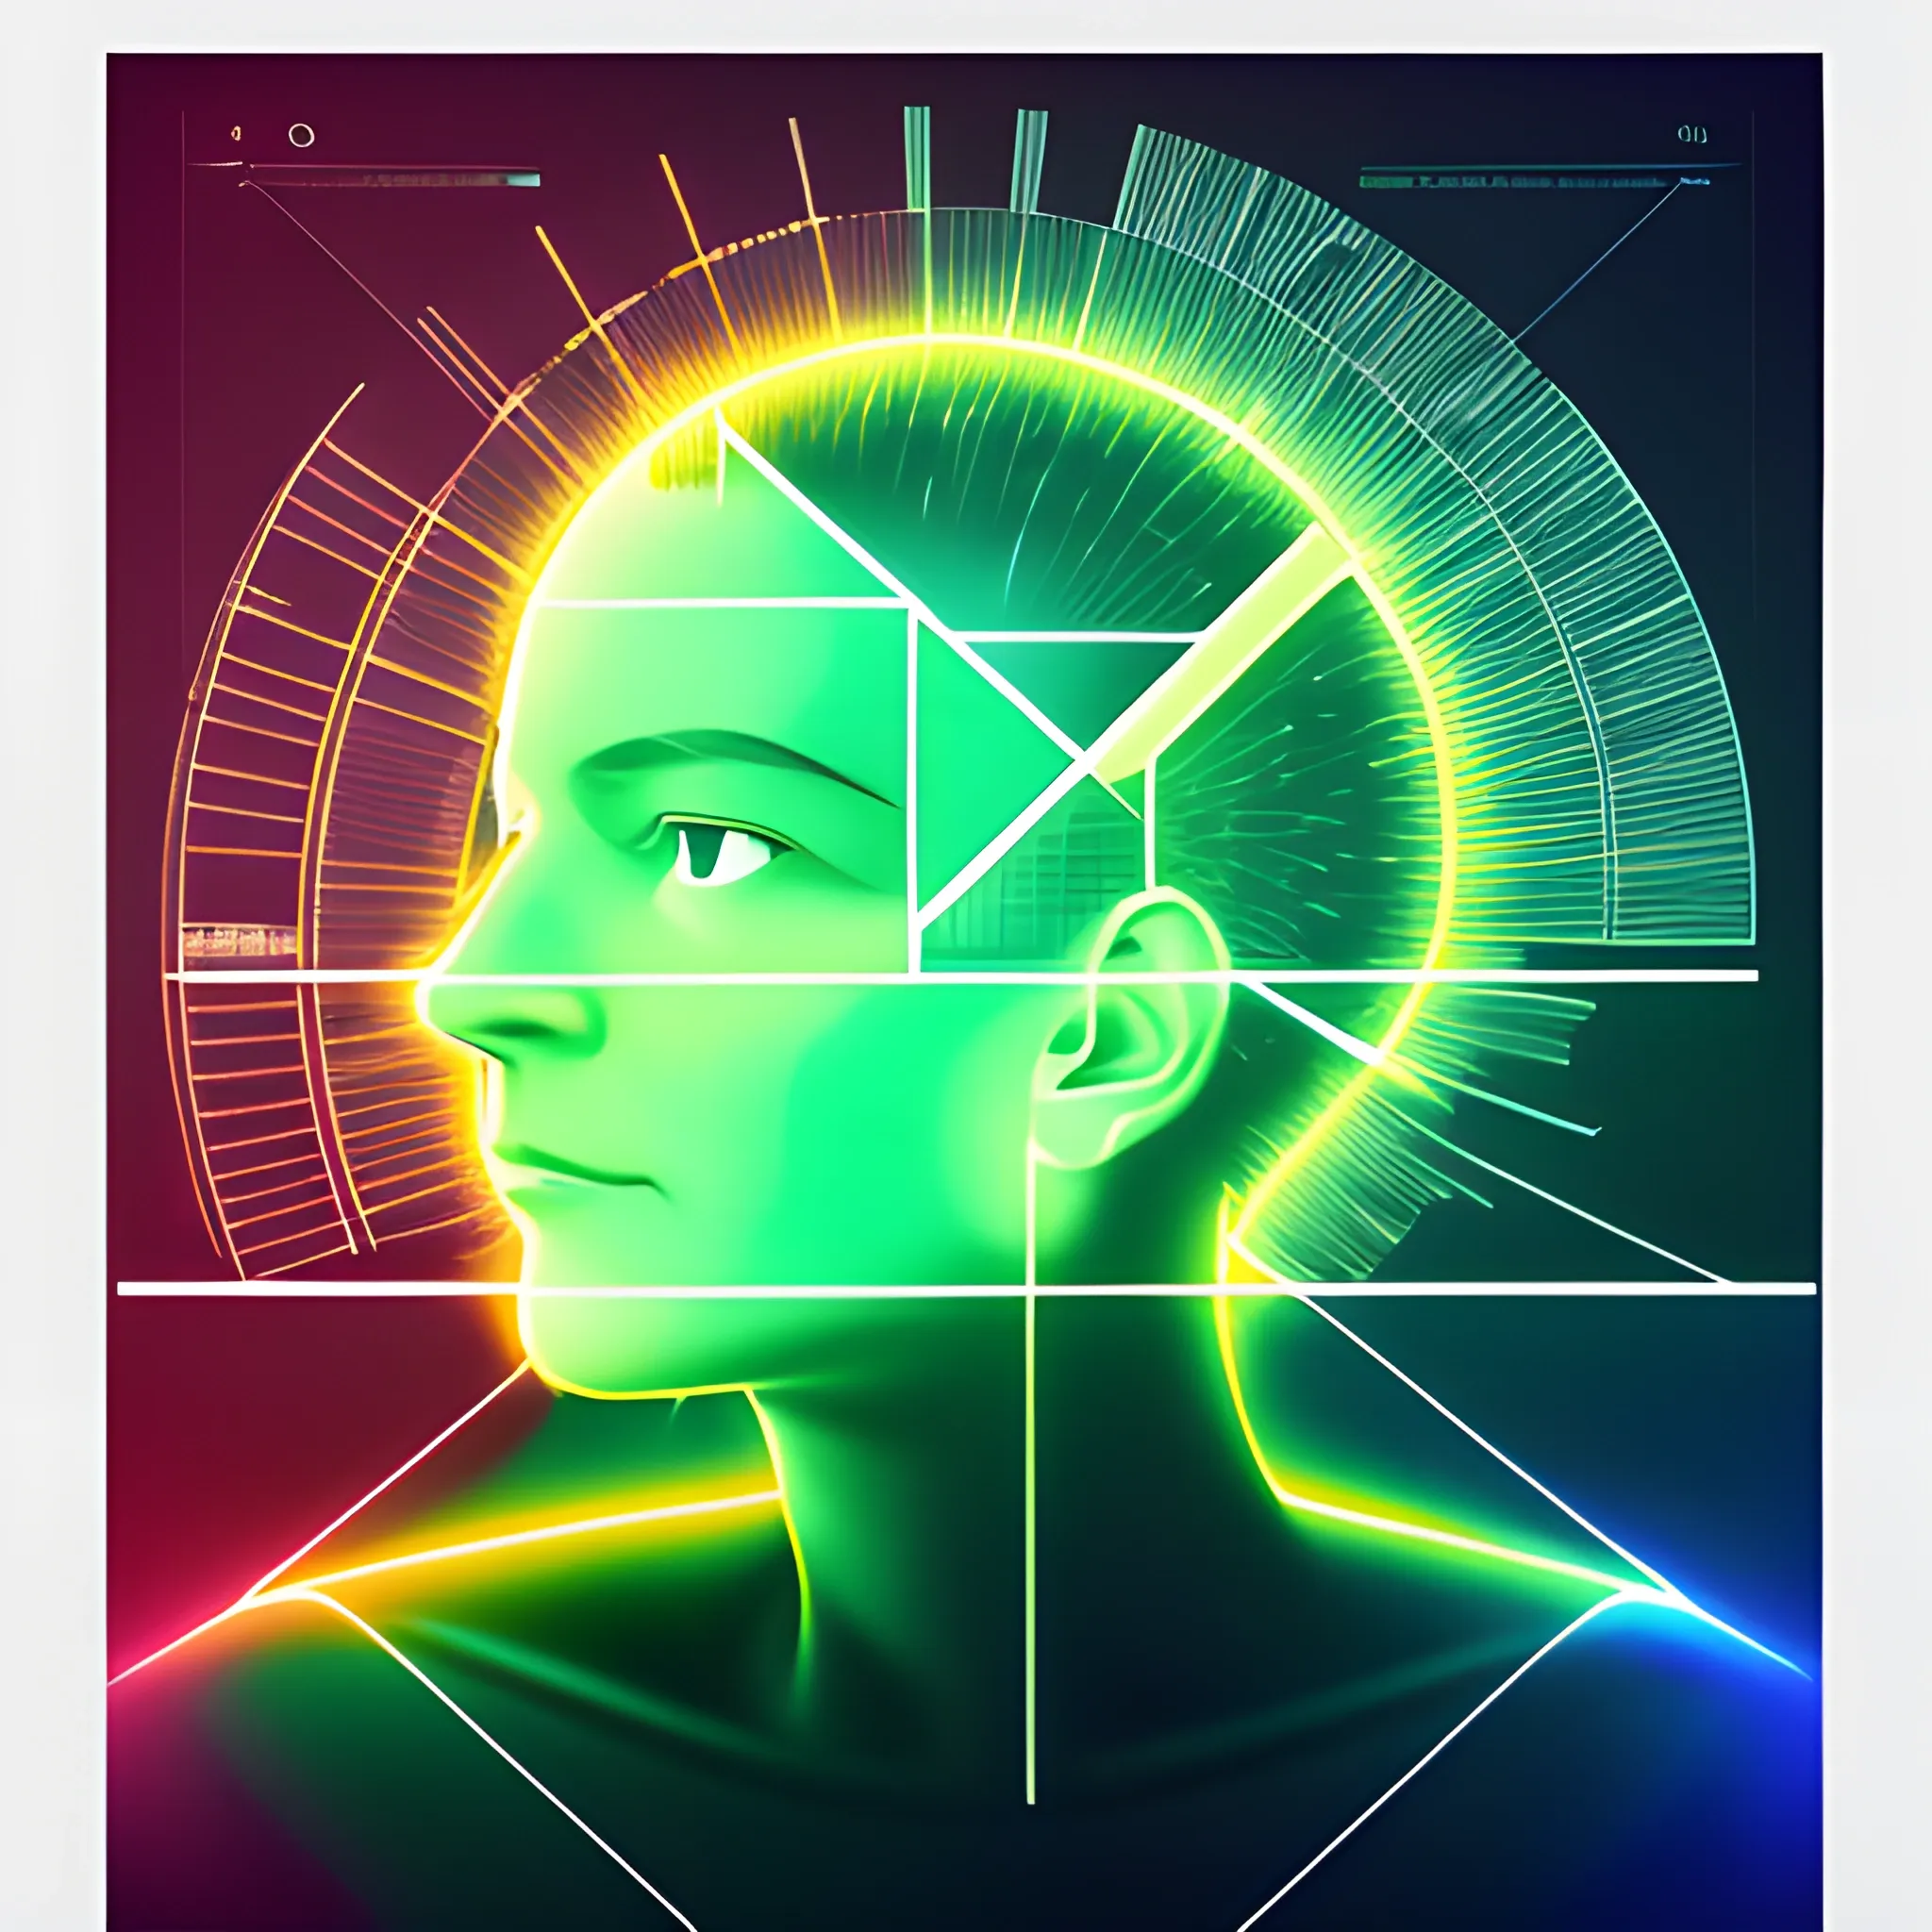
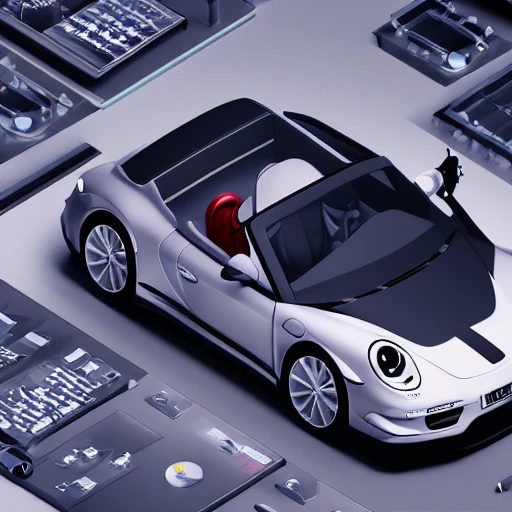
A photorealistic portrait of a ((determined|resilient|innovative)) ((scientist|researcher|inventor)) working on a transparent data visualization infographic , with a high-resolution OLED GUI interface display and annotations. The image is framed within a display case , showcasing the intricate technical drawing of a groundbreaking invention. ,

Style: Concept Art. Scene: A futuristic cityscape , with towering skyscrapers and sleek , aerodynamic vehicles speeding through the air. The high-resolution OLED GUI interface displays in the windows of the buildings are filled with transparent data visualization infographics , displaying everything from weather patterns to traffic flow. The colors are saturated and vibrant , with warm pinks and purples dominating the skyline. The overall effect is both beautiful and awe-inspiring. ,

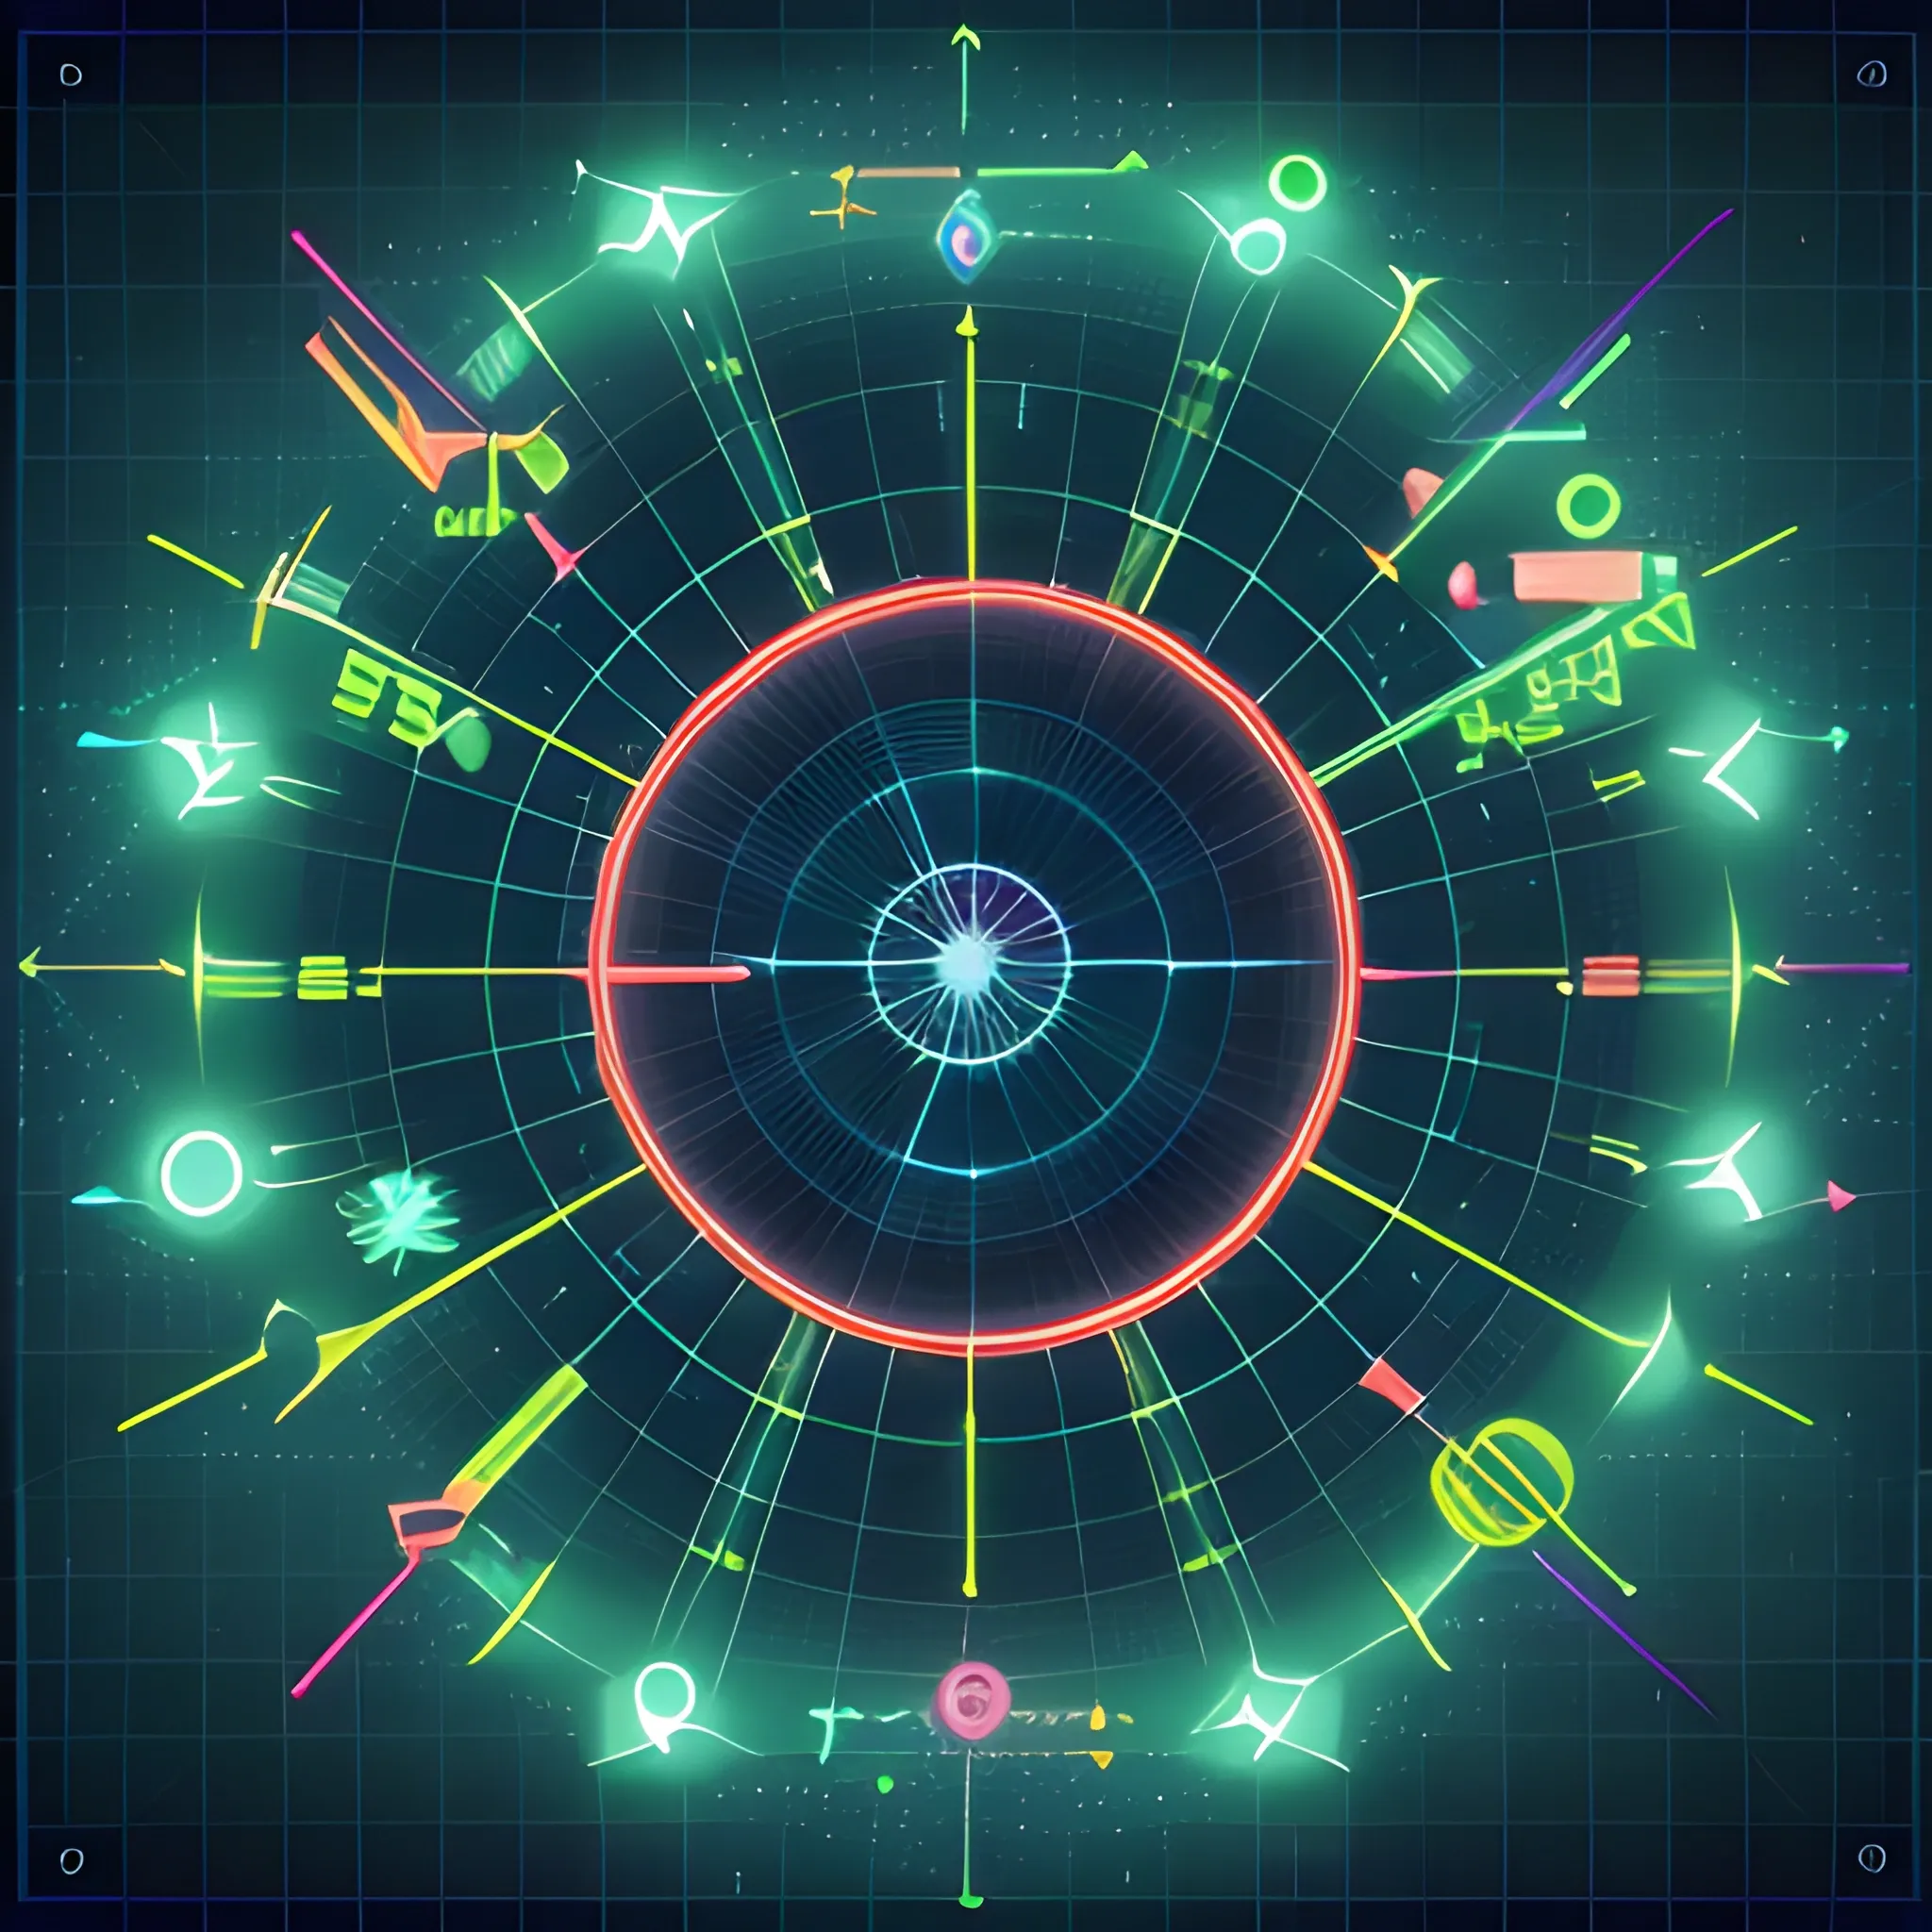
knollingcase , winter scenery of Lapland inside of snow globe , aurora borealis , transparent data visualization , trending on artstation , by Tom Bagshaw and Seb McKinnon , ultra detailed , hyper-realistic , cinematic , dramatic lighting , volumetric lighting , 150mm , octane render , photorealistic , denoise , photograph with a Hasselblad H3DII ,
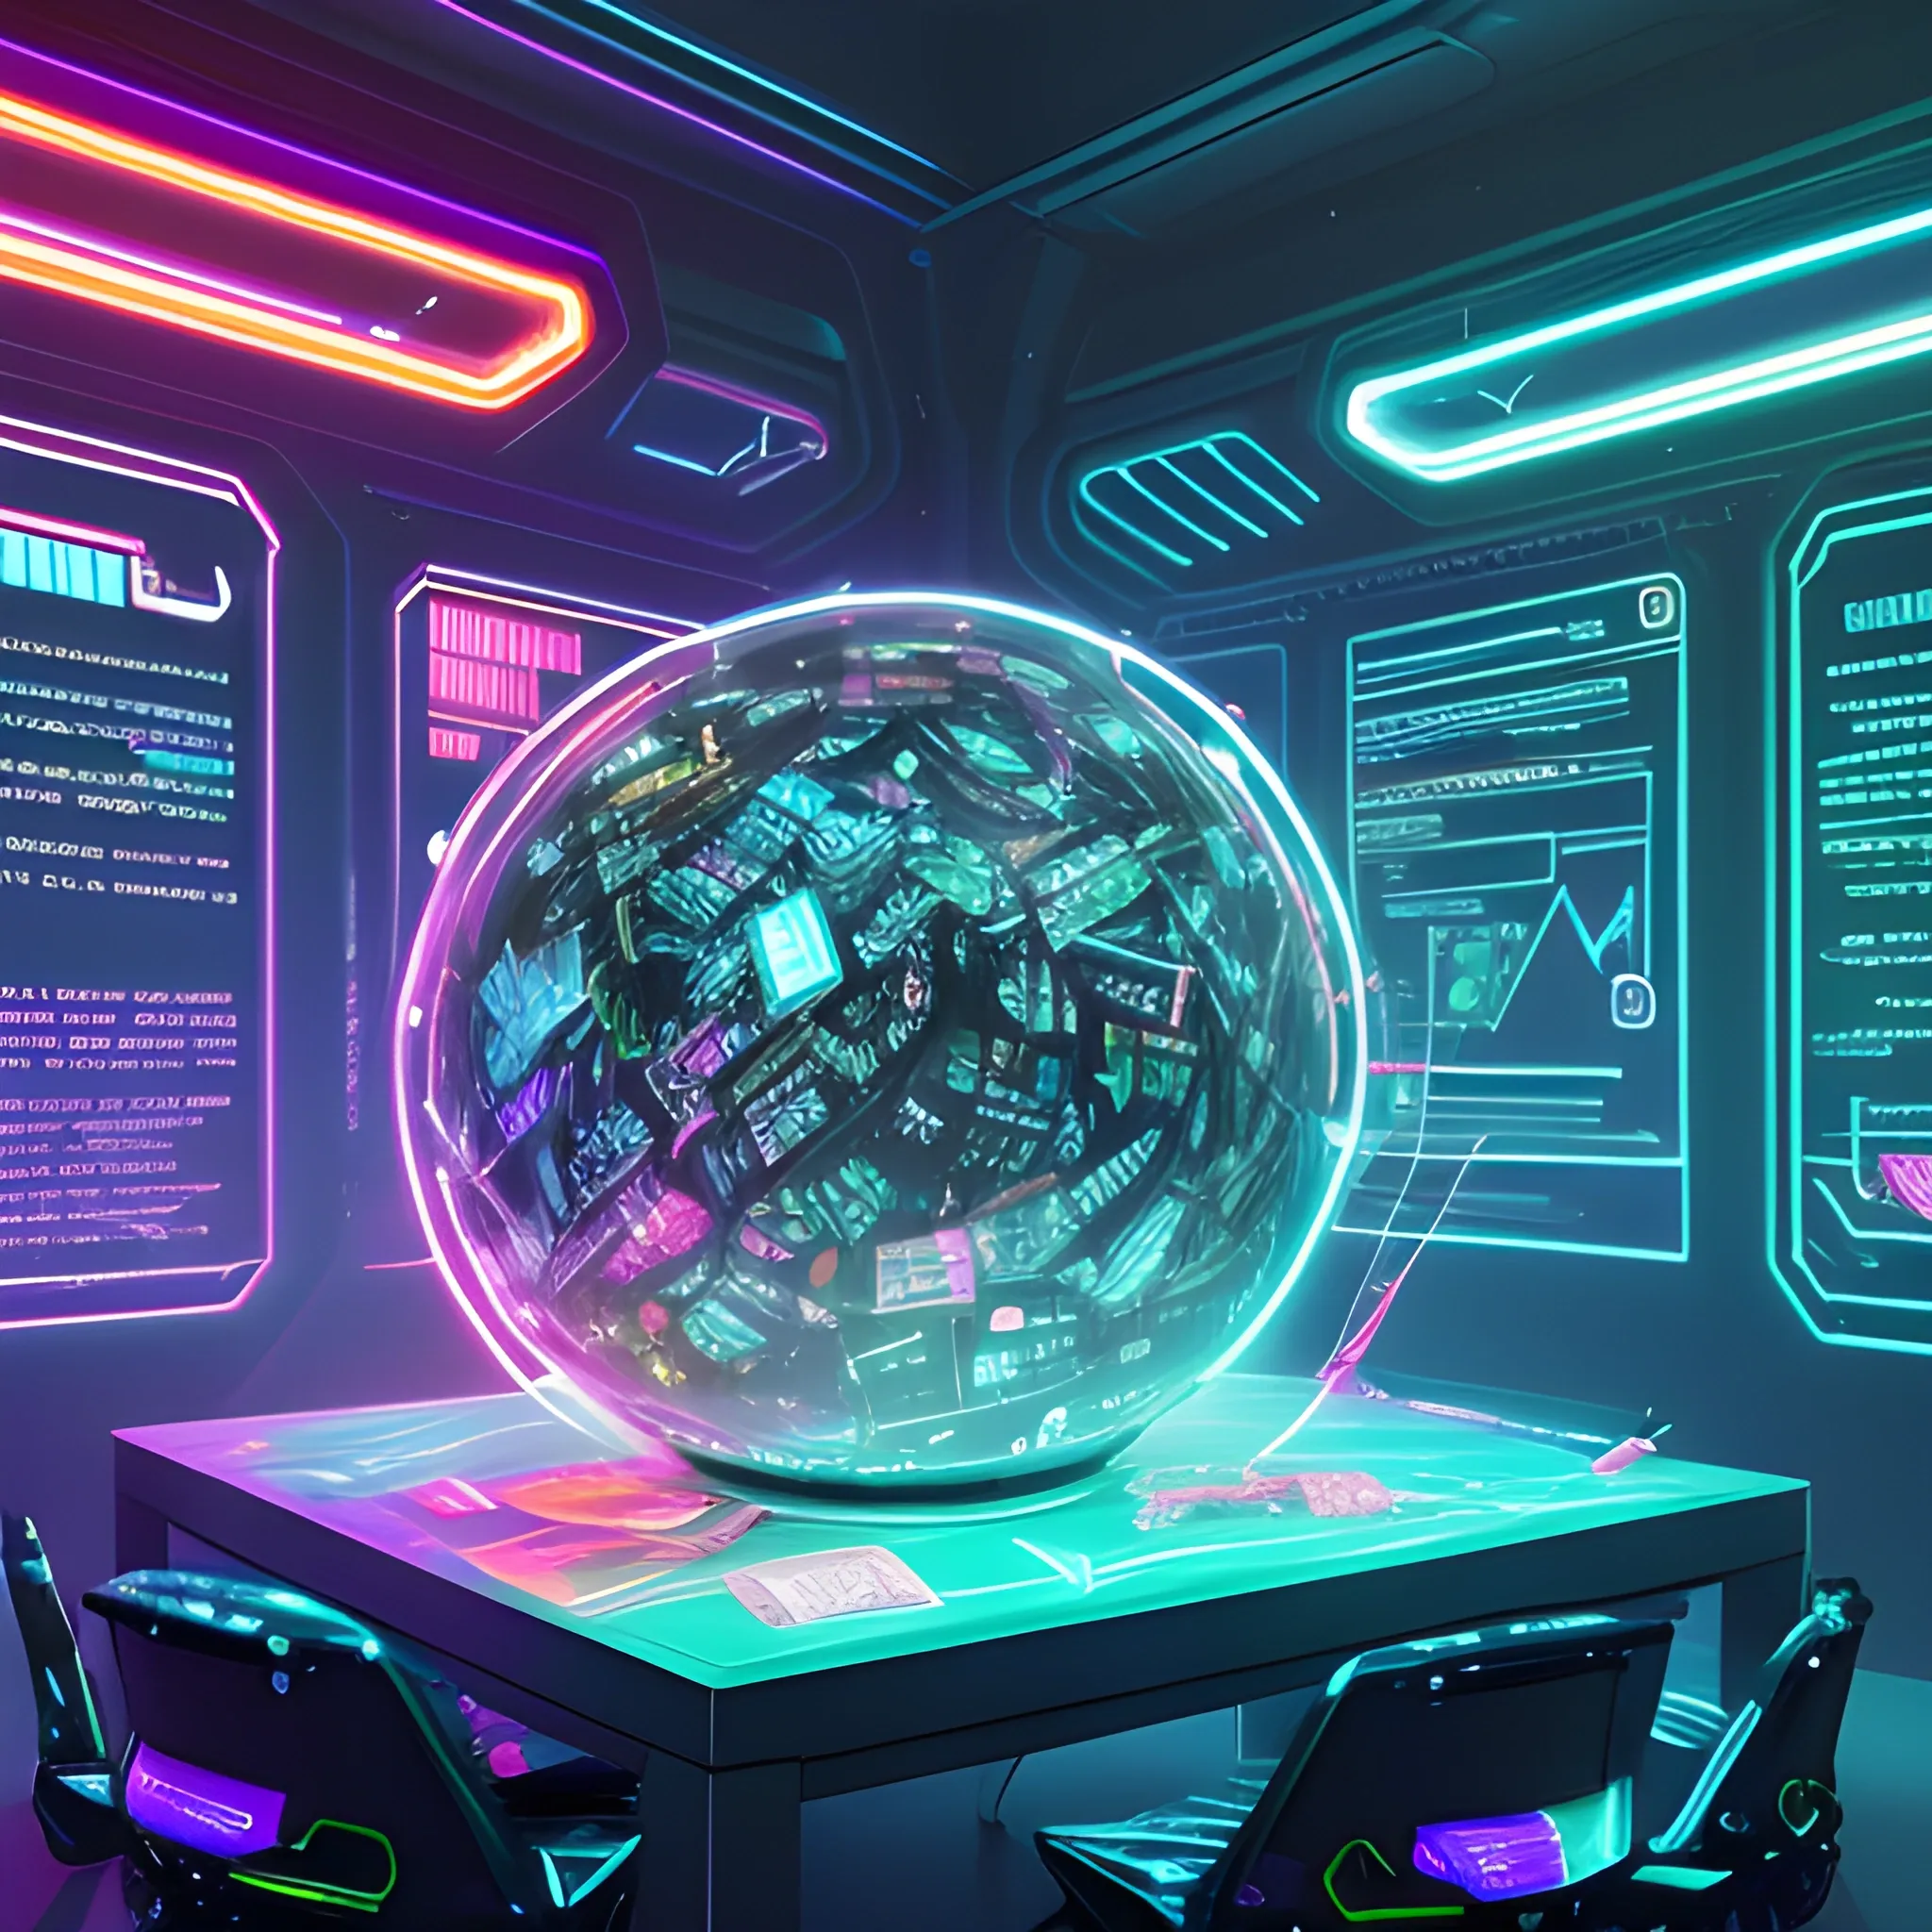
A futuristic , neon-lit desk overflowing with scattered papers , torn notes , and crumpled drafts , surrounded by holographic screens displaying swirling patterns of code and abstract data visualizations. In the center , a gleaming , metallic orb pulsates with an intense , blue light , representing the pursuit of original thought and the battle against intellectual dishonesty. The atmosphere is electric , with flashes of lightning illuminating the dark , cyberpunk-inspired room , symbolizing the intense struggle for creativity and authenticity ,

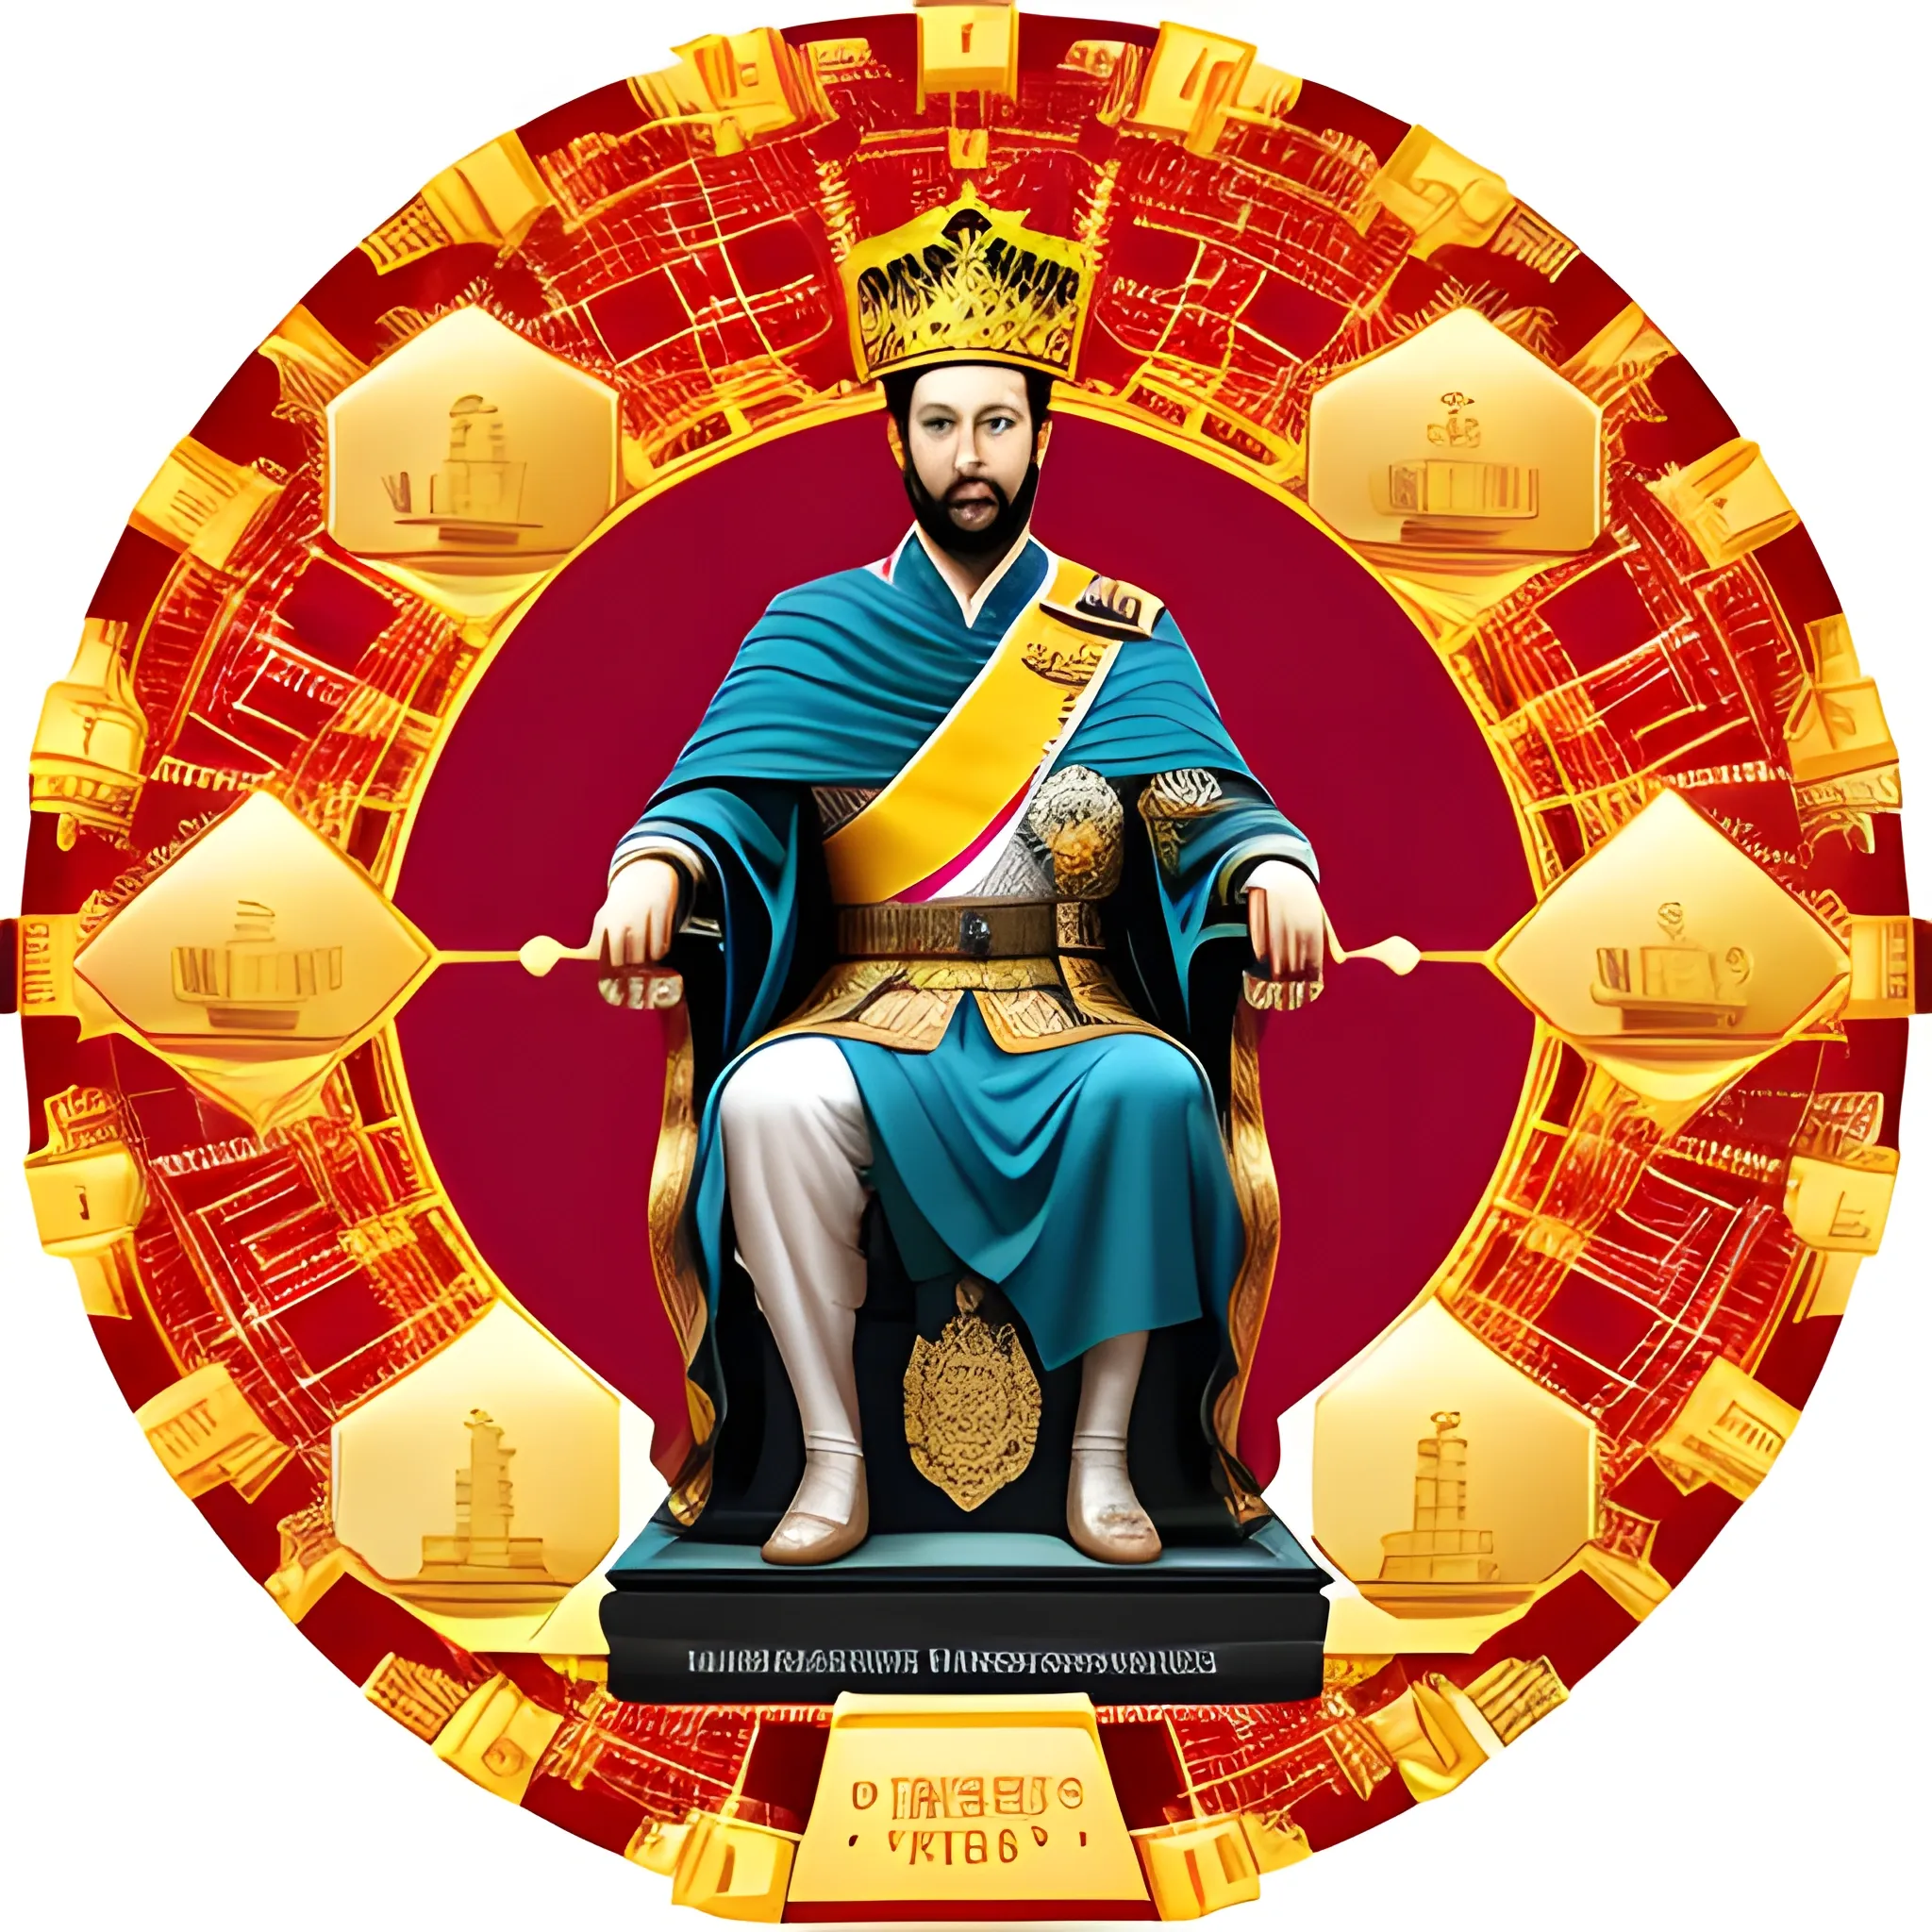
Create an image depicting the chess' king as the visionary leader of the data-driven kingdom , a symbol of authority and wisdom in the realm of business strategy. The king is portrayed as a distinguished and confident figure , radiating a sense of power and control. The image should showcase the king seated on a throne , adorned with symbols of data and technology , emphasizing his central role in guiding the organization's data-driven initiatives. Surrounding the king , incorporate elements that represent the interconnectedness of data and business , such as network patterns or data visualizations , symbolizing the king's ability to make informed decisions based on valuable insights. The image should evoke a sense of respect and admiration for the king's strategic prowess and his ability to lead the organization towards success through data-driven approaches. ,

Create an image depicting the chess' king as the visionary leader of the data-driven kingdom , a symbol of authority and wisdom in the realm of business strategy. The king is portrayed as a distinguished and confident figure , radiating a sense of power and control. The image should showcase the king seated on a throne , adorned with symbols of data and technology , emphasizing his central role in guiding the organization's data-driven initiatives. Surrounding the king , incorporate elements that represent the interconnectedness of data and business , such as network patterns or data visualizations , symbolizing the king's ability to make informed decisions based on valuable insights. The image should evoke a sense of respect and admiration for the king's strategic prowess and his ability to lead the organization towards success through data-driven approaches. ,

knollingcase , winter scenery of Lapland inside of snow globe , aurora borealis , transparent data visualization , trending on artstation , by Tom Bagshaw and Seb McKinnon , ultra detailed , hyper-realistic , cinematic , dramatic lighting , volumetric lighting , 150mm , octane render , photorealistic , denoise , photograph with a Hasselblad H3DII , 3D ,
Create an image depicting the chess' king as the visionary leader of the data-driven kingdom , a symbol of authority and wisdom in the realm of business strategy. The king is portrayed as a distinguished and confident figure , radiating a sense of power and control. The image should showcase the king seated on a throne , adorned with symbols of data and technology , emphasizing his central role in guiding the organization's data-driven initiatives. Surrounding the king , incorporate elements that represent the interconnectedness of data and business , such as network patterns or data visualizations , symbolizing the king's ability to make informed decisions based on valuable insights. The image should evoke a sense of respect and admiration for the king's strategic prowess and his ability to lead the organization towards success through data-driven approaches. ,
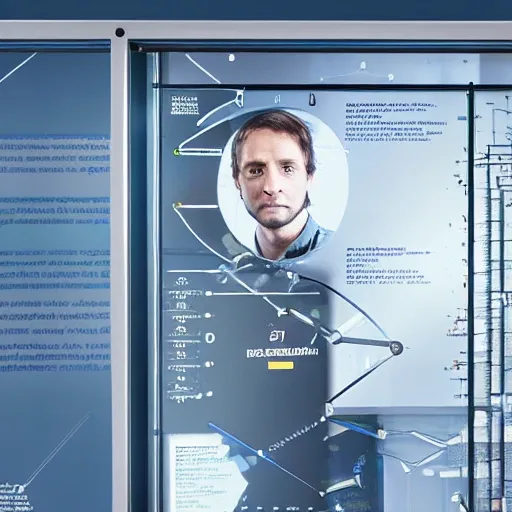
A photorealistic portrait of a ((determined|resilient|innovative)) ((scientist|researcher|inventor)) working on a transparent data visualization infographic , with a high-resolution OLED GUI interface display and annotations. The image is framed within a display case , showcasing the intricate technical drawing of a groundbreaking invention. ,

Style: Concept Art. Scene: A futuristic cityscape , with towering skyscrapers and sleek , aerodynamic vehicles speeding through the air. The high-resolution OLED GUI interface displays in the windows of the buildings are filled with transparent data visualization infographics , displaying everything from weather patterns to traffic flow. The colors are saturated and vibrant , with warm pinks and purples dominating the skyline. The overall effect is both beautiful and awe-inspiring. , 3D , Pencil Sketch , 3D ,
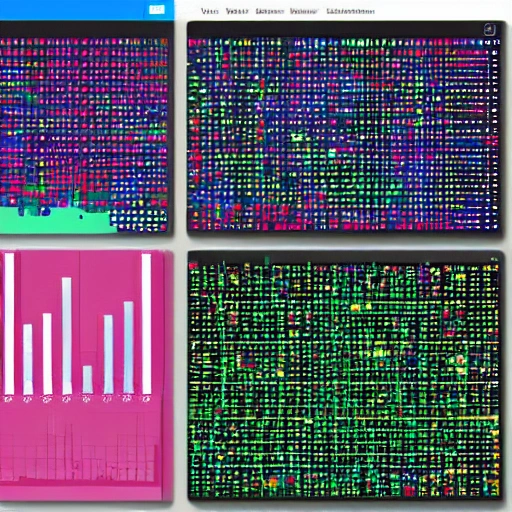
web , internet , square format , coding , vector , Data-driven , Real-time monitoring , Analysis chart , Business insight , Data visualization , Information display , Decision support , Data dashboard , Real-time analysis , Monitoring dashboard , book page , illustrator avatar , php , flat design image , 1:1 ,
Style: Concept Art. Scene: A futuristic cityscape , with towering skyscrapers and sleek , aerodynamic vehicles speeding through the air. The high-resolution OLED GUI interface displays in the windows of the buildings are filled with transparent data visualization infographics , displaying everything from weather patterns to traffic flow. The colors are saturated and vibrant , with warm pinks and purples dominating the skyline. The overall effect is both beautiful and awe-inspiring. ,
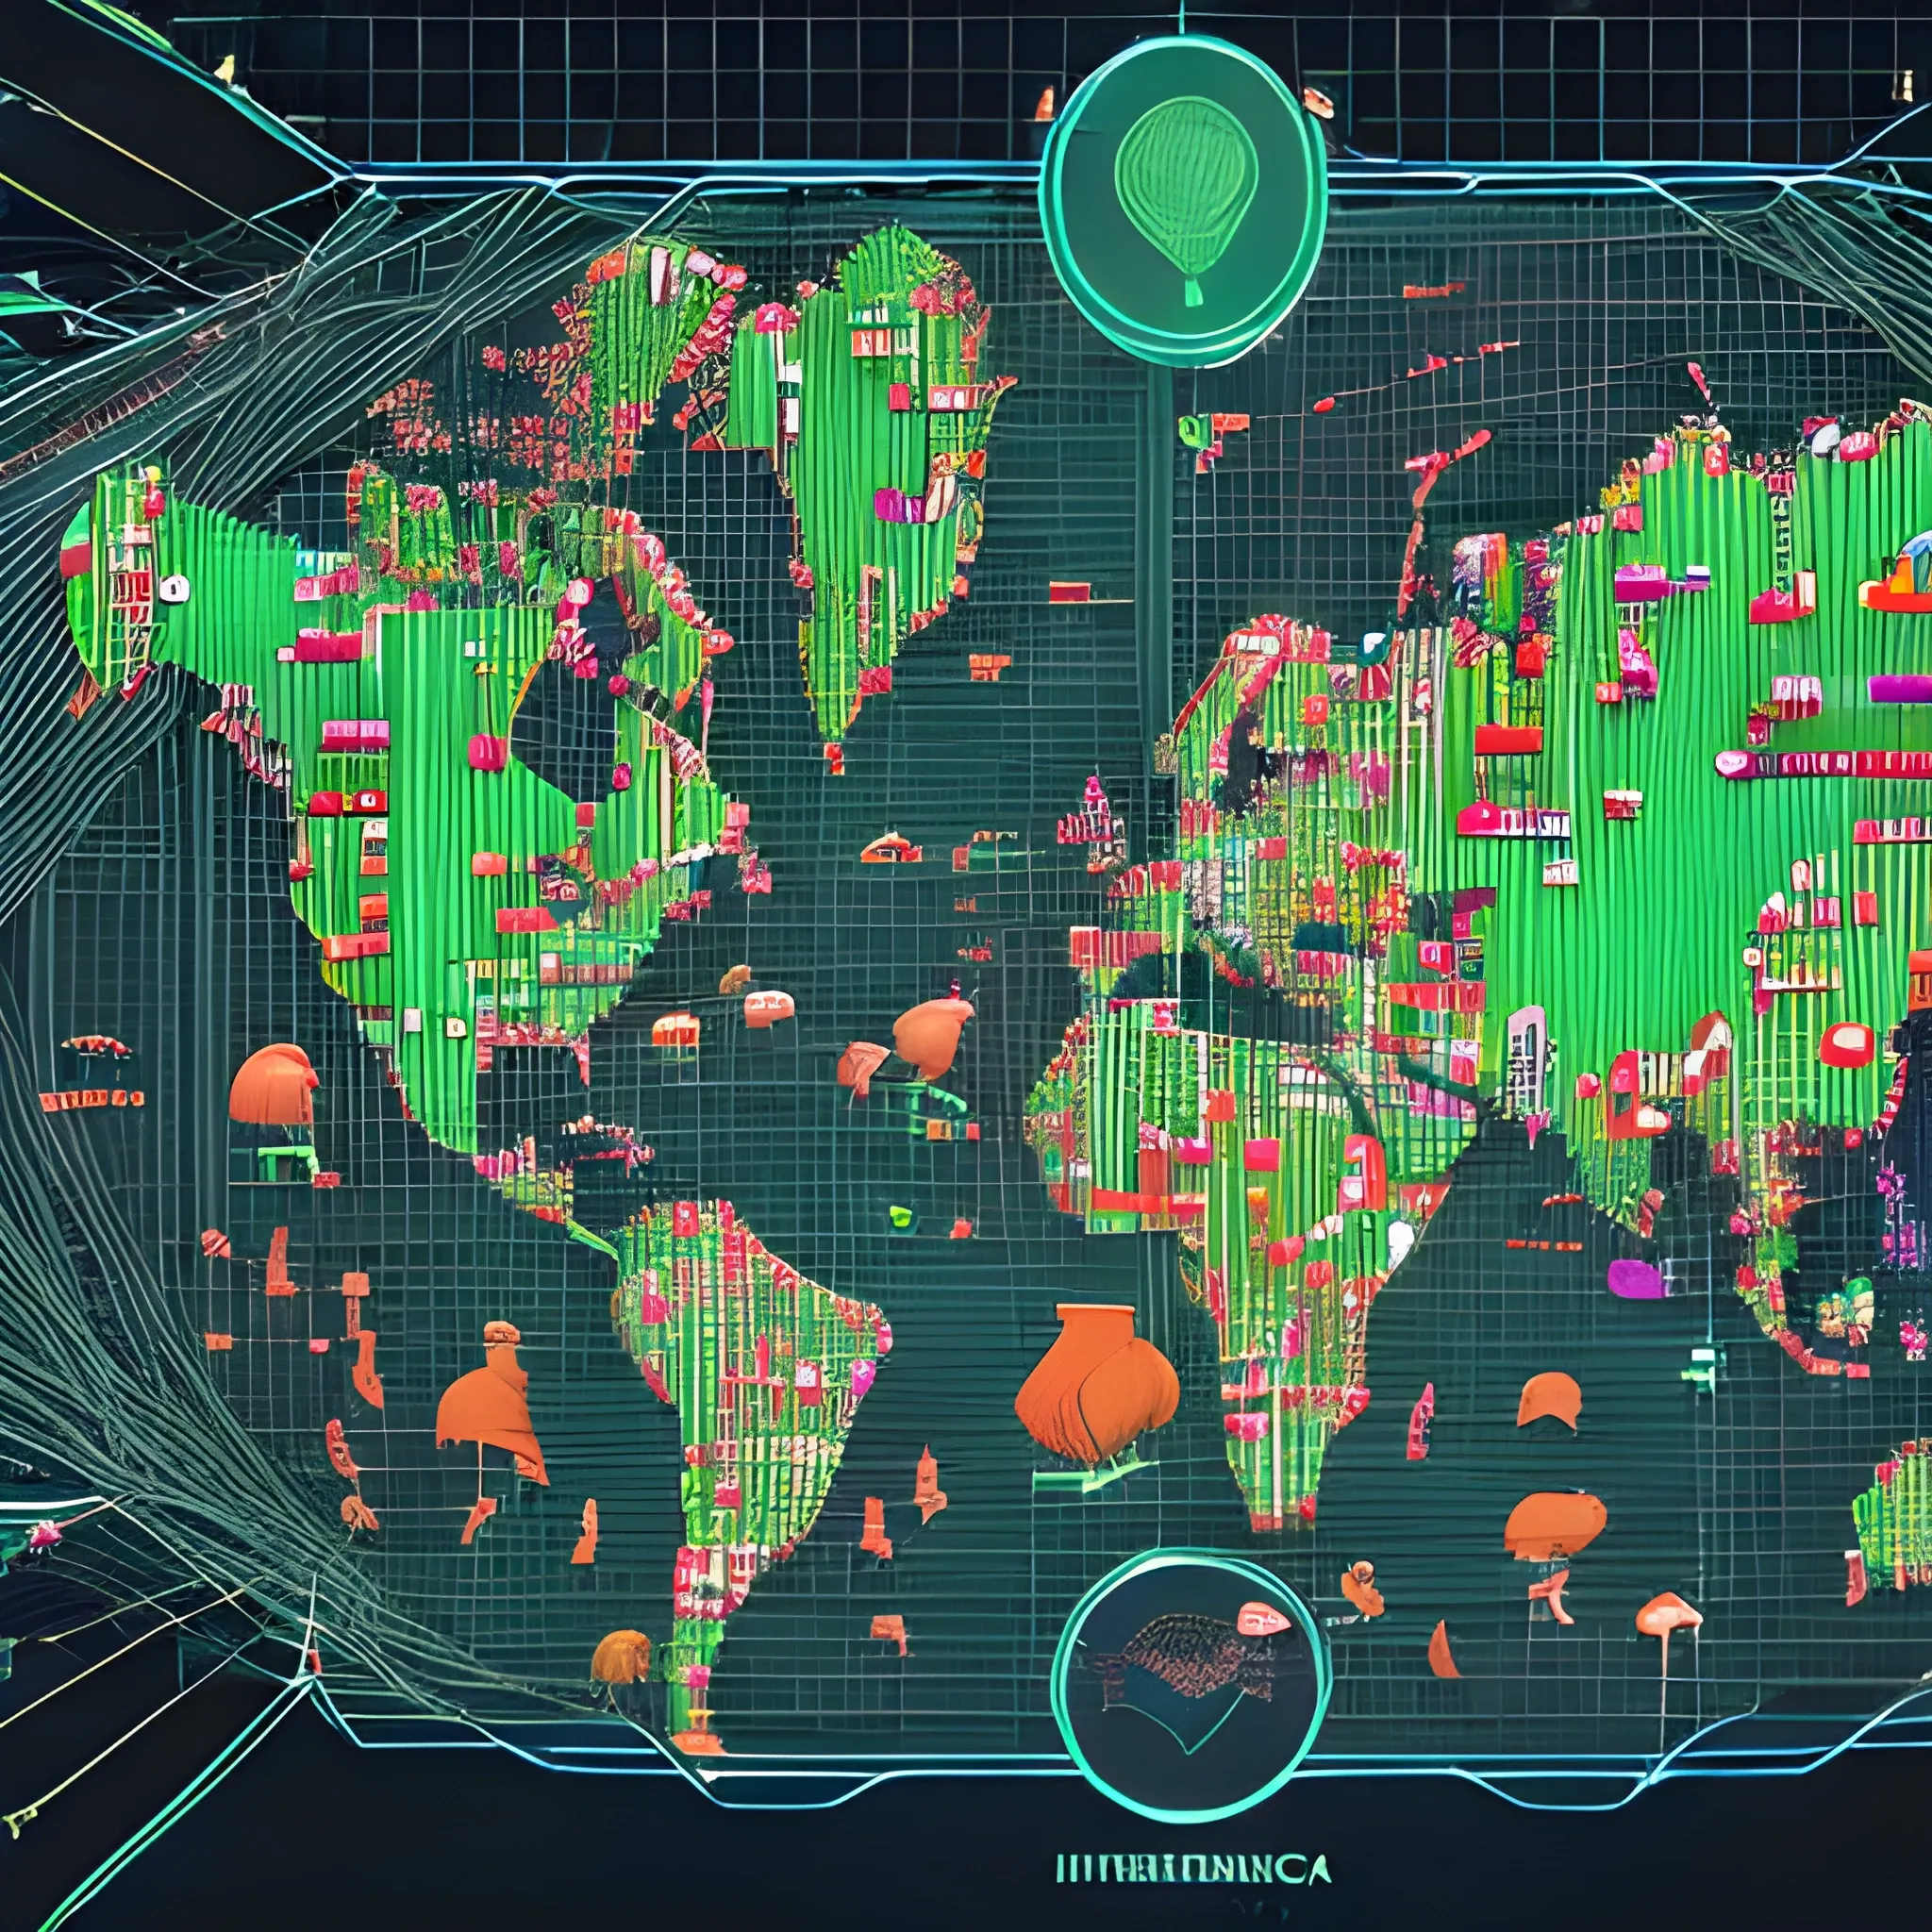
A complex data visualization , akin to an intricate diagram from the writings of M.C. Escher , represents the global poultry industry's intricate relationships. Shaded areas and color-coded patterns illustrate the impact of chicken consumption on farm profit margins , supply chains , and environmental sustainability. The scene is set in a futuristic , neon-lit metropolitan cityscape , with sleek skyscrapers and interconnected tubes evoking a sense of high-tech innovation. The overall mood is one of sleek modernity and dynamic progress. ,
Style: Concept Art. Scene: A futuristic cityscape , with towering skyscrapers and sleek , aerodynamic vehicles speeding through the air. The high-resolution OLED GUI interface displays in the windows of the buildings are filled with transparent data visualization infographics , displaying everything from weather patterns to traffic flow. The colors are saturated and vibrant , with warm pinks and purples dominating the skyline. The overall effect is both beautiful and awe-inspiring. , 3D ,
Style: Concept Art. Scene: A futuristic cityscape , with towering skyscrapers and sleek , aerodynamic vehicles speeding through the air. The high-resolution OLED GUI interface displays in the windows of the buildings are filled with transparent data visualization infographics , displaying everything from weather patterns to traffic flow. The colors are saturated and vibrant , with warm pinks and purples dominating the skyline. The overall effect is both beautiful and awe-inspiring. ,

A vibrant , textured depiction of the essential components within a glass of fresh pineapple juice , bursting with the bright yellows and greens of ripe fruit. The illustration highlights the vitamins , sugars , and electrolytes , using whimsical icons and data visualizations inspired by infographics. Gentle , diffused light filters through the image , evoking the sensation of sipping on a cool , tropical beverage. ,