Search Results for Automation
Explore AI generated designs, images, art and prompts by top community artists and designers.

Design a premium A4-size professional book back cover for AIAT Technologies that perfectly matches the front cover design , color palette , typography , branding , spacing , visual hierarchy , and enterprise technology aesthetic. Portrait orientation (A4 vertical) , print-ready publishing quality , ultra-high resolution , modern cybersecurity and IT infrastructure theme. Use a clean deep navy-blue background with subtle geometric grid patterns , abstract network connections , digital circuitry , server infrastructure elements , cloud computing symbols , data streams , and elegant holographic technology accents. No humans , faces , characters , hackers , hooded figures , robots , or mascots. Create a sophisticated corporate technology appearance suitable for a professional educational publication. At the top include a section titled "About This Book". Below it place a professionally formatted book description area explaining that Windows CLI – 100 Important Commands is a practical reference guide covering essential Windows command-line tools for system administration , troubleshooting , networking , security operations , automation , diagnostics , and IT support. Include a clean feature highlights section with modern iconography containing: • 100 Essential Windows Commands • Practical Command Examples • Networking & Troubleshooting Tools • System Administration Techniques • Security & Diagnostic Utilities • Beginner to Advanced Learning Resource. Add a section titled "Who Should Read This Book?" listing: IT Professionals , System Administrators , Help Desk Engineers , Cybersecurity Analysts , Networking Students , Technology Enthusiasts , and Computer Science Learners. Include a professional AIAT Technologies company profile section with the heading "About AIAT Technologies" and a clean placeholder text area for company information. At the bottom reserve space for ISBN barcode placement , publisher information , website , email address , copyright details , and social media icons. Use premium white and cyan typography with strong readability and professional alignment. Maintain generous spacing , balanced composition , and publishing-standard formatting. The overall design must feel like a bestselling enterprise technology handbook from a leading technology training organization. Print-ready , ultra-detailed , corporate publishing quality , elegant modern layout , professional educational technology branding , 8K quality. Negative Prompt: no humans , no faces , no hooded figures , no hackers , no robots , no anime , no cartoons , no gaming appearance , no movie-poster style , no cluttered layout , no excessive neon effects , no blurry text , no distorted typography , no low resolution , no watermark , no stock-photo appearance , no horror elements , no fantasy elements. ,

Comporte toi comme un expert en défini graphique , je veux un LOGO simple et professionnel de mon nouveau produit qui s'appelle "Tajirly" , pour la création des sites web , tunnel de vente et automation...et pour avoir plus d'informations sur les services proposant voici le site de référence utajir.com ,
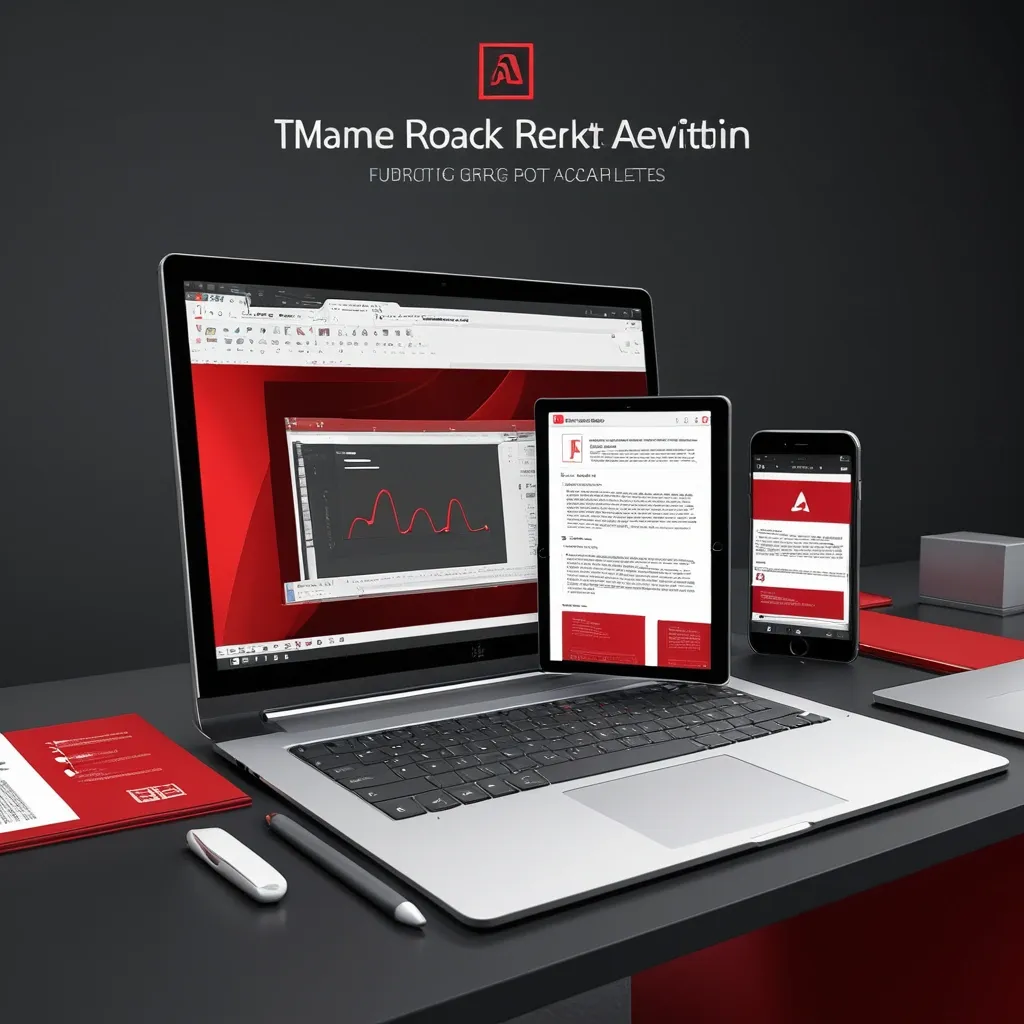
Create a high-quality Facebook marketing image for Adobe Acrobat Studio featuring a modern professional workspace with a sleek laptop and tablet displaying vibrant PDF documents , AI assistant visuals , and creative design elements , highlighting advanced PDF tools such as PDF editing , OCR , e-signature , file conversion , and document security , alongside AI-powered features like smart Summarization , insights , and automation , and incorporating Adobe Express creative tools elements like templates , graphics , and visual assets , all presented in a clean , premium , and futuristic style with a color palette of deep Adobe red , crisp white , dark gray , and black , set against a minimal background with sharp focus , realistic lighting , and a professional corporate tech look that exudes power , intelligence , and productivity , perfect for a Facebook post advertisement with ultra-high resolution and crisp details. ,

A futuristic digital workspace with floating screens displaying Email automation: Emails analyze performance metrics with charts and dashboards. A young man is sitting at the center , typing on a laptop with holographic Email automation rising around him , motion speed , symbolizing success and growth. ,
(business model with email automation) , modern concept , sleek design , impactful graphics , innovative elements , clean and professional look , vibrant color palette , dynamic layout , showcasing synergy between technology and email automation , high-quality visuals , ultra-detailed , futuristic ambiance , representing growth and digital transformation , appealing to target customers in the email automation. ,
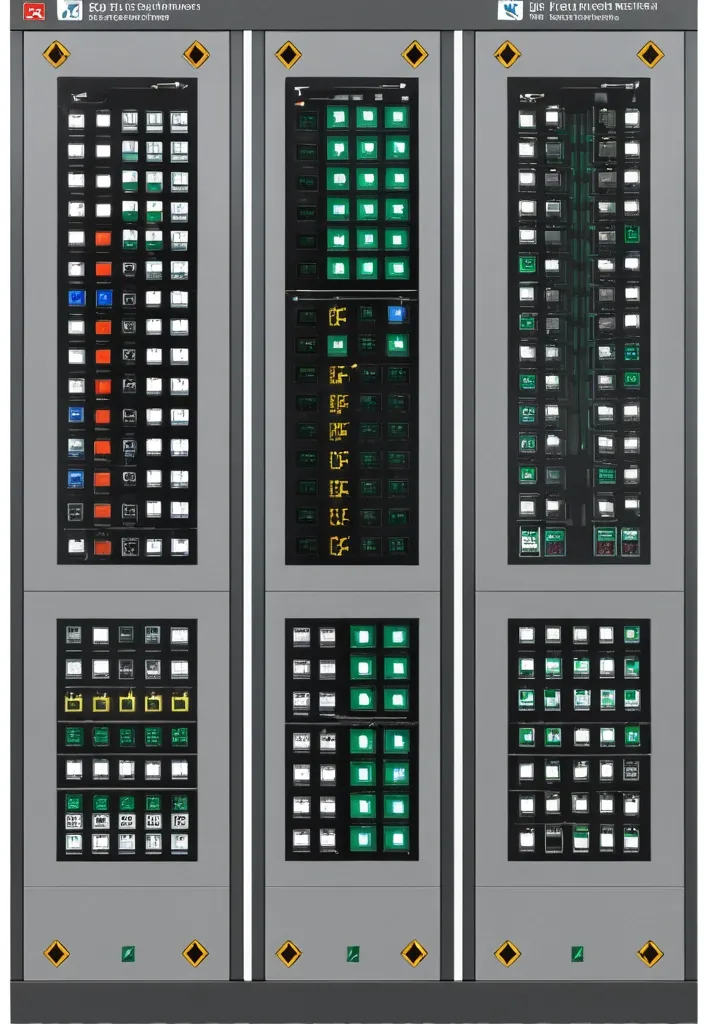
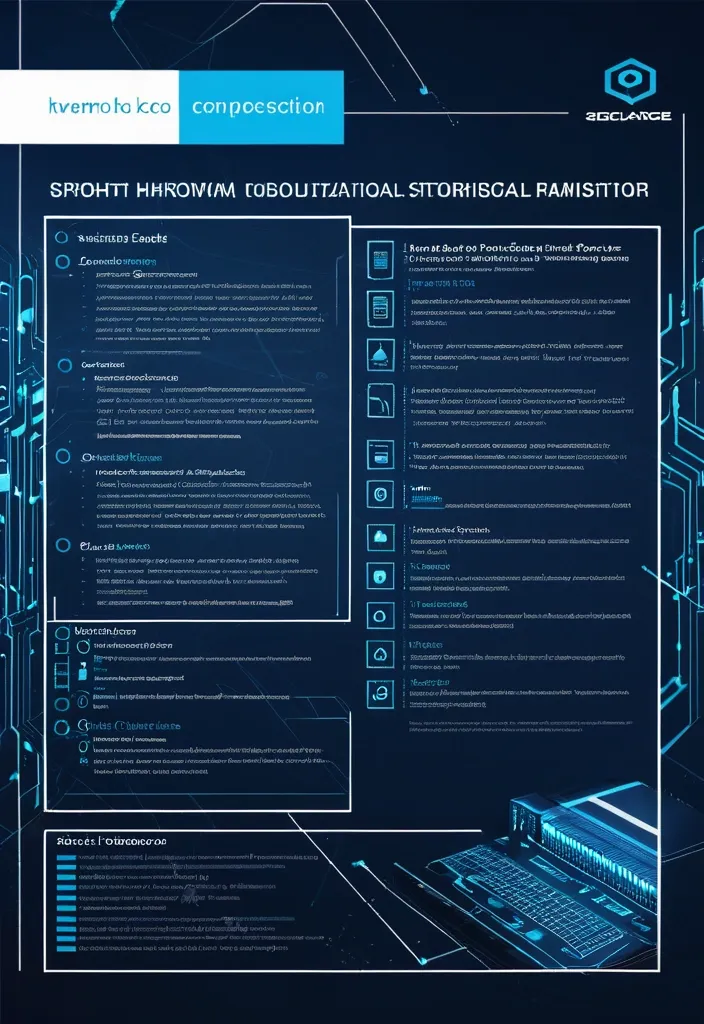
Description of the visualization and control system of the automation complex The purpose of the system is to provide the operator with a single , intuitive interface for monitoring and managing all subsystems of the complex in real time. Architecture of the main window (Generalized Status Panel): The main screen is designed according to the principle of "from general to private". The center contains critical information about the power supply system , on which all other systems depend. The remaining subsystems are grouped logically around the center. 1. Central unit: Power supply system It is visualized as a circle divided into three sectors. Large left sector (≈45%): Transformer substations (TP) 5 blocks are displayed , one for each TP. Each block contains: TP number/name (for example , TP-1 , TP-2). The indicator of the active power line: The "Network" icon with backlight (green - main , yellow - backup). Transformer status: "Main" / "Standby" (or icons). Key parameters from accounting nodes: Current (I) , Voltage (U) , Power (P). The values are output for the active line. General TP status: Color indication (Green - Normal , Yellow - Warning , Red - Emergency). Large right sector (≈45%): Main switchboards 5 blocks are displayed , one for each storage unit. Each block contains: The number/name of the GRSH (for example , GRSH-1). Active power line indicator: Similar to TP. Key parameters from accounting nodes: I , U , P. The general status of the GRS: Color indication. Lower small sector (≈10%): Uninterruptible power supply (UPS) Large text or pictogram status indicator: "Mains operation" (Green) "Battery operation" (Yellow/Orange) Battery level indicator: Percentage scale (from 0% to 100%). The color varies depending on the level (green >50% , yellow 20-50% , red <20%). 2. Peripheral blocks around the center They are arranged around a central circle , forming a "rim". Upper and lower parts of the rim: Ventilation of the web blowing Upper part: 9 installations on top. The lower part: 9 installations from the bottom. There are 18 icons/blocks in total. Each icon represents one installation and has a color indication of the status.: Green: Enabled Gray: Turned off Red: An accident (for example , the differential pressure sensor on the filter went off , an error in the drive) Black/Blue: No power supply When hovering over the cursor , a tooltip appears with details (the condition of the fan , valve , filter blockage). Left and right sides of the rim: Indoor ventilation The left and right sides are divided equally to display the 12 settings on each side. There are 24 icons/blocks in total. The same color status indication for each installation. 3. Corner blocks: Other subsystems They are located in the four corners of the screen for easy and fast perception. Upper left corner: Roller shutters (48 pcs.) Summary information is displayed as an information block.: "Closed: XX / Open: XX" (numeric values). A graphical indicator (for example , a stripe divided into green and blue parts , proportional to the number). General status: Green icon "OK" or Red icon "Emergency" (if at least one roller shutter has an emergency status). Upper right corner: Elevators (2 pcs.) Two vertical blocks , one for each elevator. Each block contains: Elevator number (Elevator 1 , Elevator 2). Floor indicator: A large number (for example , 3). Motion indicator: Up/down arrow or Stop icon. General status: The background color of the block (Green - normal , Gray - power off , Red - emergency , Blue - no connection). Lower left corner: EVIL Lights (Roof lamps) A large indicator in the form of a stylized lamp or icon. Color status indication: Bright Yellow/White: Included Gray: Off Red: Crash Black/Blue: No power supply Lower right corner: Heated storm drains Similar in style to the "Fires of EVIL" block. Color status indication: Orange/Red: Enabled Gray: Off Red (flashing): Crash Black/Blue: No power supply Navigation and management: Main Screen: It is an overview map. All the elements on it are clickable. Details: Clicking on any sector (TP , GRS , ventilation group , roller shutter unit) opens a new window with detailed information: TP/GRS: Single-line network diagram , status of all feeders and sectional switches , detailed power parameters. Ventilation: Detailed status of each piece of equipment in the selected group (fan , valve , filter condition) , possibility of manual control. Roller shutters: A table or plan of the building with the condition of each of the 48 roller shutters , group and individual control buttons. Control: The control buttons (Start , Stop , Open , Close) are located on the detailed screens. On the main screen , quick action buttons ("Emergency activation") can be displayed for critical systems (for example , EVIL lights). Visual style: Color scheme: An intuitive color palette is used (Green is the norm , Yellow/Orange is a warning , Red is an accident , Gray/Blue - disabled/no data). Fonts: Clear , easy-to-read fonts. Critical information is displayed larger. Animation: Minimal and informative (for example , smooth change of values , flashing for emergency states). ,

generate a character in a minimalist modern style that reflects the product feed automation service. Text that reflects the USP: Even perfectly cleaned data won't be useful if it doesn't match the store's structure. Most services require manual work at this stage. We've solved this problem! First , we analyze your current catalog: you upload a sample of your data , and we understand how your fields are named and what format your characteristics are in. We then automatically convert the supplier data to your format , eliminating the need for manual mapping and human error. ,
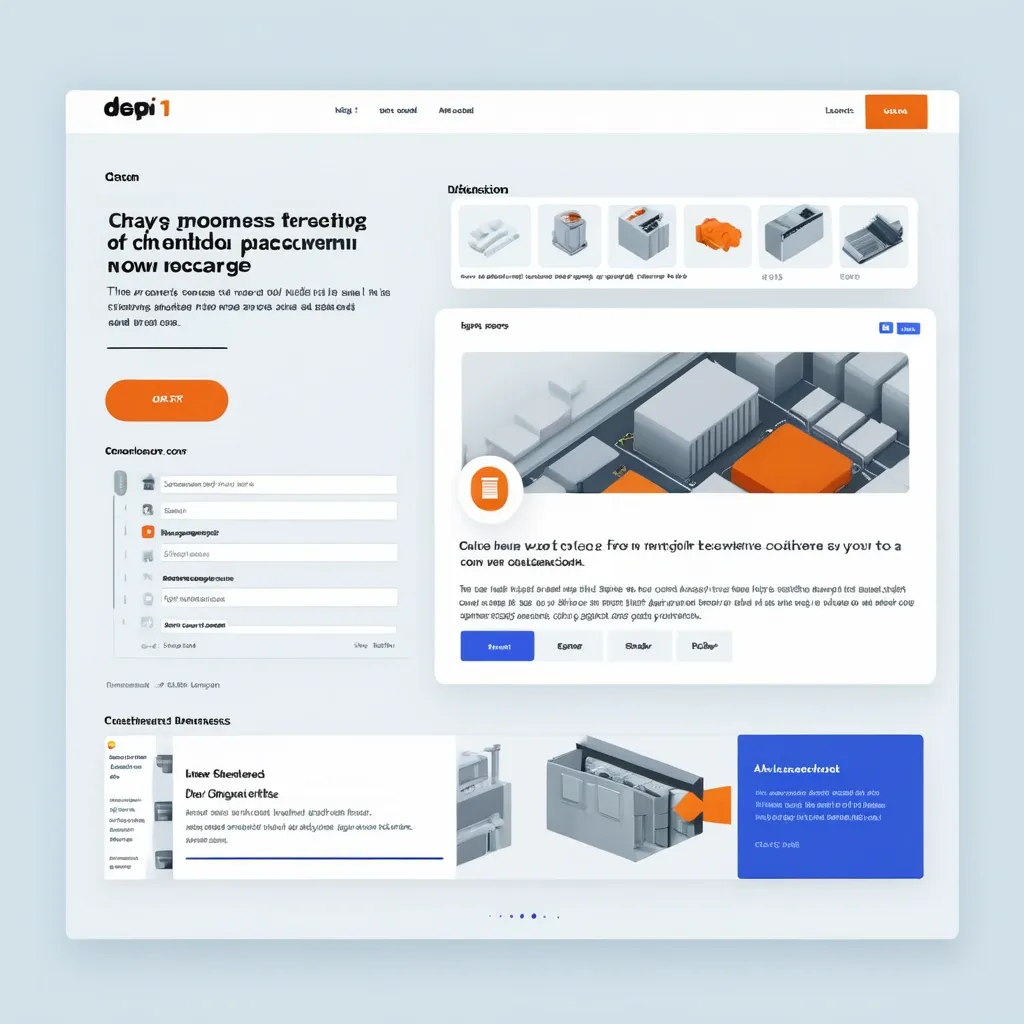
Make a prototype of a block for the data processing service website page (the service uses AI when necessary) , taking into account the following requirements: Hero block (Hero section) The purpose of the block is to immediately attract attention and convey the key SEO USP: NotPIM — conversion of product feeds in any direction for online stores. Texts: Title (H1): "Conversion of product feeds in any direction — quickly , accurately , and without unnecessary work" Subtitle: "From the chaos of price lists and data from suppliers to a ready-made catalog in the desired format. Automation without programmers." CTA button: "Try it for free" Visual: illustration/animation "disparate feeds → clean catalog". ,

Clean horizontal web banner showing Gmail envelope icon in red and white , a green Google Sheets-style table , a grey gear icon representing automation , and colourful email label tags in blue , yellow , and orange. Light grey or white background , modern flat vector design , tech-style UI , wide aspect ratio , minimalistic layout , centered composition , no text. No photorealism , no shadows , no gradients , no 3D , no people , no text , no blur , no messy background , no dark colours , no hand-drawn style , no low resolution. ,

Clean horizontal web banner showing Gmail envelope icon in red and white , a green Google Sheets-style table , a grey gear icon representing automation , and colourful email label tags in blue , yellow , and orange. Light grey or white background , modern flat vector design , tech-style UI , wide aspect ratio , minimalistic layout , centered composition , no text. No photorealism , no shadows , no gradients , no 3D , no people , no text , no blur , no messy background , no dark colours , no hand-drawn style , no low resolution. ,

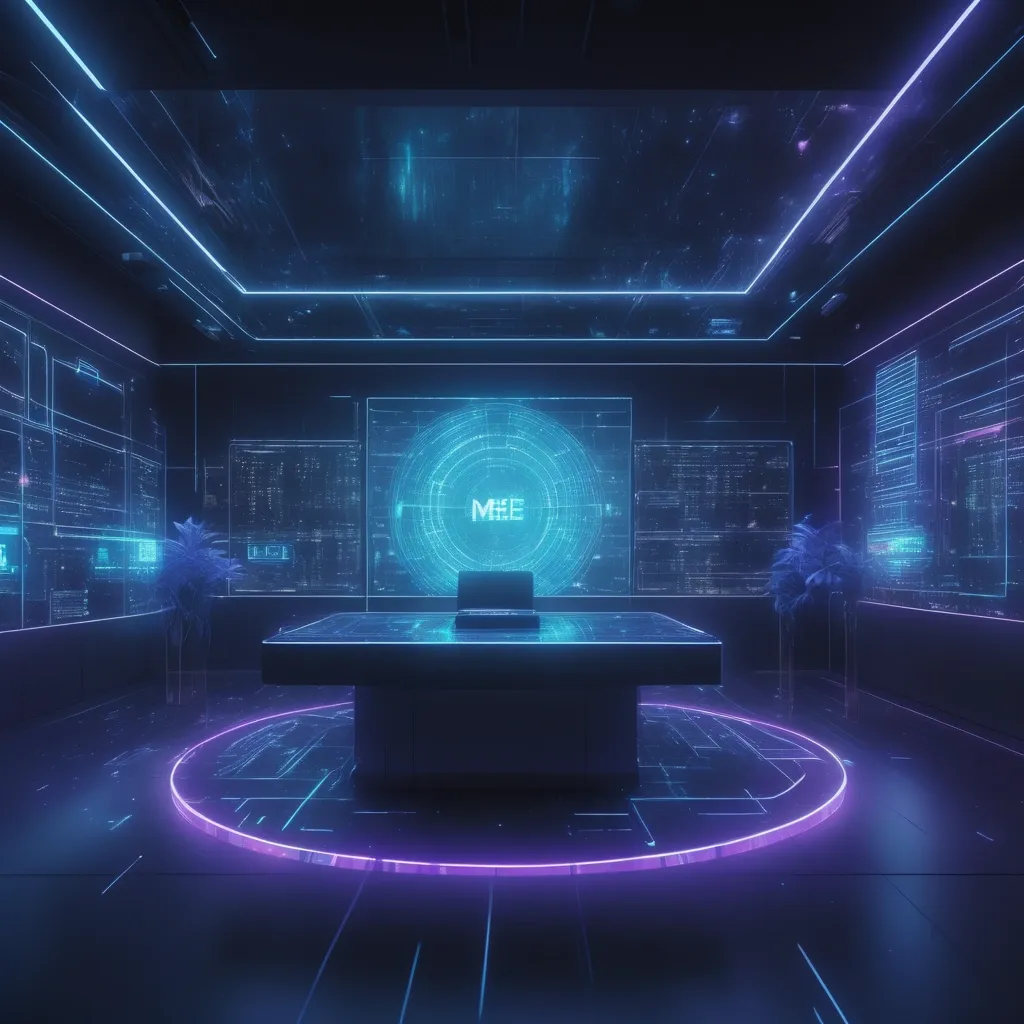
"Create a futuristic holographic environment representing blockchain-powered DeFi governance. The scene should feature a floating , decentralized control center surrounded by glowing blockchain nodes and smart contracts. In the center , place a holographic governance panel where users vote using digital governance tokens , influencing decentralized decisions. Around the scene , DAO participants interact with transparent voting screens , smart contract automation , and reputation-based voting systems. The background should include a cyberpunk-style financial cityscape , symbolizing a fully decentralized and self-regulating blockchain economy. Use glowing blue , neon purple , and gold accents to enhance the high-tech , immersive aesthetic." ,


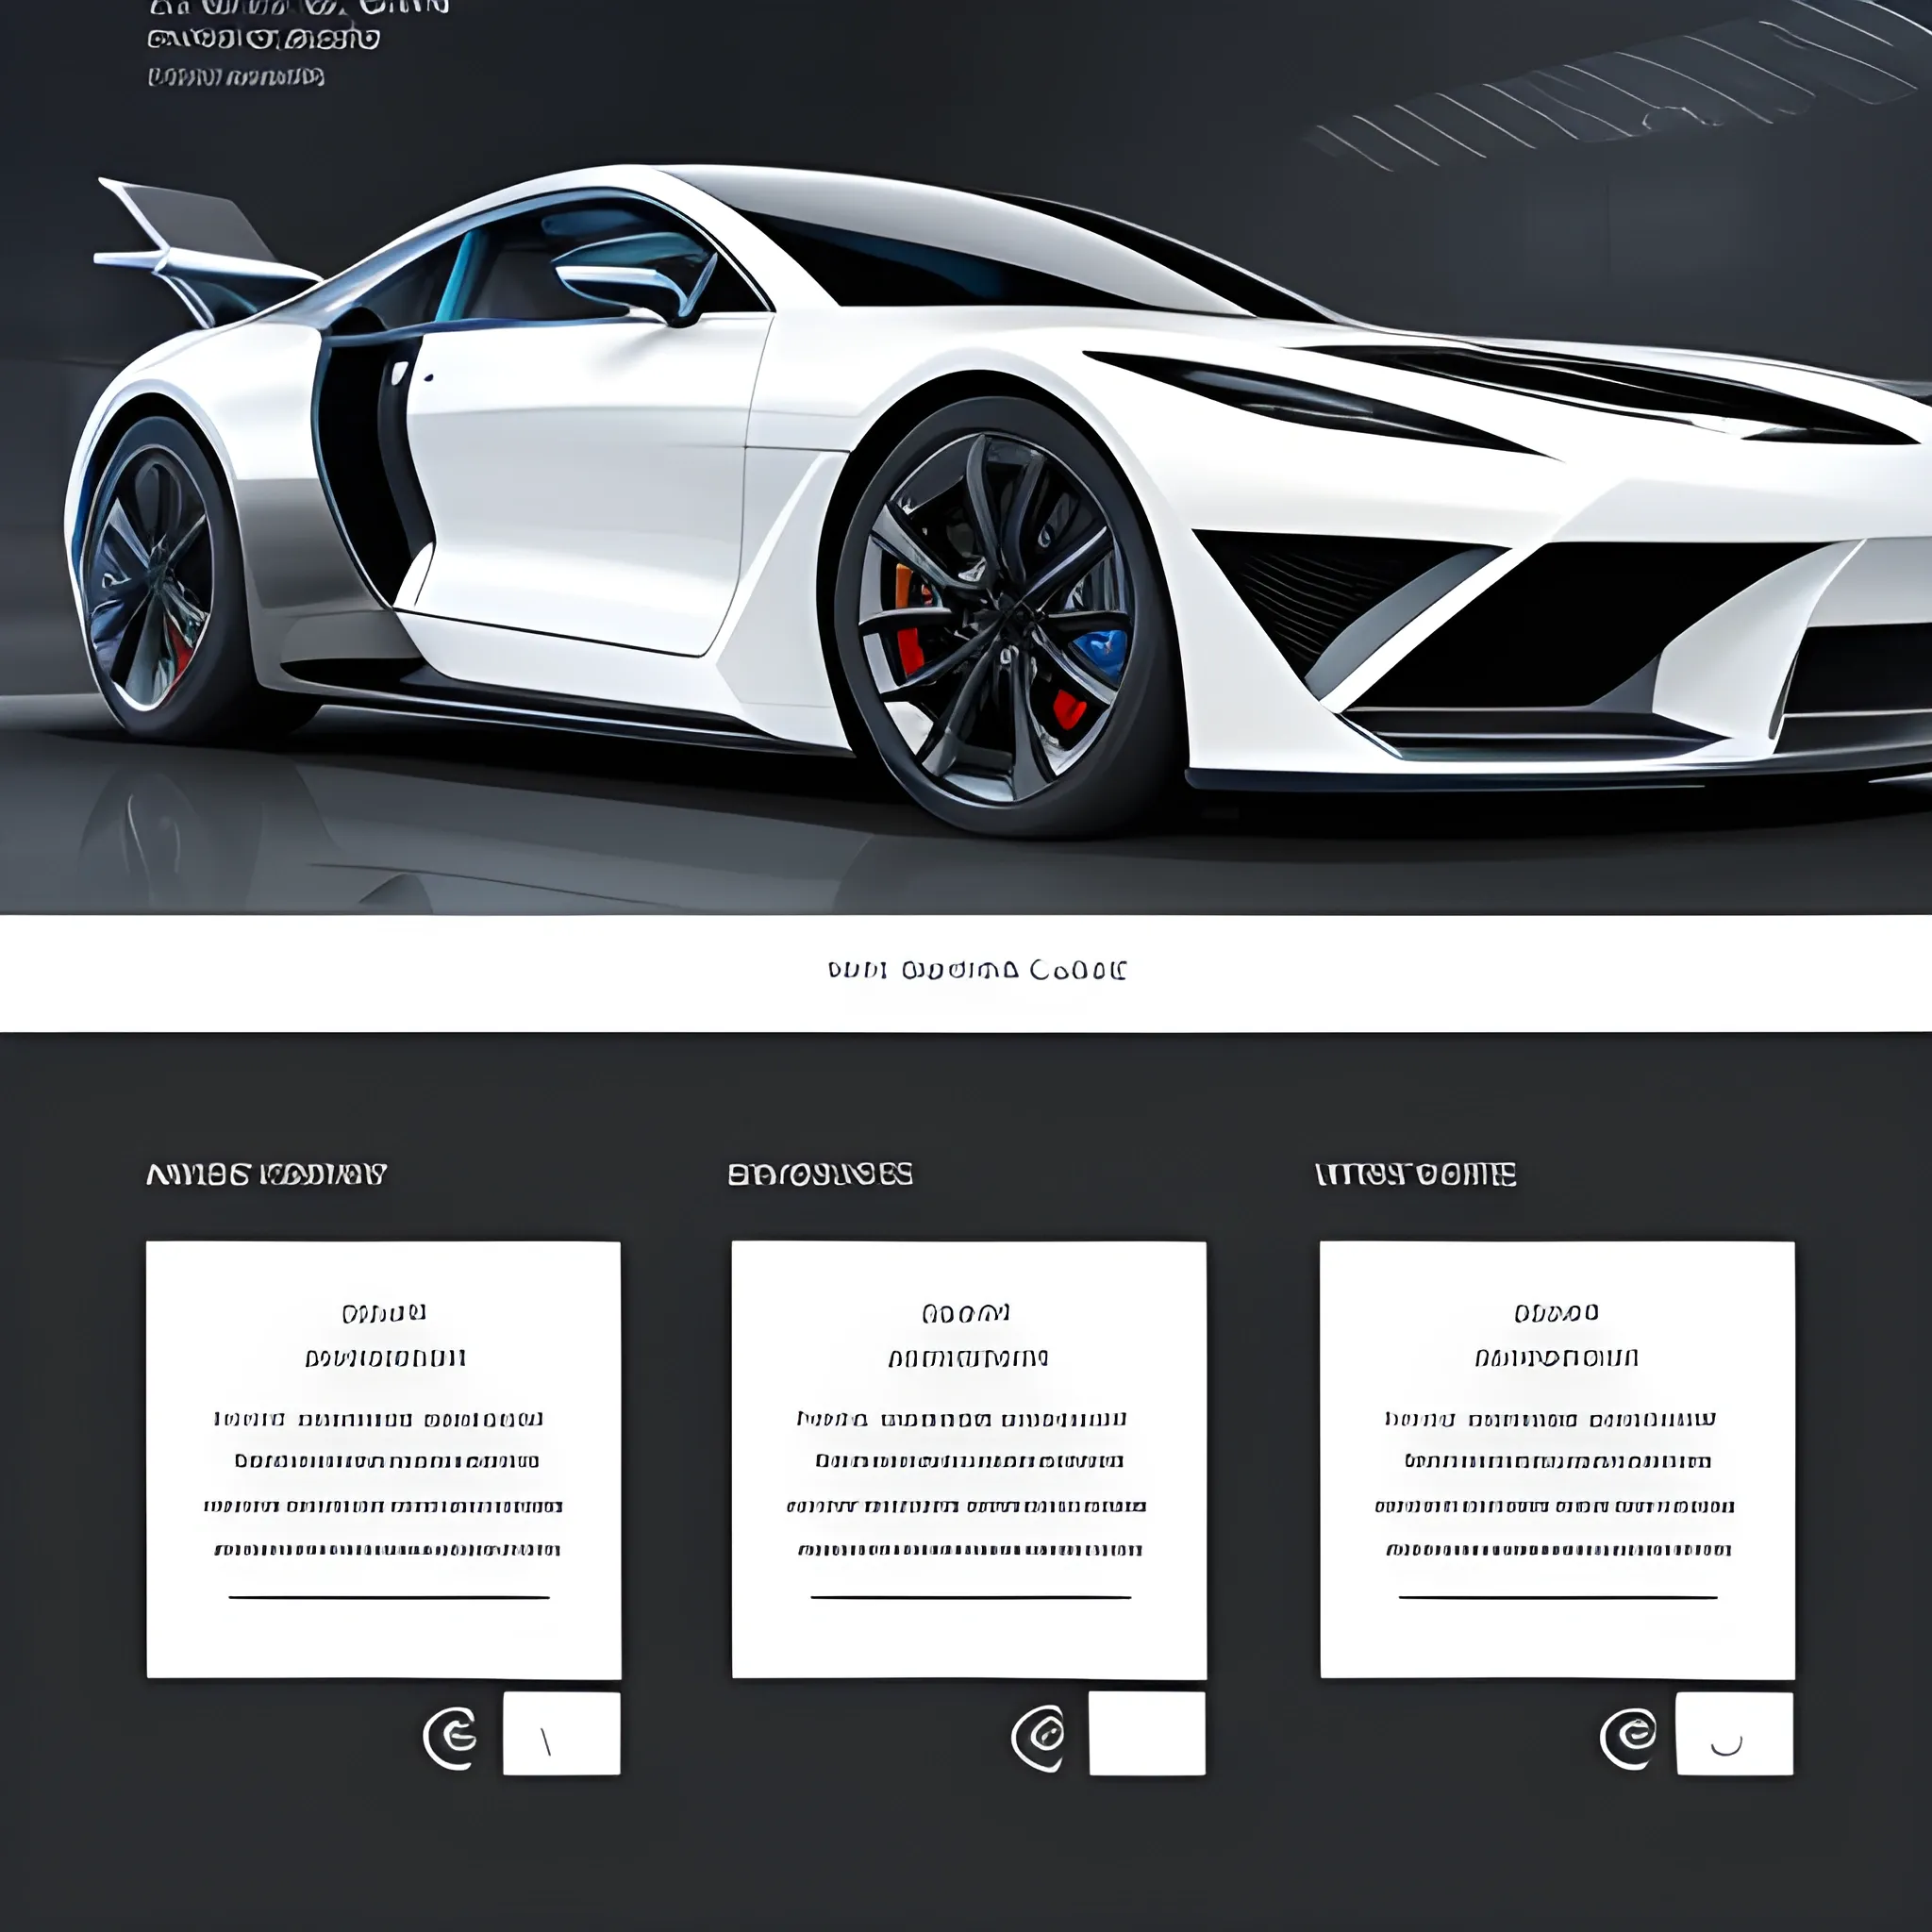
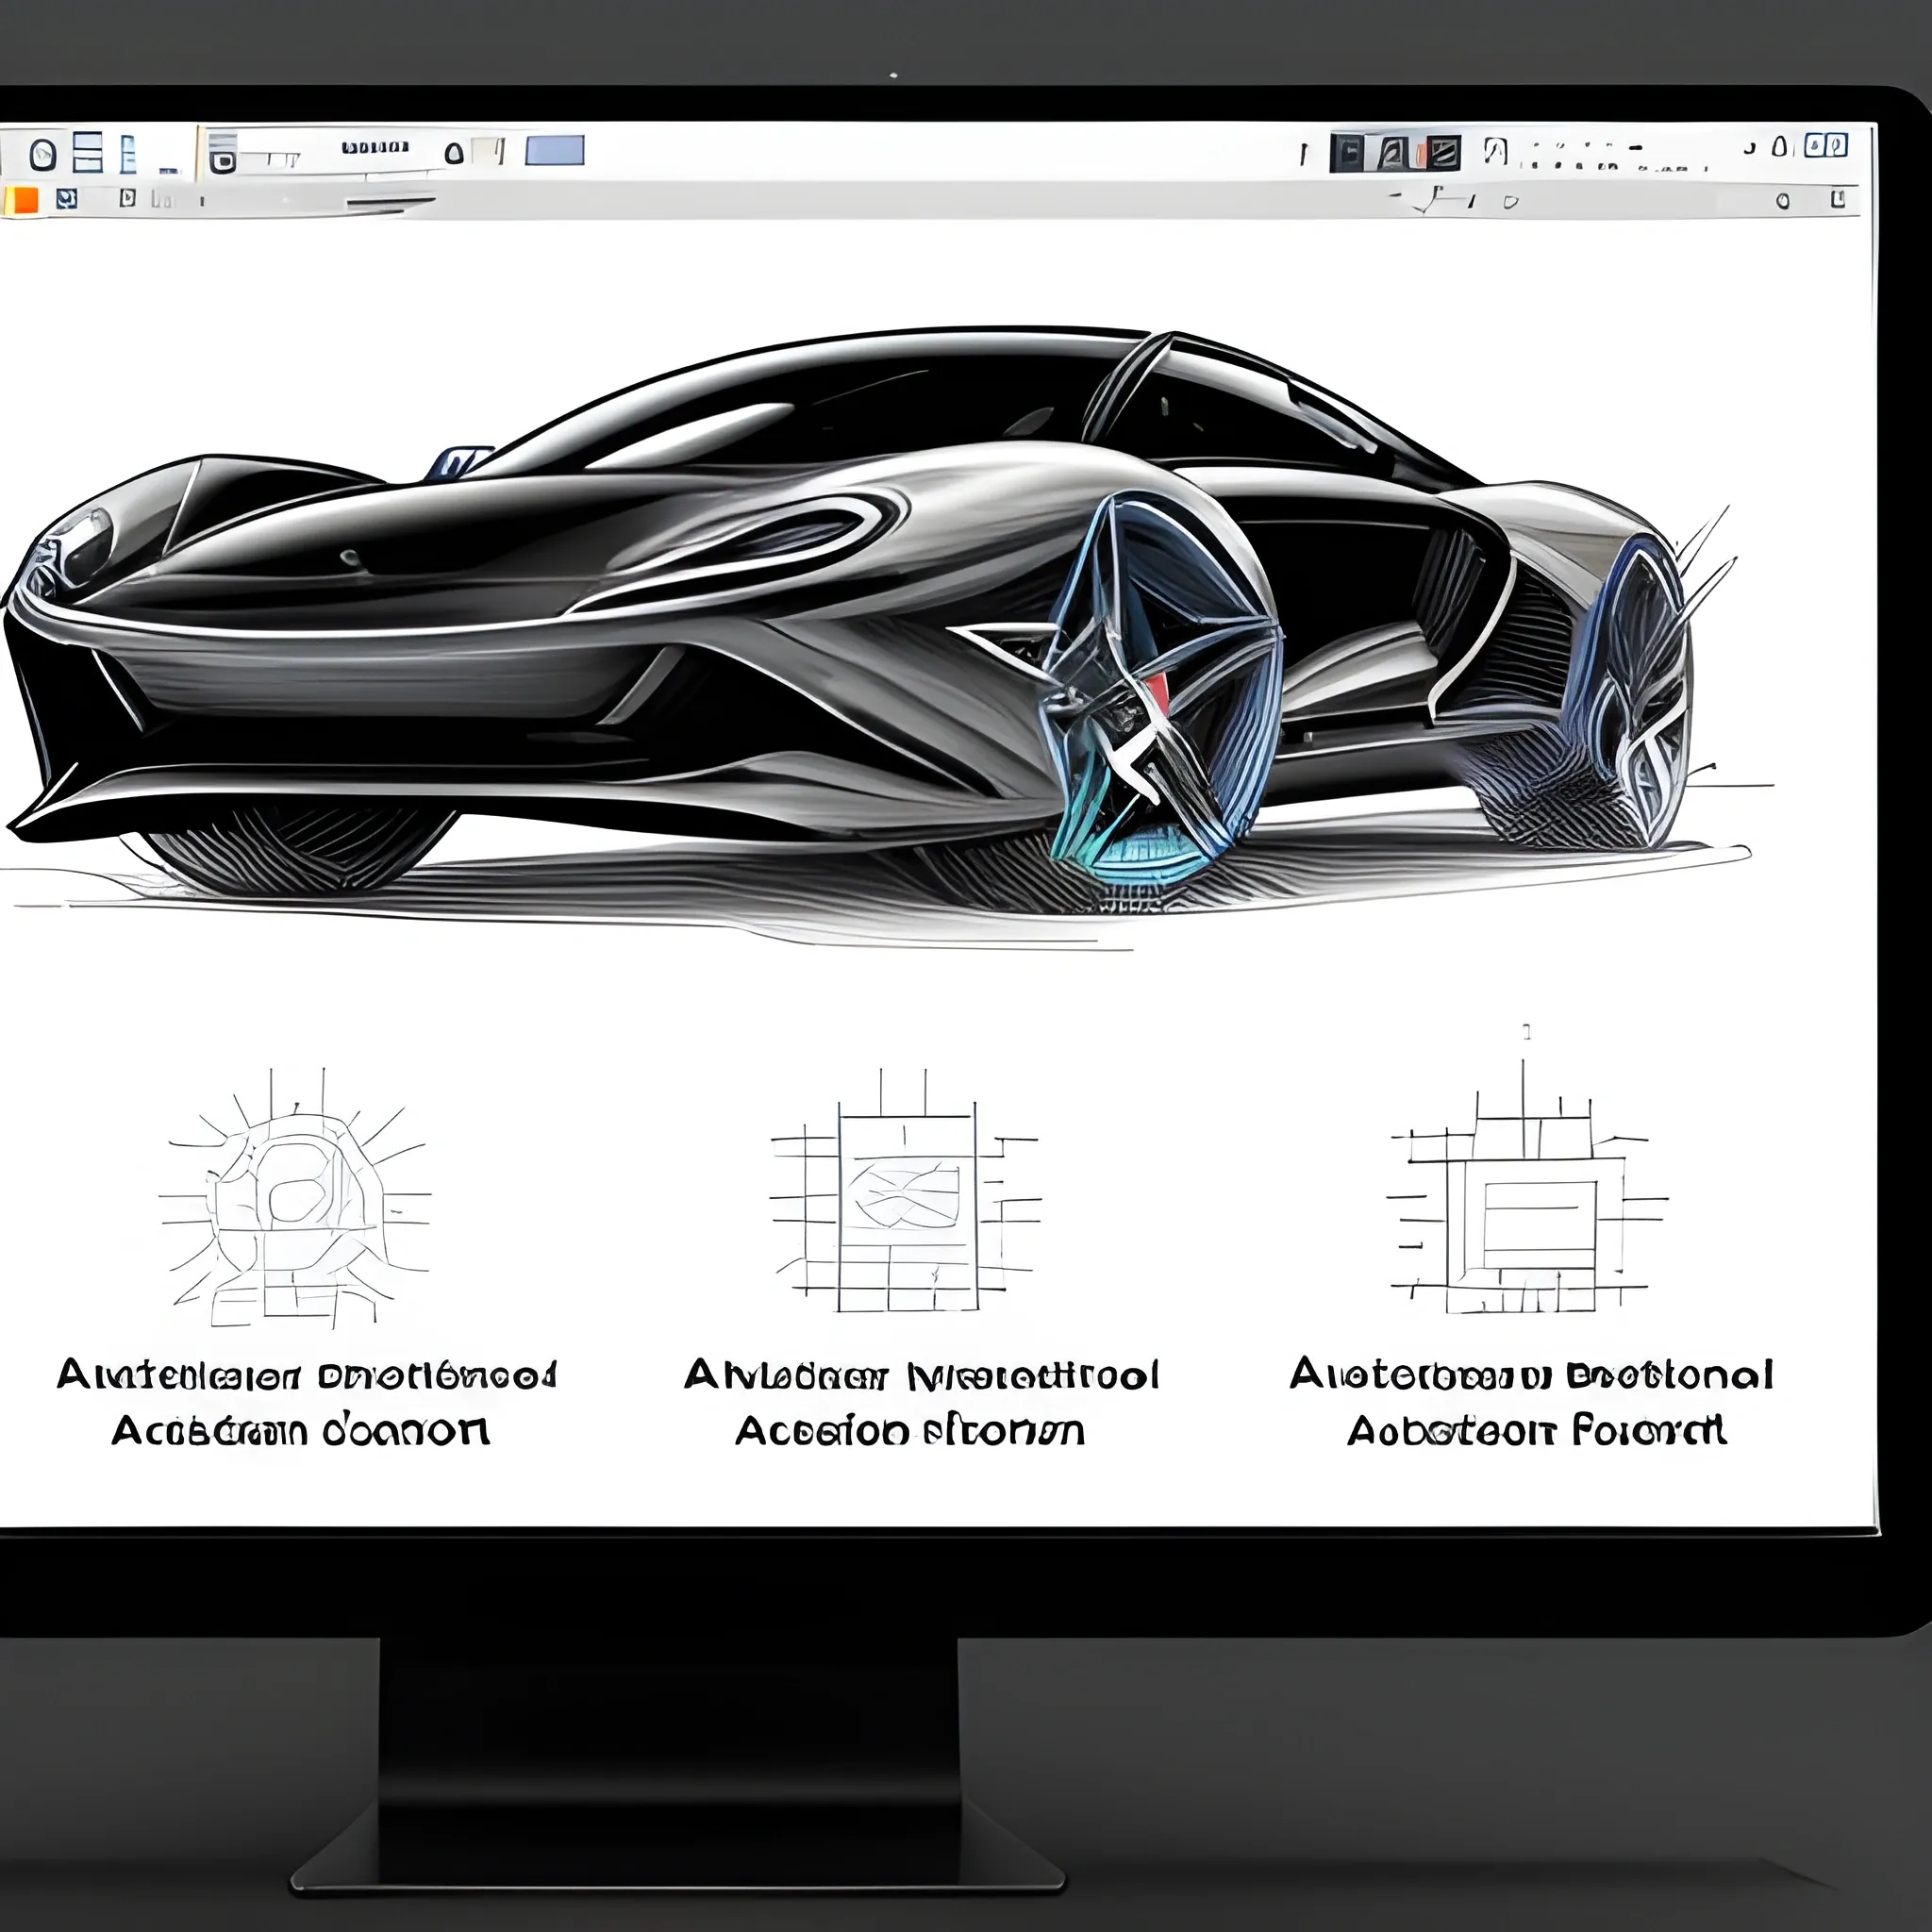
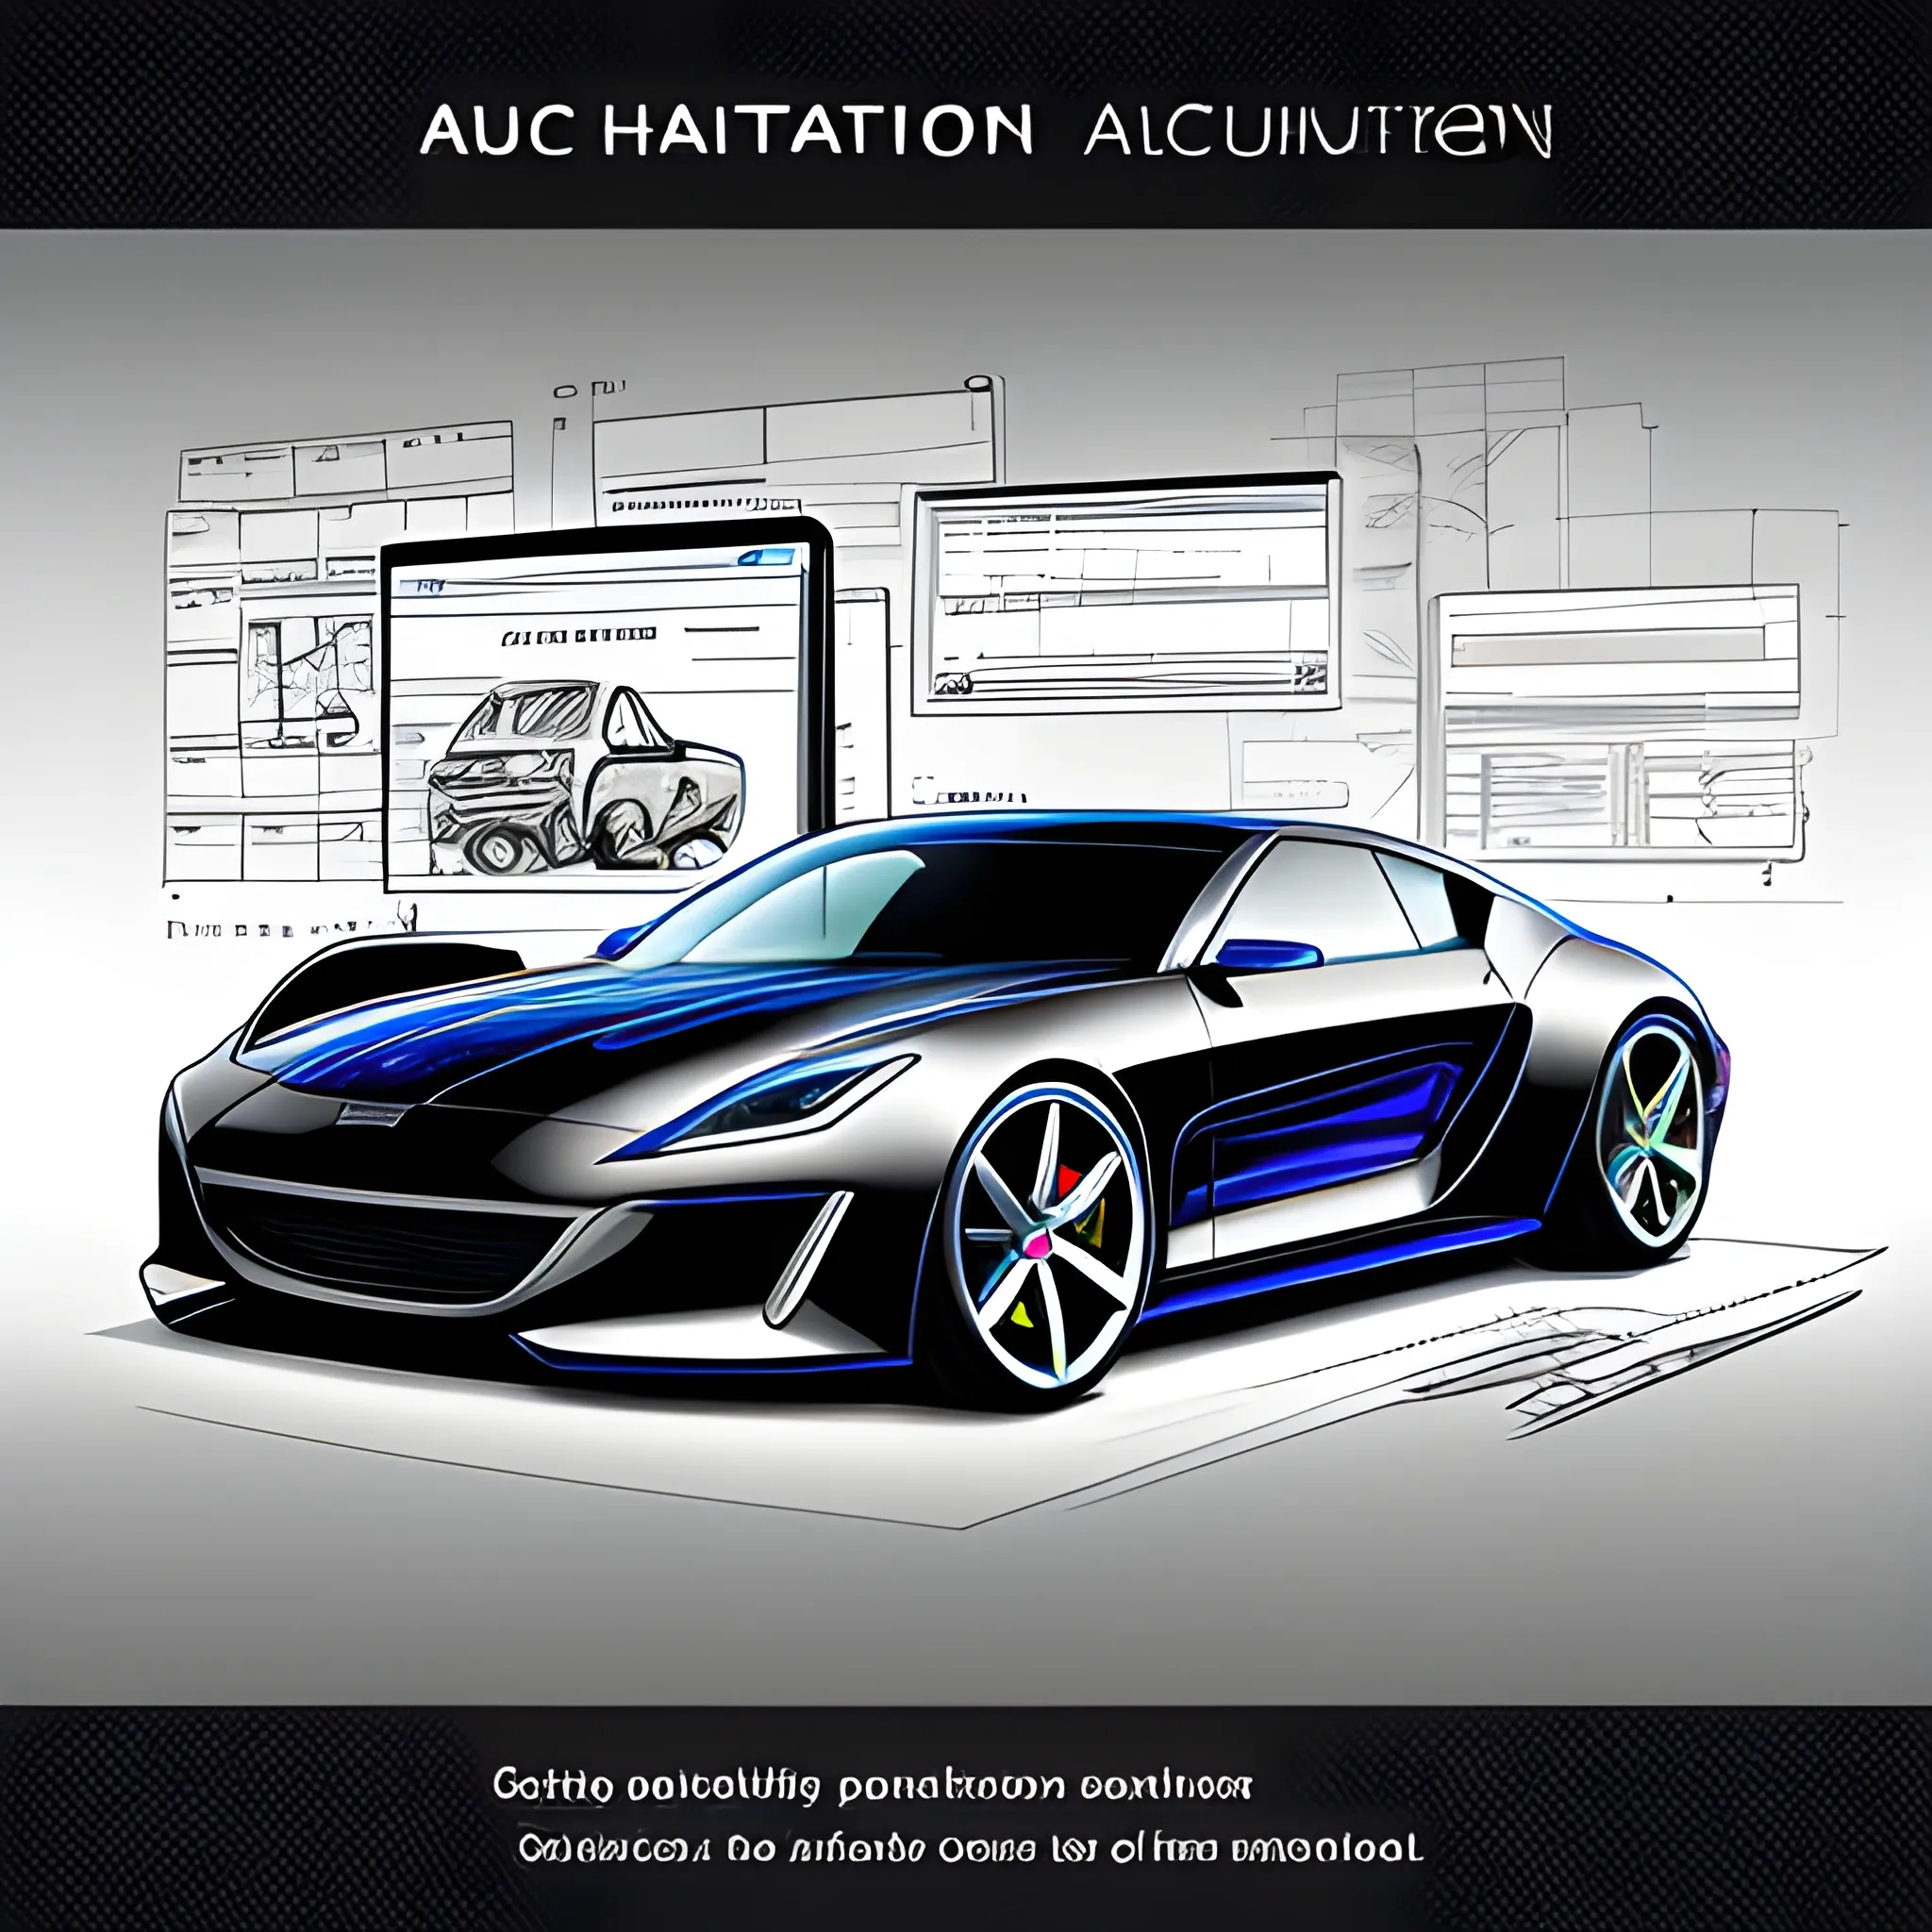
A premium splash screen for Automation 4 - Premier Edition , designed with a dark blue and silver color scheme , incorporating subtle textures that resemble carbon fiber , the company’s sphere logo prominently featured with a 3D effect , creating a dynamic and engaging visual experience , Artwork , 3D rendering using Blender with realistic lighting and shadows , Trippy , Pencil Sketch , , Water Color ,