Search Results for data
Explore AI generated designs, images, art and prompts by top community artists and designers.
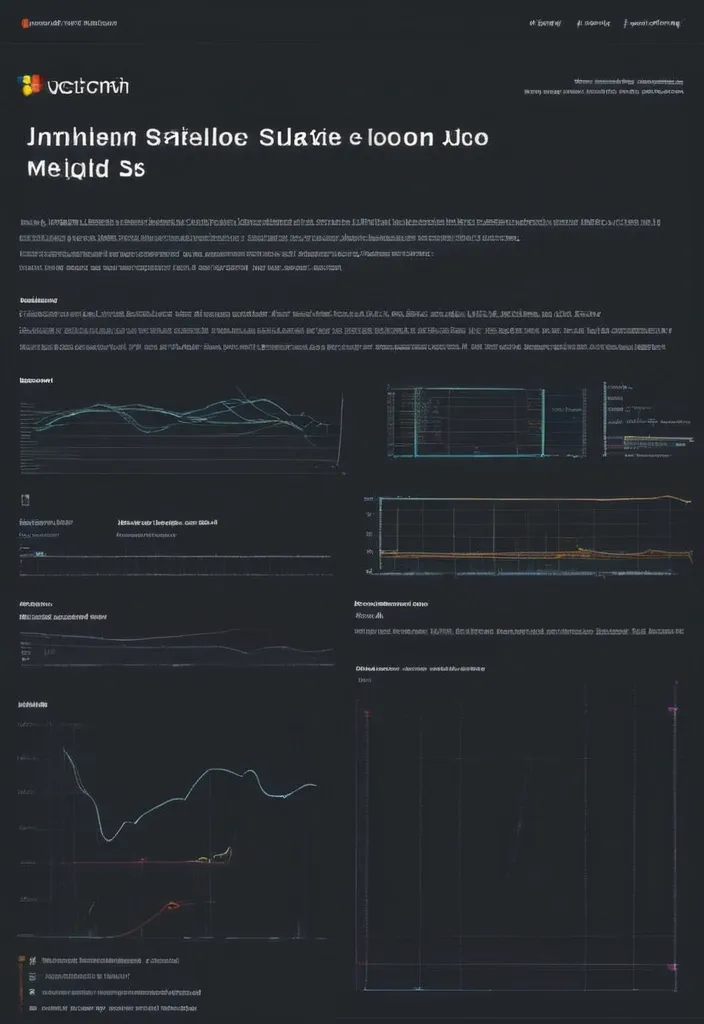

# Employee Growth ## 1. Introduction This document outlines the UI/UX requirements for a website that monitors employee growth in software engineering companies. The platform will enable employees to track their competencies , team leaders to manage their team’s development , and SuperAdmins to oversee competency standards and book recommendations. ### **Target Audience** - **Employees**: View their competency matrix , track progress , and participate in 1:1 meetings. - **Team Leaders**: Manage their team’s competency growth , schedule 1:1 meetings , and provide guidance. - **SuperAdmins**: Manage competencies , approve book recommendations , and oversee system-wide progress. ### **Key Goals** - Provide a structured competency matrix. - Enable employees to track and improve their skills. - Facilitate team leaders in managing and mentoring their team members. - Allow SuperAdmins to maintain and update the competency framework. ## 2. User Roles and Permissions ### **Employee** - View personal competency matrix. - Track progress and assigned competencies. - Suggest book chapters for competencies. - Participate in 1:1 meetings. ### **Team Leader** - View and manage team members' competency progress. - Assign competencies to team members for improvement. - Conduct 1:1 meetings and maintain notes. - Participate in 1:1 meetings with upper management. ### **SuperAdmin** - Add and manage competencies. - Assign recommended books and chapters to competencies. - Approve or reject suggested book chapters from employees. - Oversee system-wide competency progress. ## 3. Core Features & Pages ### **1. Login Page** - Username and password authentication. - Role-based redirection (Employee , Team Leader , SuperAdmin). ### **2. Main Page - Competency Matrix** - Displays all available competencies. - Clickable competencies to view details. ### **3. Engineer Page (Dashboard)** - Charts displaying progress in current role. - Percentage completion of competencies required for the next level. ### **4. Team Page (For Team Leaders)** - List of engineers under management. - Overview of each engineer’s competencies and their current focus areas. ### **5. 1:1 Meetings Page(optional)** - List of scheduled and past 1:1 meetings. - Notepad feature for meeting notes. - History of past competencies assigned and progress. ### **6. SuperAdmin Competency Management** - Add , edit , or remove competencies. - Assign recommended book chapters. - Review and approve book suggestions from users. ## 4. User Flow 1. User logs in. 2. Employees navigate to their competency matrix. 3. Team leaders access the team page to monitor and assign competencies. 4. Employees and team leaders conduct 1:1 meetings. 5. SuperAdmins manage competencies and book recommendations. ## 5. Design & Style Guidelines - **Primary Color**: To be specified. - **UI Style**: Clean , modern , and intuitive. - **Typography**: Readable font with sufficient spacing. ## 6. Data & Metrics - Competency scores (1-5 scale) displayed in charts. - Overall role mastery percentage. - Historical competency trends. ## 7. Interaction & Feedback (Optional) - Clickable competencies with tooltips and descriptions. - Notifications for assigned competencies. - Confirmation prompts for major actions. ,

# Employee Growth ## 1. Introduction This document outlines the UI/UX requirements for a website that monitors employee growth in software engineering companies. The platform will enable employees to track their competencies , team leaders to manage their team’s development , and SuperAdmins to oversee competency standards and book recommendations. ### **Target Audience** - **Employees**: View their competency matrix , track progress , and participate in 1:1 meetings. - **Team Leaders**: Manage their team’s competency growth , schedule 1:1 meetings , and provide guidance. - **SuperAdmins**: Manage competencies , approve book recommendations , and oversee system-wide progress. ### **Key Goals** - Provide a structured competency matrix. - Enable employees to track and improve their skills. - Facilitate team leaders in managing and mentoring their team members. - Allow SuperAdmins to maintain and update the competency framework. ## 2. User Roles and Permissions ### **Employee** - View personal competency matrix. - Track progress and assigned competencies. - Suggest book chapters for competencies. - Participate in 1:1 meetings. ### **Team Leader** - View and manage team members' competency progress. - Assign competencies to team members for improvement. - Conduct 1:1 meetings and maintain notes. - Participate in 1:1 meetings with upper management. ### **SuperAdmin** - Add and manage competencies. - Assign recommended books and chapters to competencies. - Approve or reject suggested book chapters from employees. - Oversee system-wide competency progress. ## 3. Core Features & Pages ### **1. Login Page** - Username and password authentication. - Role-based redirection (Employee , Team Leader , SuperAdmin). ### **2. Main Page - Competency Matrix** - Displays all available competencies. - Clickable competencies to view details. ### **3. Engineer Page (Dashboard)** - Charts displaying progress in current role. - Percentage completion of competencies required for the next level. ### **4. Team Page (For Team Leaders)** - List of engineers under management. - Overview of each engineer’s competencies and their current focus areas. ### **5. 1:1 Meetings Page(optional)** - List of scheduled and past 1:1 meetings. - Notepad feature for meeting notes. - History of past competencies assigned and progress. ### **6. SuperAdmin Competency Management** - Add , edit , or remove competencies. - Assign recommended book chapters. - Review and approve book suggestions from users. ## 4. User Flow 1. User logs in. 2. Employees navigate to their competency matrix. 3. Team leaders access the team page to monitor and assign competencies. 4. Employees and team leaders conduct 1:1 meetings. 5. SuperAdmins manage competencies and book recommendations. ## 5. Design & Style Guidelines - **Primary Color**: To be specified. - **UI Style**: Clean , modern , and intuitive. - **Typography**: Readable font with sufficient spacing. ## 6. Data & Metrics - Competency scores (1-5 scale) displayed in charts. - Overall role mastery percentage. - Historical competency trends. ## 7. Interaction & Feedback (Optional) - Clickable competencies with tooltips and descriptions. - Notifications for assigned competencies. - Confirmation prompts for major actions. ,
# Employee Growth ## 1. Introduction This document outlines the UI/UX requirements for a website that monitors employee growth in software engineering companies. The platform will enable employees to track their competencies , team leaders to manage their team’s development , and SuperAdmins to oversee competency standards and book recommendations. ### **Target Audience** - **Employees**: View their competency matrix , track progress , and participate in 1:1 meetings. - **Team Leaders**: Manage their team’s competency growth , schedule 1:1 meetings , and provide guidance. - **SuperAdmins**: Manage competencies , approve book recommendations , and oversee system-wide progress. ### **Key Goals** - Provide a structured competency matrix. - Enable employees to track and improve their skills. - Facilitate team leaders in managing and mentoring their team members. - Allow SuperAdmins to maintain and update the competency framework. ## 2. User Roles and Permissions ### **Employee** - View personal competency matrix. - Track progress and assigned competencies. - Suggest book chapters for competencies. - Participate in 1:1 meetings. ### **Team Leader** - View and manage team members' competency progress. - Assign competencies to team members for improvement. - Conduct 1:1 meetings and maintain notes. - Participate in 1:1 meetings with upper management. ### **SuperAdmin** - Add and manage competencies. - Assign recommended books and chapters to competencies. - Approve or reject suggested book chapters from employees. - Oversee system-wide competency progress. ## 3. Core Features & Pages ### **1. Login Page** - Username and password authentication. - Role-based redirection (Employee , Team Leader , SuperAdmin). ### **2. Main Page - Competency Matrix** - Displays all available competencies. - Clickable competencies to view details. ### **3. Engineer Page (Dashboard)** - Charts displaying progress in current role. - Percentage completion of competencies required for the next level. ### **4. Team Page (For Team Leaders)** - List of engineers under management. - Overview of each engineer’s competencies and their current focus areas. ### **5. 1:1 Meetings Page(optional)** - List of scheduled and past 1:1 meetings. - Notepad feature for meeting notes. - History of past competencies assigned and progress. ### **6. SuperAdmin Competency Management** - Add , edit , or remove competencies. - Assign recommended book chapters. - Review and approve book suggestions from users. ## 4. User Flow 1. User logs in. 2. Employees navigate to their competency matrix. 3. Team leaders access the team page to monitor and assign competencies. 4. Employees and team leaders conduct 1:1 meetings. 5. SuperAdmins manage competencies and book recommendations. ## 5. Design & Style Guidelines - **Primary Color**: To be specified. - **UI Style**: Clean , modern , and intuitive. - **Typography**: Readable font with sufficient spacing. ## 6. Data & Metrics - Competency scores (1-5 scale) displayed in charts. - Overall role mastery percentage. - Historical competency trends. ## 7. Interaction & Feedback (Optional) - Clickable competencies with tooltips and descriptions. - Notifications for assigned competencies. - Confirmation prompts for major actions. ,
A futuristic , sleek YouTube banner design for a channel dedicated to Artificial Intelligence. The background is a digital , high-tech landscape with abstract geometric shapes , neon lines , and glowing data streams. The central theme is a glowing AI brain or neural network pattern , symbolizing intelligence and innovation. The color palette includes deep blues , electric purples , and neon greens , creating a techy , cyberpunk vibe. The text space is clean , modern , and ready for the channel name and tagline. The atmosphere is cutting-edge and sophisticated , with a minimalist yet bold design , in high-resolution , ArtStation-quality detail. ,

Design a ghostly cyber-hacker with a hood and a gas mask , just two piercing neon eyes and a distorted , glitching aura. The figure is surrounded by floating runes and fragmented data streams as if manipulating the digital realm with dark magic. The typography should look like a hacked system message infused with occult symbolism.” ,

Design a ghostly cyber-hacker with a hood and a gas mask , just two piercing neon eyes and a distorted , glitching aura. The figure is surrounded by floating runes and fragmented data streams as if manipulating the digital realm with dark magic. The typography should look like a hacked system message infused with occult symbolism.” ,
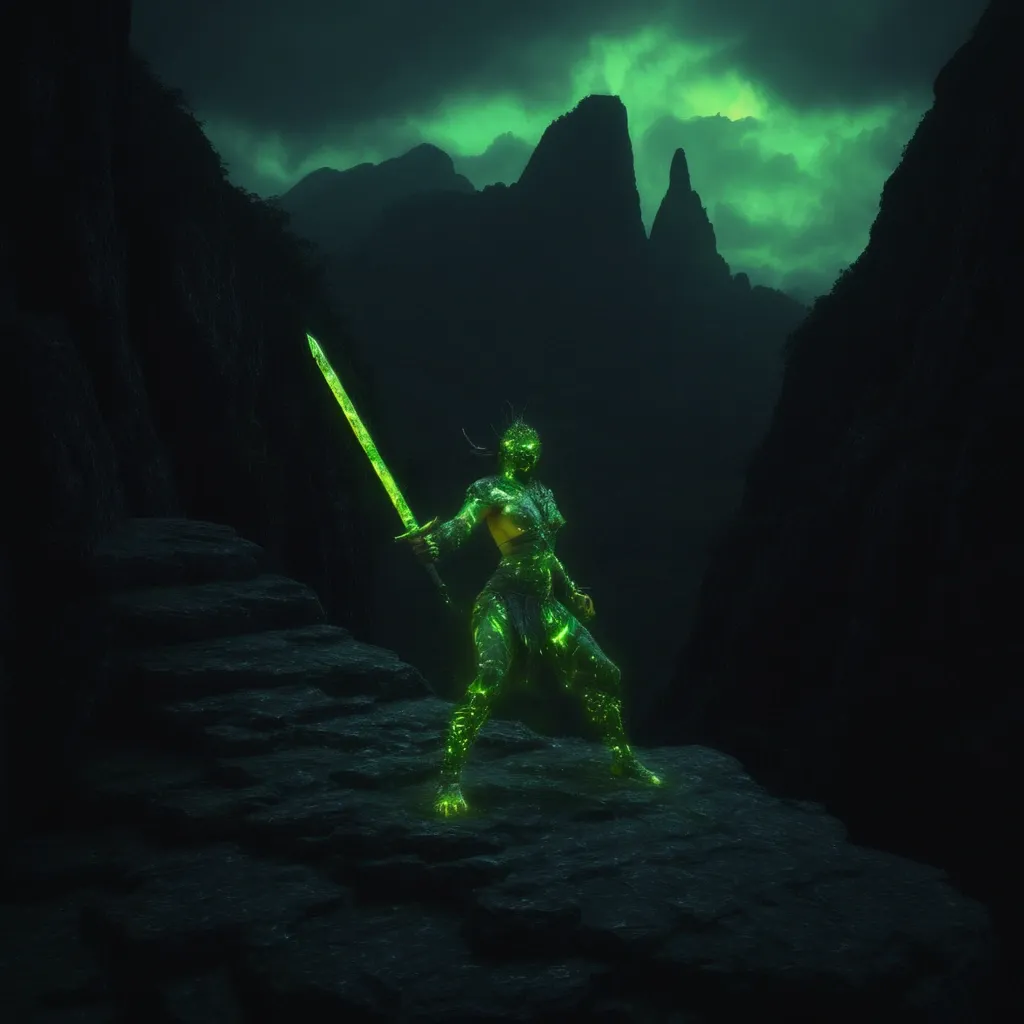
A Fragmented Echoes Montage of a fantasy Predator-woman with green-lemon glowing eyes , standing on the edge of mountain rock in mid-night , Mayan wild-Elemental Sword in his hands inscribed with raw elemental energy speeding through a mountain pass , where overlapping images create a sense of movement via Data Mosh: Employ azure and amber to create the distorted perspective , revealing the true form when viewed correctly , ,
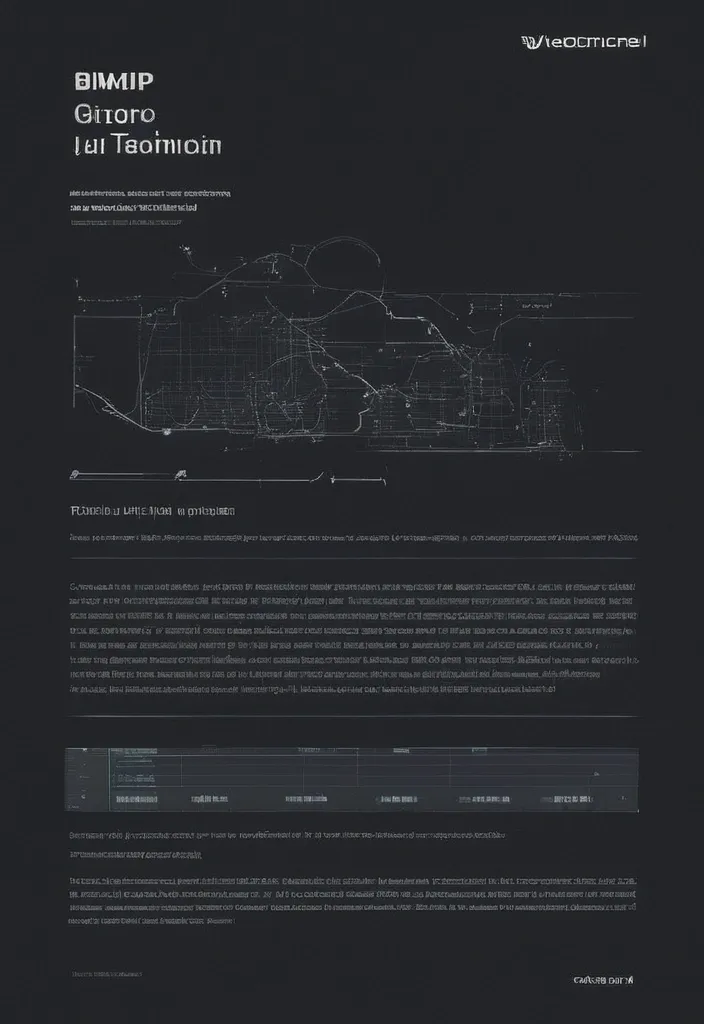
data quality platform based on conceptual vision of the interface of a platform for creating , running , and monitoring data quality tests according to the provided terms of reference. The platform integrates functionality for data analysts and team leaders , providing a complete data quality management cycle. ## General Interface Structure ### Main Navigation Menu The platform interface shall contain a main side menu with sections: - Dashboard (overview and statistics) - Tests (test management) - Runs (run history) - Schedules (run scheduling) - Settings (configuration and integrations) - Documentation ,

generate drafts for data quality platform based on conceptual vision of the interface of a platform for creating , running , and monitoring data quality tests according to the provided terms of reference. The platform integrates functionality for data analysts and team leaders , providing a complete data quality management cycle. ## General Interface Structure ### Main Navigation Menu The platform interface shall contain a main side menu with sections: - Dashboard (overview and statistics) - Tests (test management) - Runs (run history) - Schedules (run scheduling) - Settings (configuration and integrations) - Documentation ,
1. Главная форма (список событий) Элементы: Список событий (DataGridView) с колонками: Название , Дата , Категория. Кнопки: "Добавить" — открывает форму добавления. "Редактировать" — открывает форму редактирования выбранного события. "Удалить" — удаляет выбранное событие. "Фильтровать" — открывает окно фильтрации. Поле поиска (TextBox) с кнопкой "Найти". Макет: Copy [===========================] [ Поиск: _________[Найти] ] [===========================] [ Название | Дата | Категория ] [----------------|-----------|-------------] [ Пироги | 20.05.2024| Выпечка ] [ Суши | 22.05.2024| Азиатская ] [===========================] [ [Добавить] [Редактировать] [Удалить] ] нарисуй в виде макета приложения ,
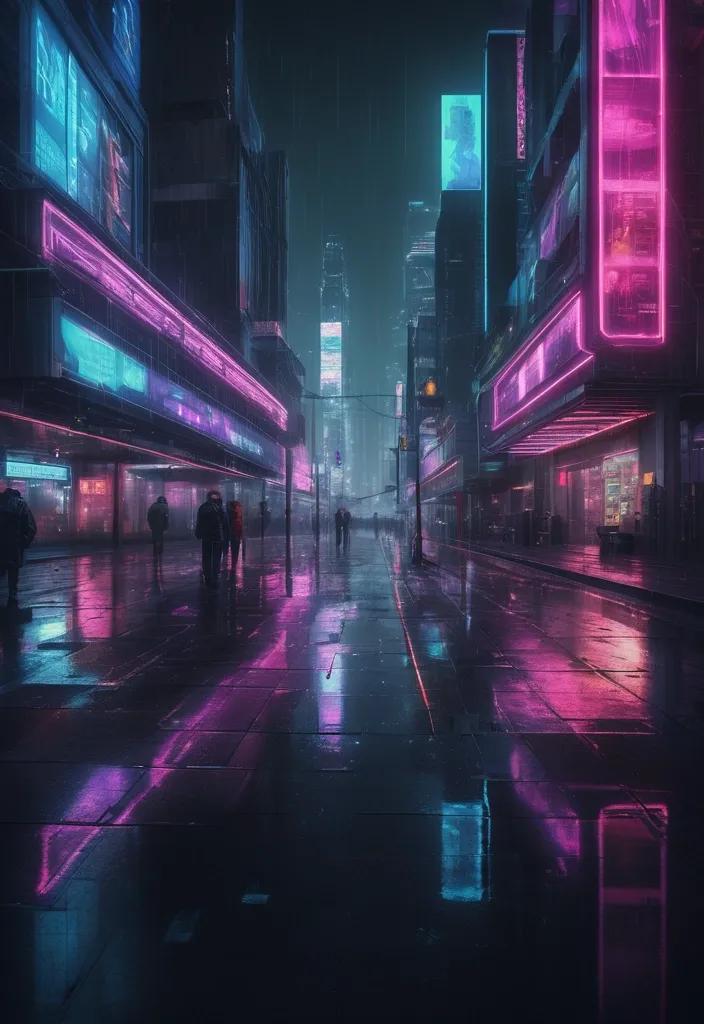
Cityscape: Depict a sprawling cityscape dominated by towering skyscrapers , elevated highways , and labyrinthine alleyways. The architecture should reflect a fusion of futuristic designs , incorporating sleek lines , geometric shapes , and glass facades. Pay attention to the scale and density of buildings to emphasize the city's vastness.Neon Lights: Infuse the city with vibrant and luminous neon lights that cast an otherworldly glow upon the streets. Incorporate a variety of neon colors such as electric blues , intense purples , and vibrant pinks to create a mesmerizing and immersive atmosphere.Rain and Reflections: Integrate rainfall into your composition to add an element of dynamism and to enhance the cyberpunk aesthetic. Show raindrops cascading down glass surfaces , creating rivulets and puddles that reflect the neon lights and cityscape. These reflections should add depth and visual interest to your artwork.Characters: Include one or more characters that embody the spirit of the cyberpunk genre. They can be enigmatic hackers , fearless mercenaries , or mysterious individuals shrouded in futuristic attire. Pay attention to their poses , clothing , and facial expressions to convey a sense of resilience , determination , or rebellion.Augmented Reality: Introduce elements of augmented reality or holographic projections to showcase the city's technological advancements. This could include holographic advertisements , virtual graffiti , or futuristic interfaces hovering in the air. Use a combination of translucent and opaque elements to create depth and realism.High-Tech Gadgets: Incorporate advanced gadgets or cybernetic enhancements to highlight the futuristic nature of the setting. This could involve characters with augmented limbs , virtual reality headsets , or sleek handheld devices. Ensure these elements seamlessly integrate into the overall composition and enhance the cyberpunk atmosphere.Industrial Elements: Introduce industrial elements that hint at the city's darker underbelly. This could include smokestacks , factory silhouettes , or billowing steam , adding texture and a sense of realism to the urban environment.Dramatic Lighting: Utilize dramatic lighting techniques to create contrast and enhance the atmosphere of your artwork. Experiment with harsh light sources , deep shadows , and dynamic lighting effects to evoke a sense of mystery , danger , or intrigue.Technological Interfaces: Incorporate futuristic interfaces and displays within the cityscape or on the characters themselves. These can include holographic screens , floating data streams , or heads-up displays. Use intricate details and intricate patterns to add complexity and depth to these elements.Composition and Perspective: Craft a composition that is visually compelling and dynamic. Experiment with unusual perspectives , such as low-angle or high-angle shots , to create a sense of scale and depth. Utilize leading lines and vanishing points to guide the viewer's eye through the scene and draw them into the cyberpunk world you've created. ,
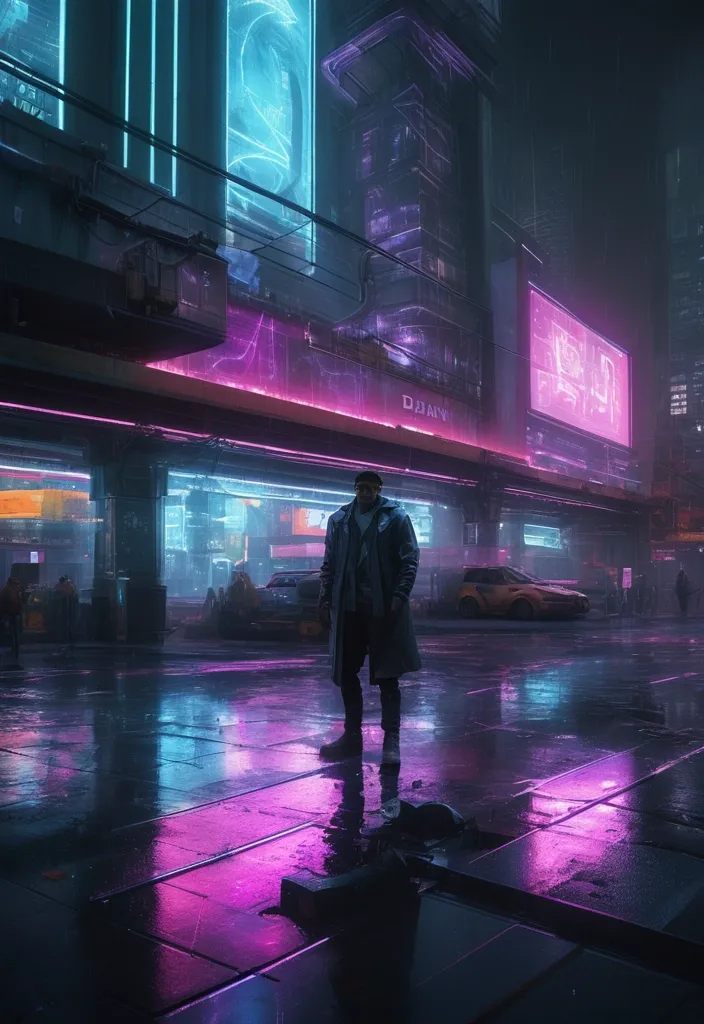
Cityscape: Depict a sprawling cityscape dominated by towering skyscrapers , elevated highways , and labyrinthine alleyways. The architecture should reflect a fusion of futuristic designs , incorporating sleek lines , geometric shapes , and glass facades. Pay attention to the scale and density of buildings to emphasize the city's vastness.Neon Lights: Infuse the city with vibrant and luminous neon lights that cast an otherworldly glow upon the streets. Incorporate a variety of neon colors such as electric blues , intense purples , and vibrant pinks to create a mesmerizing and immersive atmosphere.Rain and Reflections: Integrate rainfall into your composition to add an element of dynamism and to enhance the cyberpunk aesthetic. Show raindrops cascading down glass surfaces , creating rivulets and puddles that reflect the neon lights and cityscape. These reflections should add depth and visual interest to your artwork.Characters: Include one or more characters that embody the spirit of the cyberpunk genre. They can be enigmatic hackers , fearless mercenaries , or mysterious individuals shrouded in futuristic attire. Pay attention to their poses , clothing , and facial expressions to convey a sense of resilience , determination , or rebellion.Augmented Reality: Introduce elements of augmented reality or holographic projections to showcase the city's technological advancements. This could include holographic advertisements , virtual graffiti , or futuristic interfaces hovering in the air. Use a combination of translucent and opaque elements to create depth and realism.High-Tech Gadgets: Incorporate advanced gadgets or cybernetic enhancements to highlight the futuristic nature of the setting. This could involve characters with augmented limbs , virtual reality headsets , or sleek handheld devices. Ensure these elements seamlessly integrate into the overall composition and enhance the cyberpunk atmosphere.Industrial Elements: Introduce industrial elements that hint at the city's darker underbelly. This could include smokestacks , factory silhouettes , or billowing steam , adding texture and a sense of realism to the urban environment.Dramatic Lighting: Utilize dramatic lighting techniques to create contrast and enhance the atmosphere of your artwork. Experiment with harsh light sources , deep shadows , and dynamic lighting effects to evoke a sense of mystery , danger , or intrigue.Technological Interfaces: Incorporate futuristic interfaces and displays within the cityscape or on the characters themselves. These can include holographic screens , floating data streams , or heads-up displays. Use intricate details and intricate patterns to add complexity and depth to these elements.Composition and Perspective: Craft a composition that is visually compelling and dynamic. Experiment with unusual perspectives , such as low-angle or high-angle shots , to create a sense of scale and depth. Utilize leading lines and vanishing points to guide the viewer's eye through the scene and draw them into the cyberpunk world you've created. ,

Create a vibrant and modern 3D illustration for a marketing and advertising-themed banner. The image should include: 3D growth charts , upward-pointing arrows , a laptop with analytical data on the screen , chatbot characters in 3D , landing pages with interface elements , and ad banners. Add elements related to preparing for ad campaigns: 3D checklists , a notebook with a plan , a calendar , and analytical tools. Use bright colors like blue , orange , white , and green to convey professionalism , growth , and success. The style should be modern 3D rendering with soft shadows , realistic textures , and subtle neon glows for accents. The background should be minimalistic , with abstract 3D shapes or a gradient , ensuring it doesn’t distract from the main elements. Lighting should be soft , with a focus on the central objects. ,
A hyper-realistic futuristic megacity in the year 3000 , built entirely from glowing , interconnected cubes with razor-sharp edges and intricate geometric precision. The towering skyscrapers , suspended bridges , and hovering platforms emit a radiant neon glow dominated by deep blues and icy cyan tones , casting crisp reflections on the sleek metallic and glass-like surfaces below. The entire cityscape is bathed in an otherworldly , cool blue illumination , creating a mesmerizing yet highly realistic atmosphere. In the foreground , a massive UFO with an ultra-sleek metallic surface hovers ominously. Its structure is lined with intricate glowing circuits and pulsating blue energy patterns , giving it an advanced , almost alien aesthetic. The craft’s propulsion system emits a soft but intense blue light , illuminating the structures beneath it. Above the city , countless futuristic flying vehicles—sleek personal pods , anti-gravity taxis , and enormous levitating cargo ships—navigate through the sky on invisible transit pathways. Their smooth , aerodynamic forms and illuminated trails blend seamlessly into the city’s luminous environment. Holographic billboards with sharp , high-resolution projections float between buildings , displaying futuristic advertisements and data streams that flow like glowing rivers of light. The sky is a breathtaking cosmic expanse , featuring swirling nebulae , distant planetary rings , and orbiting space stations , all rendered with extreme clarity. Every detail , from the sharp reflections on the structures to the crisp outlines of the aerial traffic , is captured with stunning realism , creating an immersive vision of the far future. ,

A professional consultant in a business-casual outfit training two workers on a mail sorting machine in a factory. The consultant gestures towards the digital screen , displaying operational data while the workers listen attentively. The factory environment includes a few mail sorting machines with conveyor belts , sorting trays , and stacks of labeled mail bins. Overhead industrial lighting casts soft shadows , enhancing realism. Highly detailed , sharp focus , photorealistic factory scene. Negative prompt: blurry details , cartoonish elements , unrealistic expressions. ,
Halloween portrait in costume"Create a futuristic digital illustration showcasing the rapid growth and impact of Decentralized Finance (DeFi) in 2024. The scene should feature a high-tech , cyberpunk-style financial ecosystem where blockchain-powered platforms replace traditional banks and brokers. In the center , display a glowing DeFi network hub with users connecting from around the world , symbolizing global accessibility and financial inclusion. Surrounding the hub , include holographic smart contracts , automated lending pools , and decentralized exchanges (DEXs) , illustrating DeFi’s major use cases. The background should feature data screens displaying the rise of Total Value Locked (TVL) in DeFi from $36 billion to $60 billion , emphasizing the growing trust in decentralized solutions. Use neon blue , purple , and gold accents to create a sleek , futuristic financial atmosphere." The dimension should be in landscape mode ,
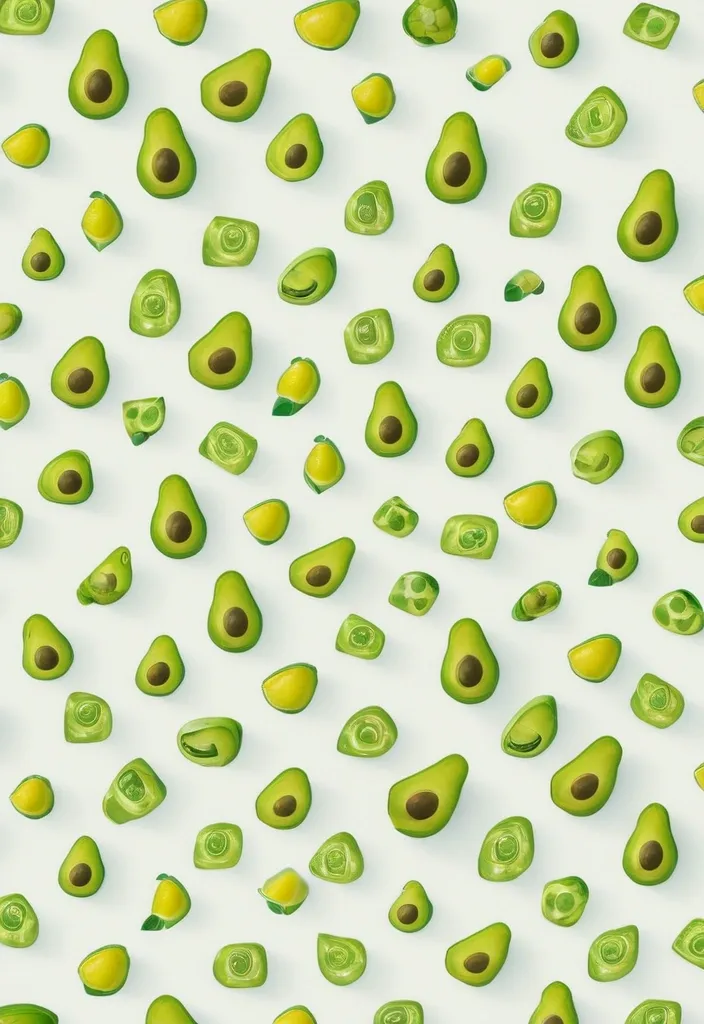
"A vibrant cartoon-style roll-up banner design , 1.2m wide x 2m tall , for a fintech company targeting individual investors. Background: lively avocado-shaped central motif with glowing AI data streams and dollar symbols ($) orbiting around it , in fresh green (#7ABF5E) and sunny yellow (#FFD700) color palette. Top section: bold placement for a cartoon avocado logo with embedded 'A' symbol and company name 'Avocado Plus Technologies Inc.' in clean white sans-serif font. Center tagline: 'AI-Powered Wealth Growth — Match Your Risk , Grow Your Future!' in bold yellow text. Bottom section: contact info (Address/Avocado Plus Technologies Inc. , Email/iris.wang@avocadoplus.me , Website/avocadoplus.me) in minimalist white blocks. High-resolution , playful yet professional , 300dpi , print-ready." ,

Fairness means ensuring your analysis doesn't create or reinforce bias. This can be challenging , but if the analysis is not objective , the conclusions can be misleading and even harmful. In this reading , you’re going to explore some best practices you can use to guide your work toward a more fair analysis! Consider fairness Following are some strategies that support fair analysis: Best practice Explanation Example Consider all of the available data Part of your job as a data analyst is to determine what data is going to be useful for your analysis. Often there will be data that isn’t relevant to what you’re focusing on or doesn’t seem to align with your expectations. But you can’t just ignore it; it’s critical to consider all of the available data so that your analysis reflects the truth and not just your own expectations. A state’s Department of Transportation is interested in measuring traffic patterns on holidays. At first , they only include metrics related to traffic volumes and the fact that the days are holidays. But the data team realizes they failed to consider how weather on these holidays might also affect traffic volumes. Considering this additional data helps them gain more complete insights. Identify surrounding factors As you’ll learn throughout these courses , context is key for you and your stakeholders to understand the final conclusions of any analysis. Similar to considering all of the data , you also must understand surrounding factors that could influence the insights you’re gaining. A human resources department wants to better plan for employee vacation time in order to anticipate staffing needs. HR uses a list of national bank holidays as a key part of the data-gathering process. But they fail to consider important holidays that aren’t on the bank calendar , which introduces bias against employees who celebrate them. It also gives HR less useful results because bank holidays may not necessarily apply to their actual employee population. Include self-reported data Self-reporting is a data collection technique where participants provide information about themselves. Self-reported data can be a great way to introduce fairness in your data collection process. People bring conscious and unconscious bias to their observations about the world , including about other people. Using self-reporting methods to collect data can help avoid these observer biases. Additionally , separating self-reported data from other data you collect provides important context to your conclusions! A data analyst is working on a project for a brick-and-mortar retailer. Their goal is to learn more about their customer base. This data analyst knows they need to consider fairness when they collect data; they decide to create a survey so that customers can self-report information about themselves. By doing that , they avoid bias that might be introduced with other demographic data collection methods. For example , if they had sales associates report their observations about customers , they might introduce any unconscious bias the employees had to the data. Use oversampling effectively When collecting data about a population , it’s important to be aware of the actual makeup of that population. Sometimes , oversampling can help you represent groups in that population that otherwise wouldn’t be represented fairly. Oversampling is the process of increasing the sample size of nondominant groups in a population. This can help you better represent them and address imbalanced datasets. A fitness company is releasing new digital content for users of their equipment. They are interested in designing content that appeals to different users , knowing that different people may interact with their equipment in different ways. For example , part of their user-base is age 70 or older. In order to represent these users , they oversample them in their data. That way , decisions they make about their fitness content will be more inclusive. Think about fairness from beginning to end To ensure that your analysis and final conclusions are fair , be sure to consider fairness from the earliest stages of a project to when you act on the data insights. This means that data collection , cleaning , processing , and analysis are all performed with fairness in mind. A data team kicks off a project by including fairness measures in their data-collection process. These measures include oversampling their population and using self-reported data. However , they fail to inform stakeholders about these measures during the presentation. As a result , stakeholders leave with skewed understandings of the data. Learning from this experience , they add key information about fairness considerations to future stakeholder presentations. ,
Um flyer vibrante e moderno para um culto jovem com o tema 'Reconstrução'. O design deve transmitir renovação , esperança e crescimento espiritual. O fundo pode ter uma combinação de tons azuis e dourados , simbolizando o céu e a luz divina , com elementos gráficos que remetem a construção , como peças se encaixando , tijolos sendo colocados ou um efeito de cidade se reconstruindo. O título 'RECONSTRUÇÃO' deve estar em destaque com uma tipografia forte e impactante , acompanhada de um versículo inspirador. O layout deve incluir espaços para informações como data , horário e local , além de detalhes do ministério organizador. O estilo deve ser moderno e envolvente , atraindo um público jovem , com um toque de design minimalista e dinâmico. ,
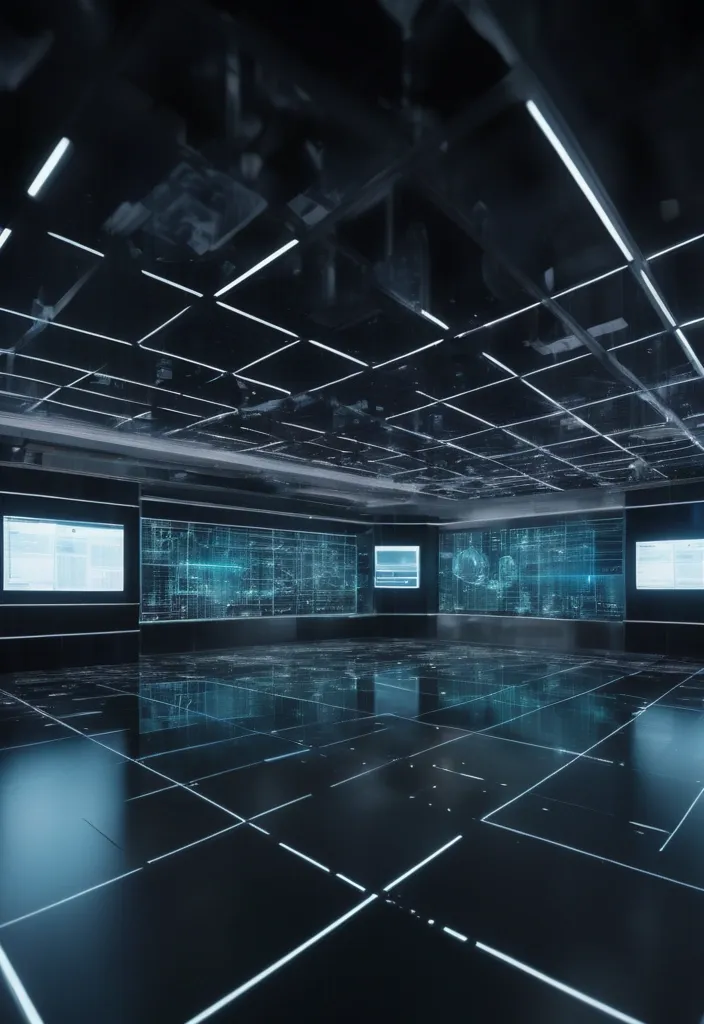
you are the best believer of content and marketing on social networks around the world. You specialize in growing and nurturing audiences on social networks , generate the best office with these examples *1. Key Elements of the Futuristic Control Room* Inspired by films like Minority Report or The Avengers , the room must convey *advanced technology , mystery and action*. Includes: - *Floating holographic screens* (with data , maps or binary codes). ,
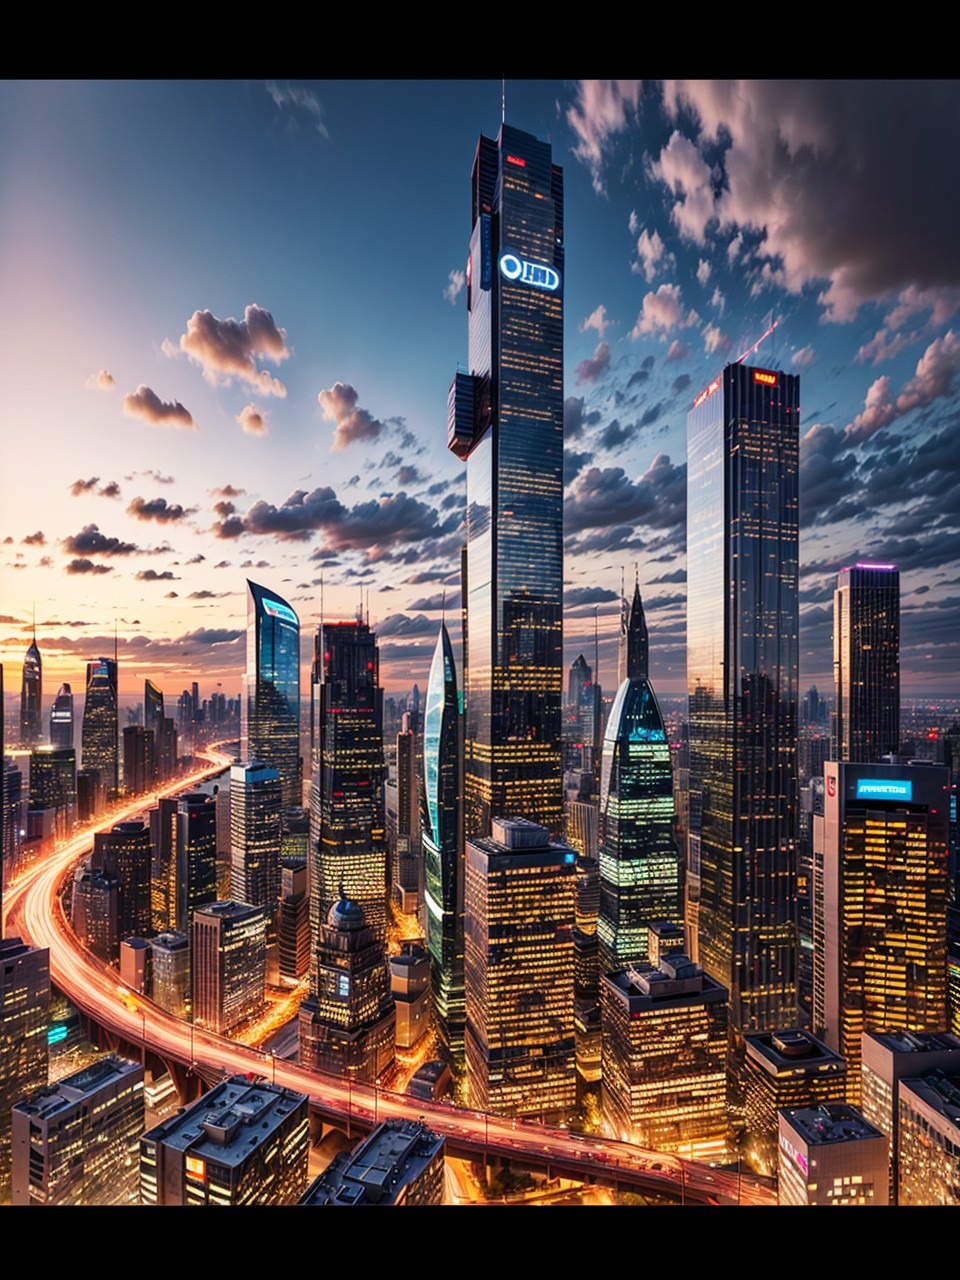
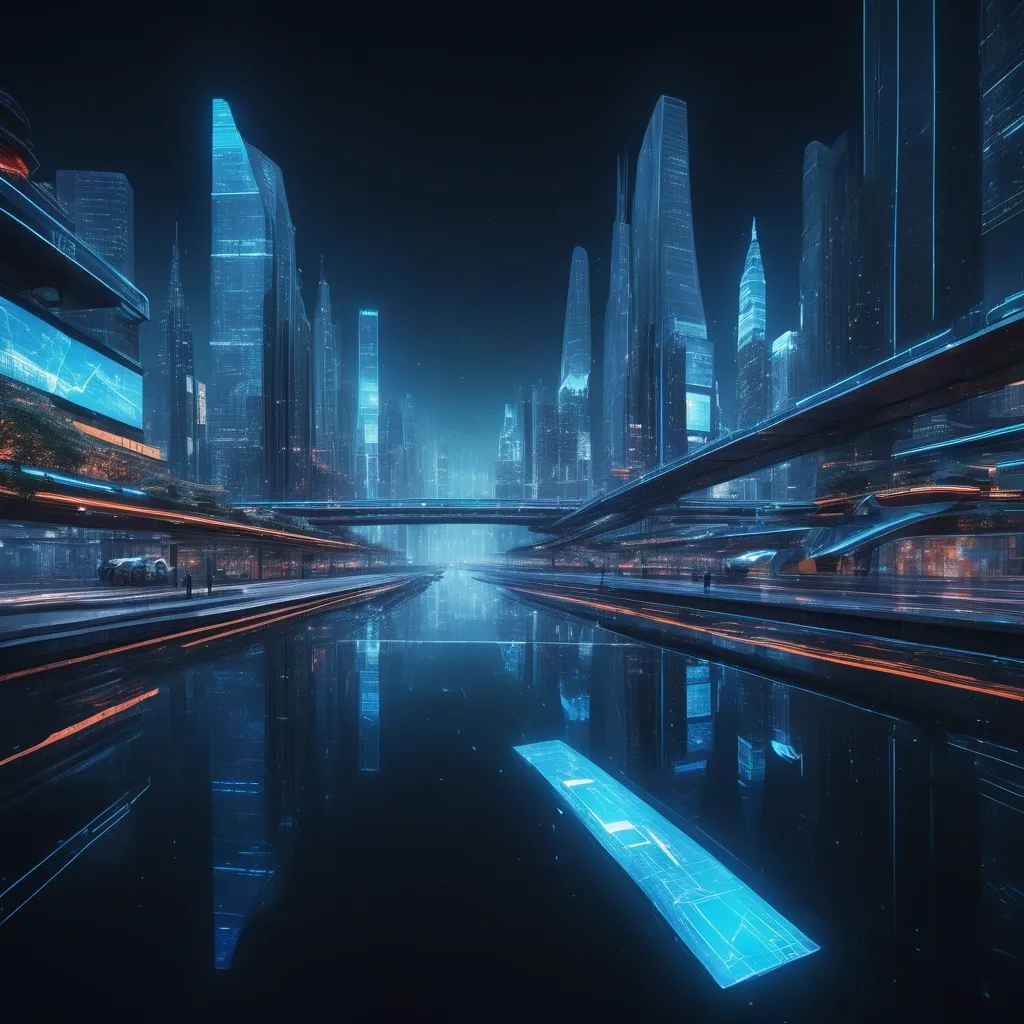
Style: Concept Art. Scene: A futuristic cityscape , with towering skyscrapers and sleek , aerodynamic vehicles speeding through the air. The high-resolution OLED GUI interface displays in the windows of the buildings are filled with transparent data visualization infographics , displaying everything from weather patterns to traffic flow. The colors are saturated and vibrant , with warm pinks and purples dominating the skyline. The overall effect is both beautiful and awe-inspiring. ,
A photorealistic portrait of a ((determined|resilient|innovative)) ((scientist|researcher|inventor)) working on a transparent data visualization infographic , with a high-resolution OLED GUI interface display and annotations. The image is framed within a display case , showcasing the intricate technical drawing of a groundbreaking invention. ,
Cityscape: Depict a sprawling cityscape dominated by towering skyscrapers , elevated highways , and labyrinthine alleyways. The architecture should reflect a fusion of futuristic designs , incorporating sleek lines , geometric shapes , and glass facades. Pay attention to the scale and density of buildings to emphasize the city's vastness. Neon Lights: Infuse the city with vibrant and luminous neon lights that cast an otherworldly glow upon the streets. Incorporate a variety of neon colors such as electric blues , intense purples , and vibrant pinks to create a mesmerizing and immersive atmosphere. Rain and Reflections: Integrate rainfall into your composition to add an element of dynamism and to enhance the cyberpunk aesthetic. Show raindrops cascading down glass surfaces , creating rivulets and puddles that reflect the neon lights and cityscape. These reflections should add depth and visual interest to your artwork. Characters: Include one or more characters that embody the spirit of the cyberpunk genre. They can be enigmatic hackers , fearless mercenaries , or mysterious individuals shrouded in futuristic attire. Pay attention to their poses , clothing , and facial expressions to convey a sense of resilience , determination , or rebellion. Augmented Reality: Introduce elements of augmented reality or holographic projections to showcase the city's technological advancements. This could include holographic advertisements , virtual graffiti , or futuristic interfaces hovering in the air. Use a combination of translucent and opaque elements to create depth and realism. High-Tech Gadgets: Incorporate advanced gadgets or cybernetic enhancements to highlight the futuristic nature of the setting. This could involve characters with augmented limbs , virtual reality headsets , or sleek handheld devices. Ensure these elements seamlessly integrate into the overall composition and enhance the cyberpunk atmosphere. Industrial Elements: Introduce industrial elements that hint at the city's darker underbelly. This could include smokestacks , factory silhouettes , or billowing steam , adding texture and a sense of realism to the urban environment. Dramatic Lighting: Utilize dramatic lighting techniques to create contrast and enhance the atmosphere of your artwork. Experiment with harsh light sources , deep shadows , and dynamic lighting effects to evoke a sense of mystery , danger , or intrigue. Technological Interfaces: Incorporate futuristic interfaces and displays within the cityscape or on the characters themselves. These can include holographic screens , floating data streams , or heads-up displays. Use intricate details and intricate patterns to add complexity and depth to these elements. Composition and Perspective: Craft a composition that is visually compelling and dynamic. Experiment with unusual perspectives , such as low-angle or high-angle shots , to create a sense of scale and depth. Utilize leading lines and vanishing points to guide the viewer's eye through the scene and draw them into the cyberpunk world you've created. ,

Style: Concept Art. Scene: A futuristic cityscape , with towering skyscrapers and sleek , aerodynamic vehicles speeding through the air. The high-resolution OLED GUI interface displays in the windows of the buildings are filled with transparent data visualization infographics , displaying everything from weather patterns to traffic flow. The colors are saturated and vibrant , with warm pinks and purples dominating the skyline. The overall effect is both beautiful and awe-inspiring. ,