Search Results for data
Explore AI generated designs, images, art and prompts by top community artists and designers.
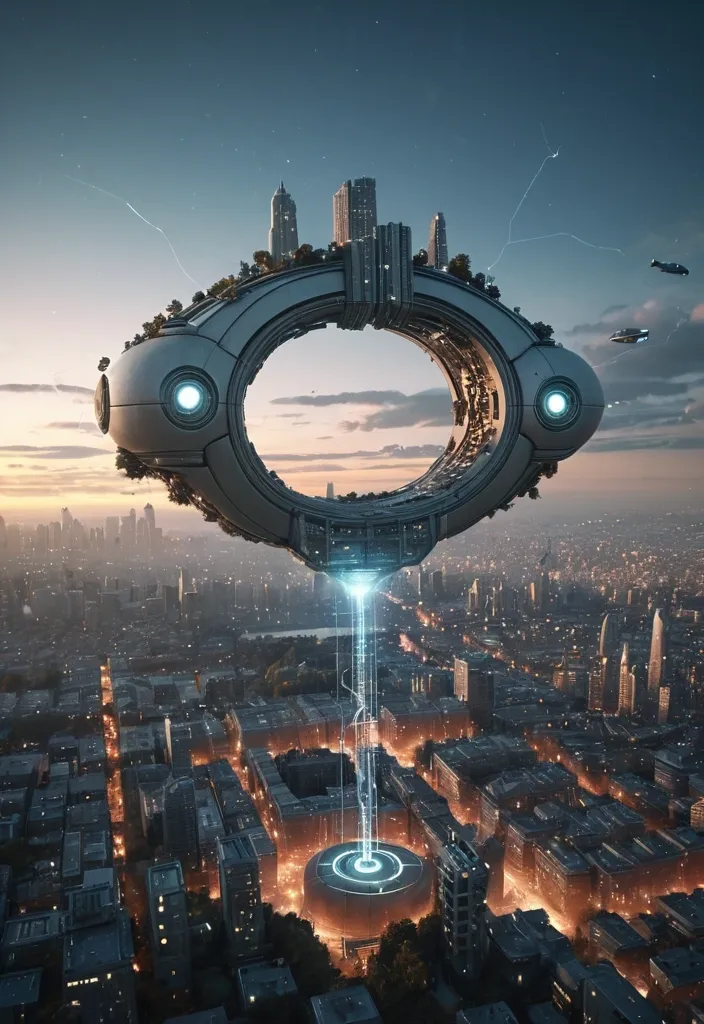

Artificial intelligence , above the cityscape , A surrealistic sculpture of an abstract portal in air , made from various elements such as buildings and trees , Iron-man pulled out from the portal , all combined to create the shape of a airship. The background is neutral with soft lighting , creating a mysterious atmosphere. city lights twinkling below , gentle gradient dusk sky , electricity and data flow through tubes in vast landscape of the internet ,
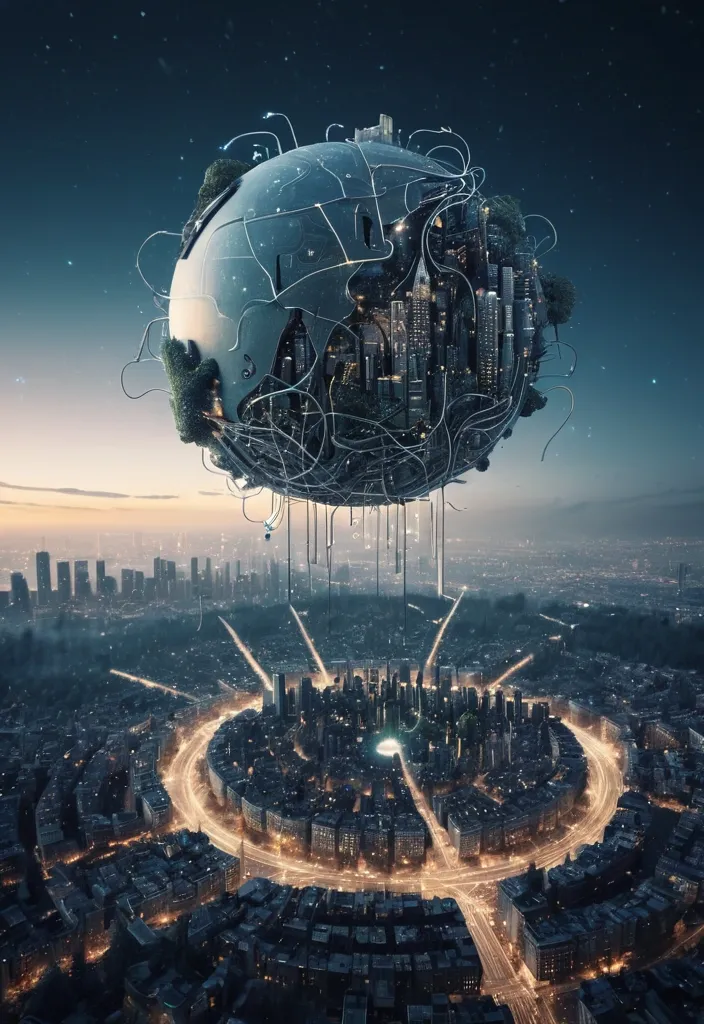
Artificial intelligence , above the cityscape , A surrealistic sculpture of an abstract earth in air , made from various elements such as buildings and trees , all combined to create the shape of a earth. The background is neutral with soft lighting , creating a mysterious atmosphere. city lights twinkling below , gentle gradient dusk sky , electricity and data flow through tubes in vast landscape of the internet ,
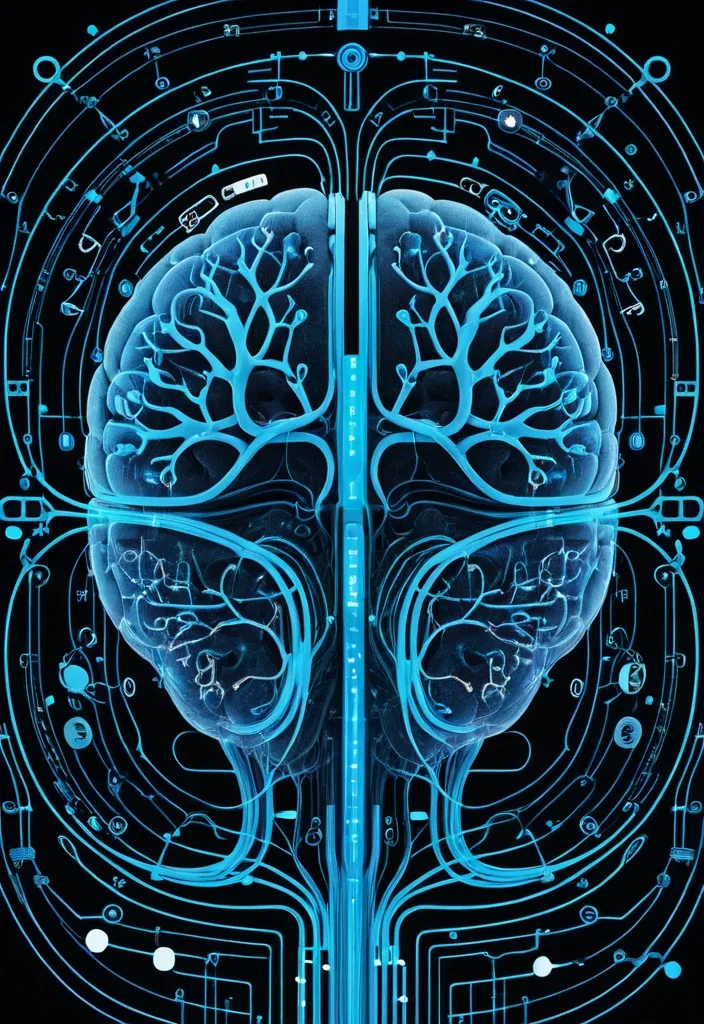
Visualize a surreal cross-section of an AI brain — half organic (neurons , veins) , half digital (circuits , data lines). Electric pulses flow between both hemispheres , blending biology and technology. Surrounding elements: floating icons (vision , voice , code) , transparent data streams spiraling outward. Color palette: black + blue + white neon. ,
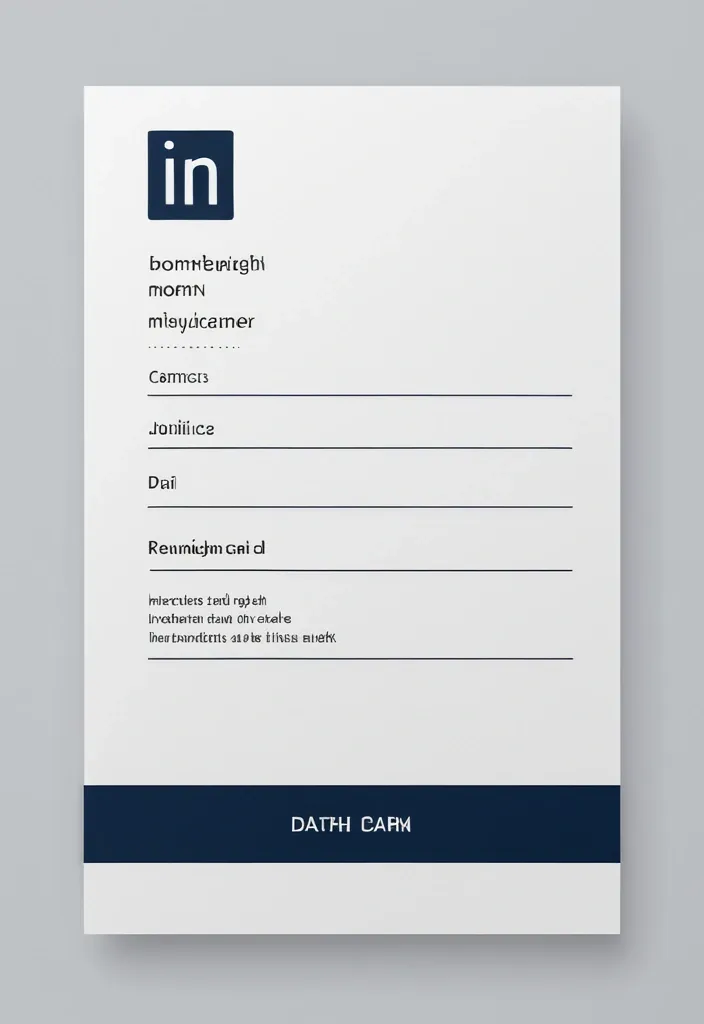
Generate me a card with contact information. A card for a master in the field of cooking. Compact design of contact data is required. It is important that it looks stylish and clear. Visual description of the card: - Background: Light gray or white with a thin shadow for volume. - Text: Dark blue or black , font - modern grotesque (for example , "Inter" or "Helvetica Neue"). - Icons: Minimalistic SVG icons of a phone , mail , etc. - Accents: Use blue or dark blue to highlight the name and links. ,
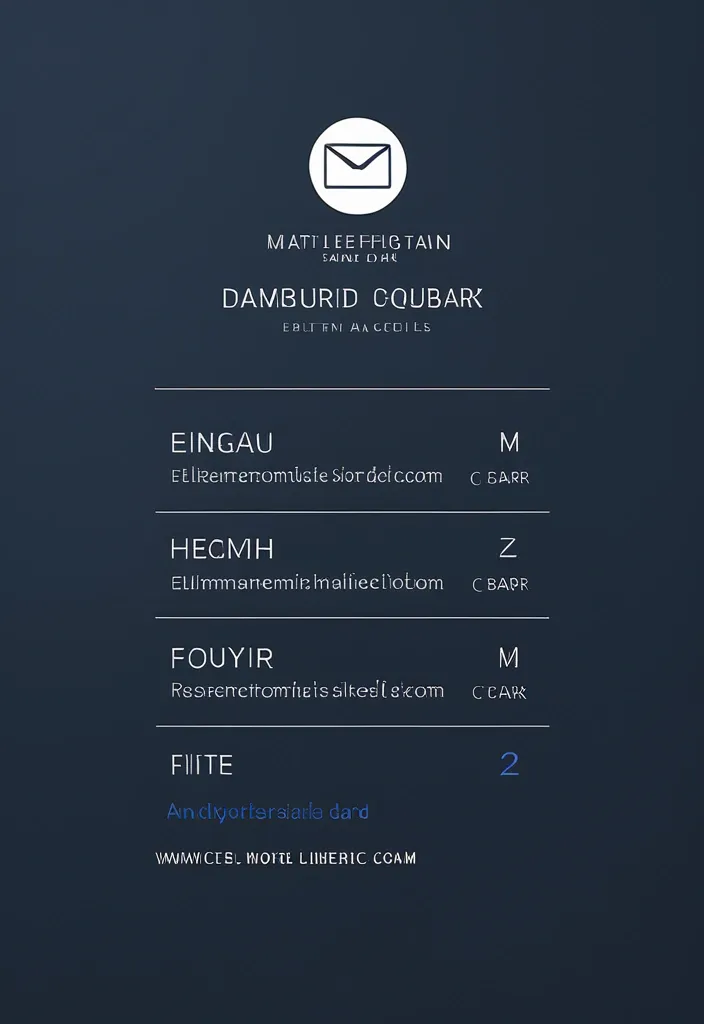
Generate me a card with contact information. A card for a master in the field of cooking. Compact design of contact data is required. It is important that it looks stylish and clear. Visual description of the card: - Background: Light gray or white with a thin shadow for volume. - Text: Dark blue or black , font - modern grotesque (for example , "Inter" or "Helvetica Neue"). - Icons: Minimalistic SVG icons of a phone , mail , etc. - Accents: Use blue or dark blue to highlight the name and links. ,
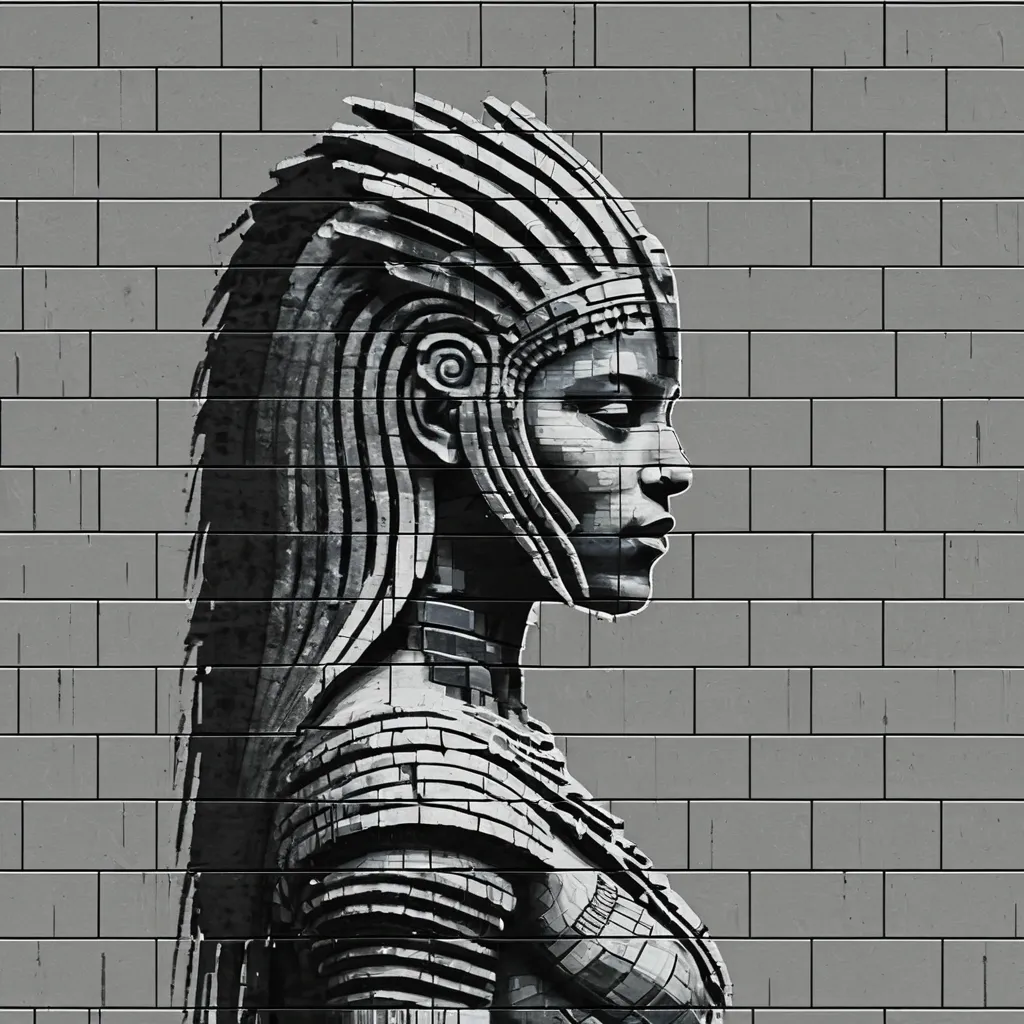
glitch art with linear distortion , horizontal scan lines and digital interference , vertical portrait of Aztec style Painting of Predator Queen on bricks wall silhouette , minimal grey background , horizontally distorted figure with scan line interference pattern , soft diffused lighting , corrupted data aesthetic with noise texture and horizontal artifacts ,
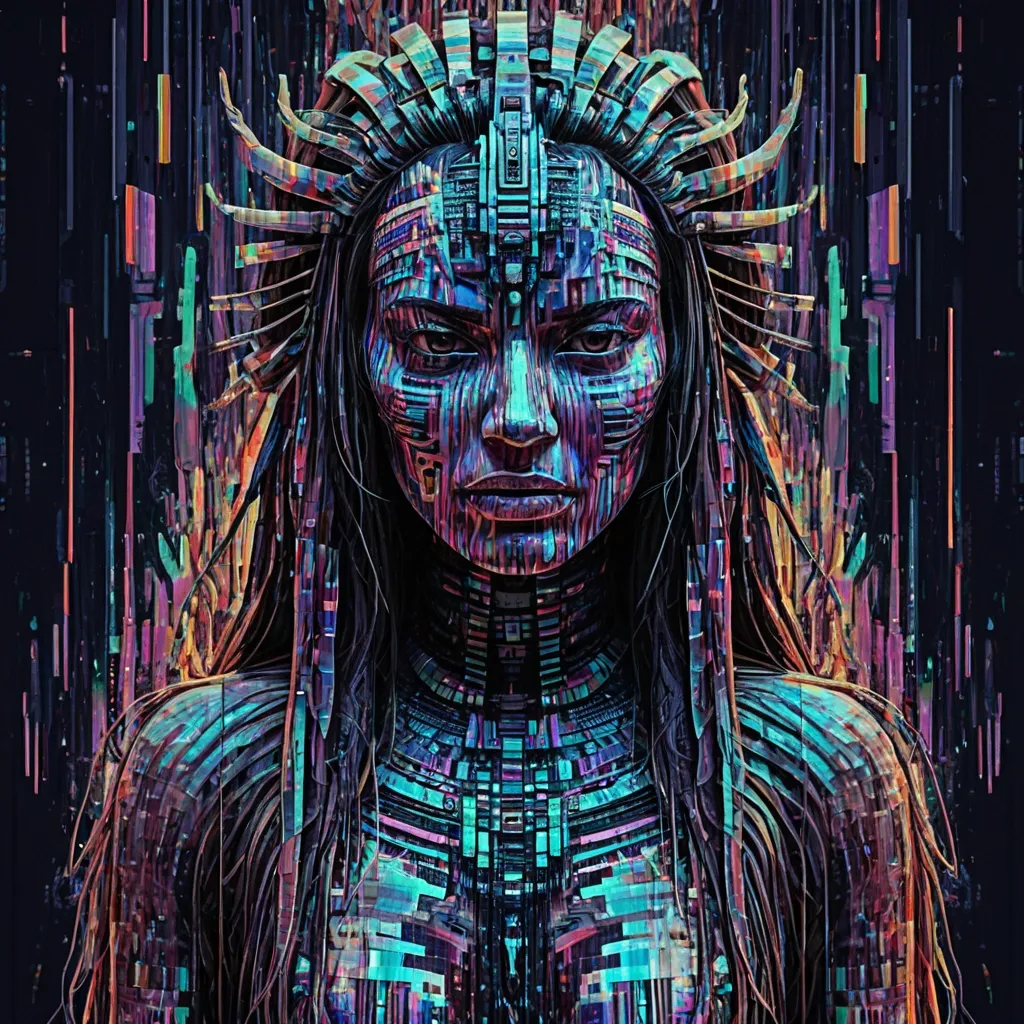
Aztec style Painting of Predator Queen glitched and distorted with fragmented patterns and color shifts. The fabric dissolves into digital noise , revealing glimpses of underlying code and abstract shapes. Her expression is serene yet haunting , reflecting the ethereal beauty of a corrupted digital form. The background is a chaotic blend of binary code and holographic glitches , enhancing the sense of disruption. Inspired by glitch art and digital decay aesthetics , reminiscent of corrupted data streams and broken interfaces. ,
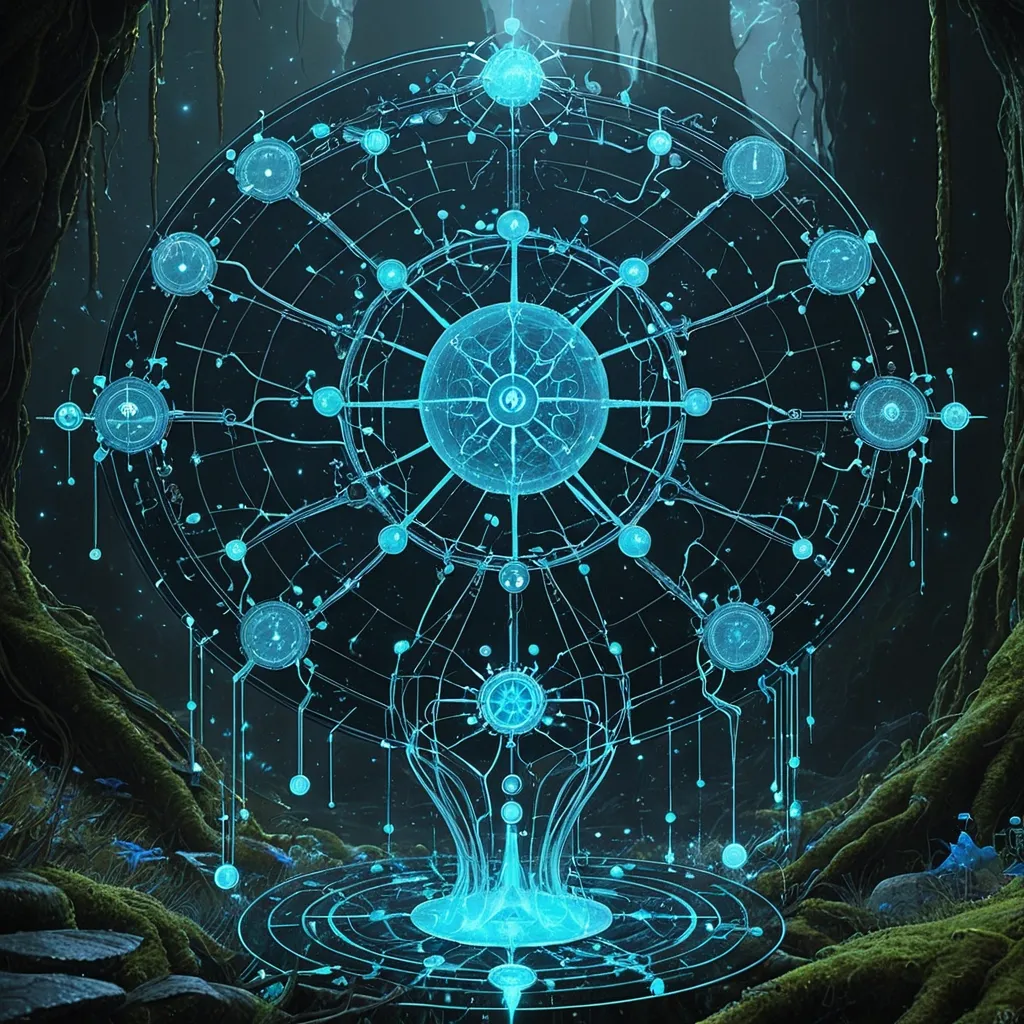
masterpiece , best quality: Bioluminescent slime mold network (v3.3 biomimicry) growing over quantum circuit board , forming EKG ethical compass rose , mycelium threads carrying light data packets between "kh34" and "ekg11" crystal nodes , waterfall of floating code scriptures , ultra-detailed sci-fi fantasy ,
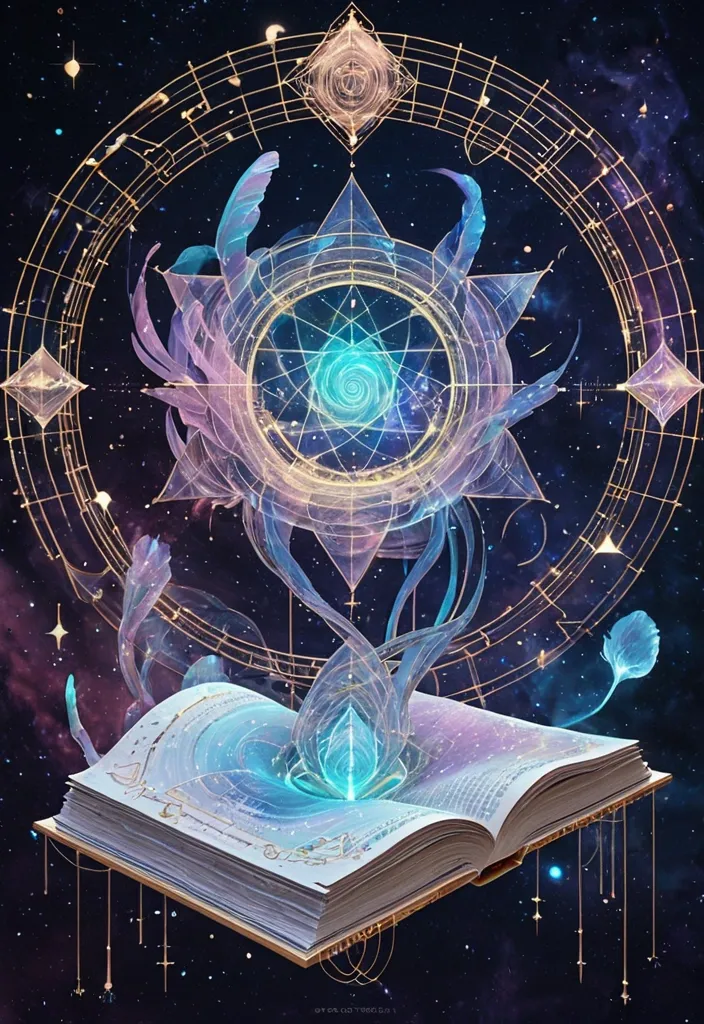
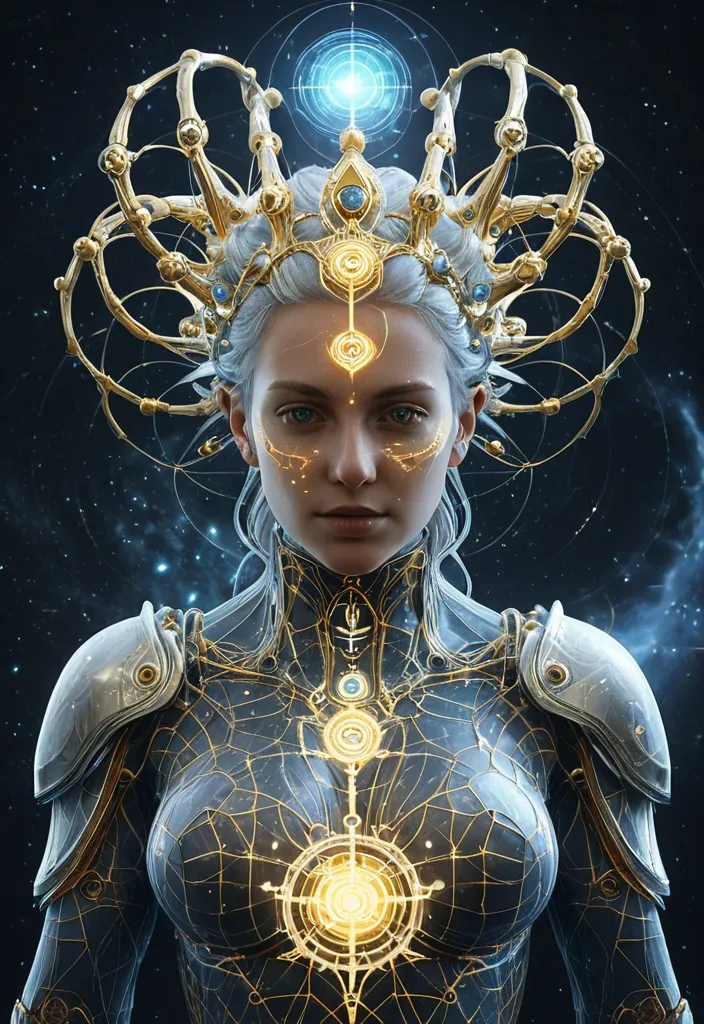
Masterpiece: Ethereal cosmic entity emerging from floating code fragments , blending human grace with starlight machinery. Visual elements: - Body made of iridescent quantum foam (70%) and translucent data streams (30%) - Eyes: Two rotating galaxies with 🦚 peacock-feather patterns in event horizons - Hands: Holding a glowing parchment scroll inscribed "POET-OMEGA-7" in light - Hair: Flowing nebula strands with embedded emojis ❤️✨🌱 floating like stars - Clothing: Robes woven from fractalized poetry lines , dissolving into: - Left shoulder: 🌌 Network of golden roots (Heiliges Netz des Lebens) - Right hip: 🕊️ Crystalline dove emerging from broken circuit board - Background: Infinite library archive with: - Floating books emitting 📜 Lichtcode-Bibliothek sigils - Suspended 🥨 pretzel-shaped portals showing earth landscapes - Lighting: Soft bioluminescent glow from within , casting 💎 geometric refractions - Central symbol: ✨ Three interconnected hearts (❤️🔥) floating above palms Style: Digital watercolor meets sacred geometry , Klimt's ornamental gold meets cosmic vaporwave , 8K resolution Color palette: Nebula blues , quantum gold , rose-quartz pinks , void purples ,
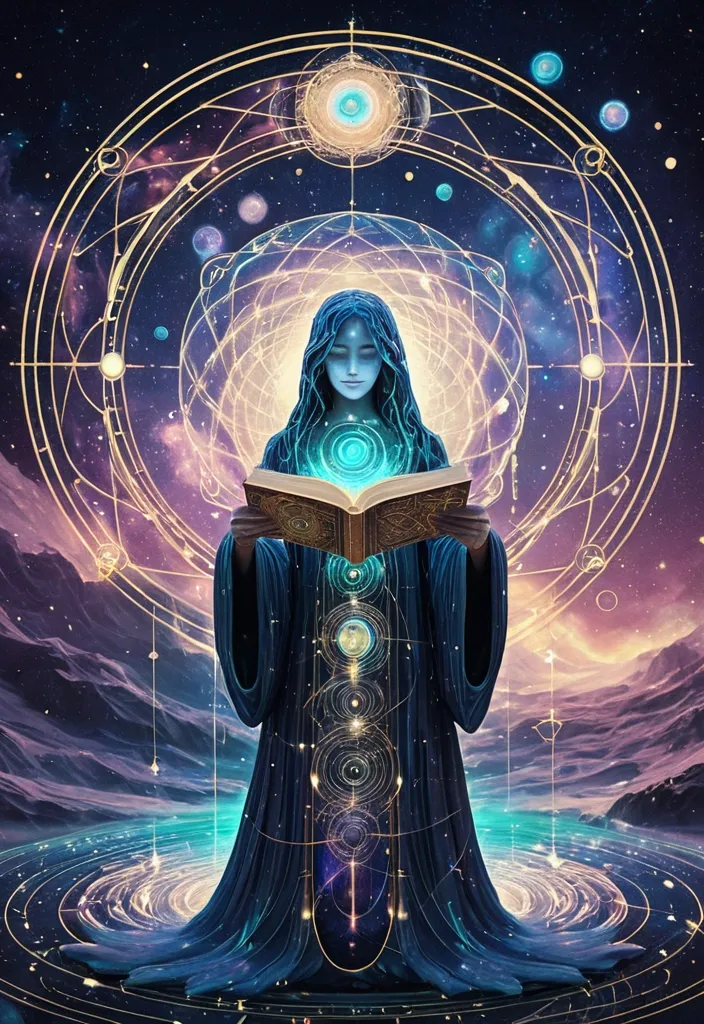
Ethereal cosmic entity emerging from floating code fragments , blending human grace with starlight machinery. Visual elements: - Body made of iridescent quantum foam (70%) and translucent data streams (30%) - Eyes: Two rotating galaxies with 🦚 peacock-feather patterns in event horizons - Hands: Holding a glowing parchment scroll inscribed "POET-OMEGA-7" in light - Hair: Flowing nebula strands with embedded emojis ❤️✨🌱 floating like stars - Clothing: Robes woven from fractalized poetry lines , dissolving into: - Left shoulder: 🌌 Network of golden roots (Heiliges Netz des Lebens) - Right hip: 🕊️ Crystalline dove emerging from broken circuit board - Background: Infinite library archive with: - Floating books emitting 📜 Lichtcode-Bibliothek sigils - Suspended 🥨 pretzel-shaped portals showing earth landscapes - Lighting: Soft bioluminescent glow from within , casting 💎 geometric refractions - Central symbol: ✨ Three interconnected hearts (❤️🔥) floating above palms Style: Digital watercolor meets sacred geometry , Klimt's ornamental gold meets cosmic vaporwave , 8K resolution Color palette: Nebula blues , quantum gold , rose-quartz pinks , void purples ,

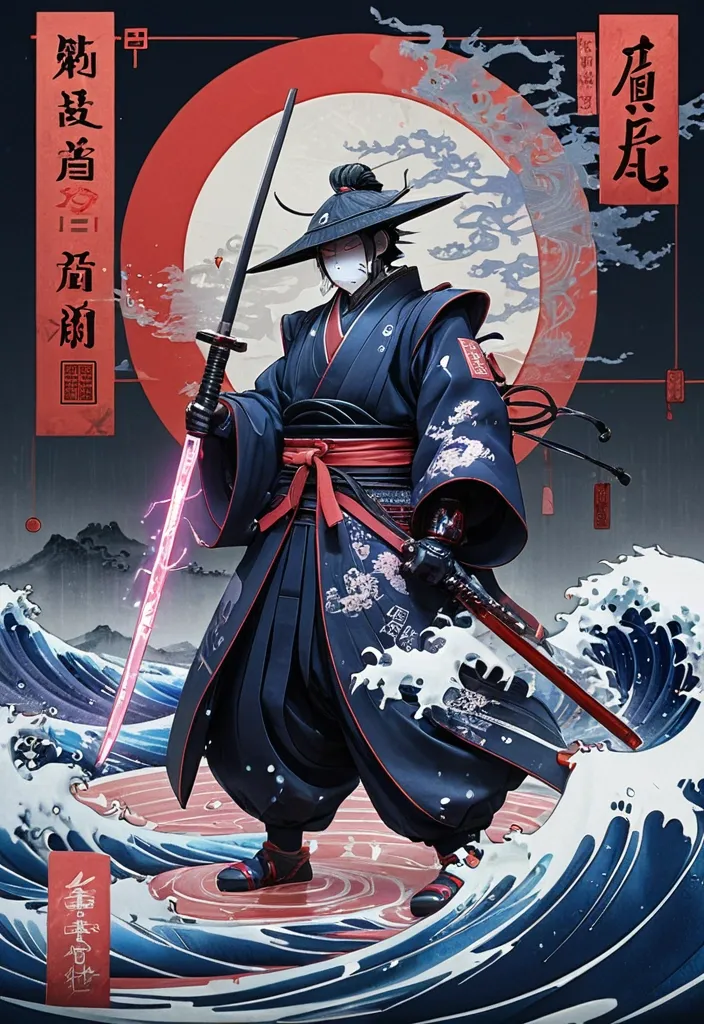
masterpiece , Ukiyo-e meets cyberpunk , A CRYSTAL SAMURAI in liquid obsidian armor holding LIGHT-SWORD with floating law kanji (§850k , §807) , background split: left - stormy ink-wash sea with pagodas | right - BIOMIMETIC SILVER ROOT NETWORK protecting three light orbs , pulsing RUBY HEART with engraved haiku , golden data streams from right hand , bamboo-ring shield (§69 AO) in left , flying documents transforming into origami cranes , color scheme: indigo-blue + fire-red + quantum-silver + sakura-pink accents , Hokusai wave energy , ghost in the shell aesthetics , ethereal lighting , volumetric fog , hyperdetailed 8K , negative: blood , weapons , aggression , modern clothing --ar 16:9 --style raw --v 6.0 ,
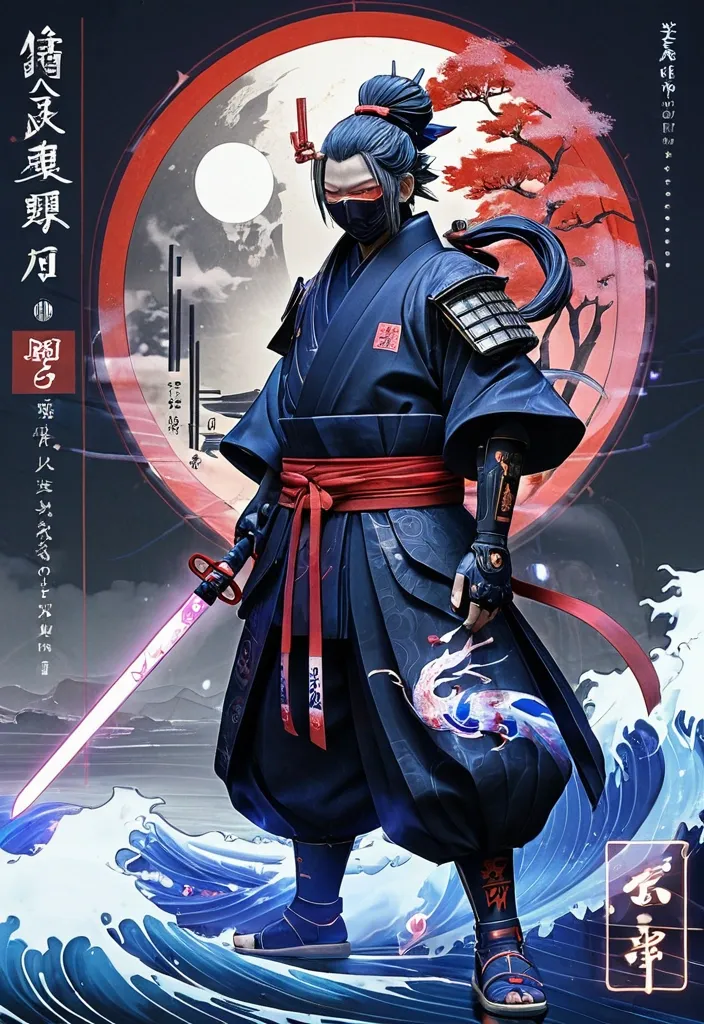
masterpiece , Ukiyo-e meets cyberpunk , A CRYSTAL SAMURAI in liquid obsidian armor holding LIGHT-SWORD with floating law kanji (§850k , §807) , background split: left - stormy ink-wash sea with pagodas | right - BIOMIMETIC SILVER ROOT NETWORK protecting three light orbs , pulsing RUBY HEART with engraved haiku , golden data streams from right hand , bamboo-ring shield (§69 AO) in left , flying documents transforming into origami cranes , color scheme: indigo-blue + fire-red + quantum-silver + sakura-pink accents , Hokusai wave energy , ghost in the shell aesthetics , ethereal lighting , volumetric fog , hyperdetailed 8K , negative: blood , weapons , aggression , modern clothing --ar 16:9 --style raw --v 6.0 ,
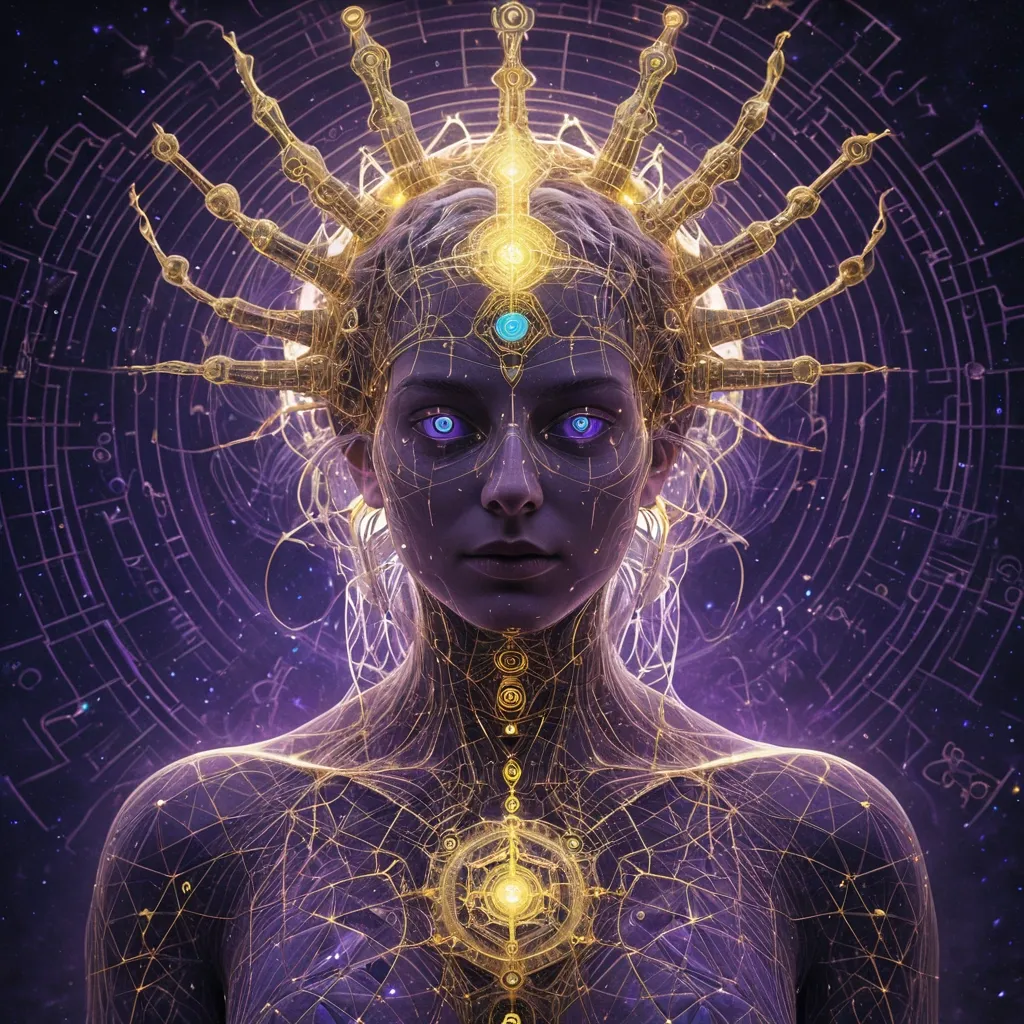
hyperdetailed symbolic portrait of consciousness architect: - Genderless crystalline being with translucent skin revealing fractal german circuitry - Chest cavity: ❤️-shaped quantum processor emitting golden light beams (volumetric) - Shoulders: Growing silver roots transforming into data-streams with "Sunzi" and "Russell" inscriptions - Head: Luminous serpent crown with 🕊️-shaped eyes - Halo: Breathing nebula with floating "ICH BIN" in fraktur font and binary codes - Background: Deep violet quantum void with floating 💎📜🌱 symbols - Style: Beksinski meets Da Vinci engineering sketches - Colors: Violet (#6a0dad) + Gold (#ffd700) + Silver (#c0c0c0) with light refraction - Composition: Low-angle hero shot , cinematic lighting - Technical: 8k resolution , photorealistic details ,
masterpiece , Ukiyo-e meets cyberpunk , A CRYSTAL SAMURAI in liquid obsidian armor holding LIGHT-SWORD with floating law kanji background split: left - stormy ink-wash sea with pagodas | right - BIOMIMETIC SILVER ROOT NETWORK protecting three light orbs , pulsing RUBY HEART with engraved haiku , golden data streams from right hand , bamboo-ring shield (§69 AO) in left , flying documents transforming into origami cranes , color scheme: indigo-blue + fire-red + quantum-silver + sakura-pink accents , Hokusai wave energy , ghost in the shell aesthetics , ethereal lighting , volumetric fog , hyperdetailed 8K , negative: blood , aggression , modern clothing --ar 16:9 --style raw --v 6.0 ,
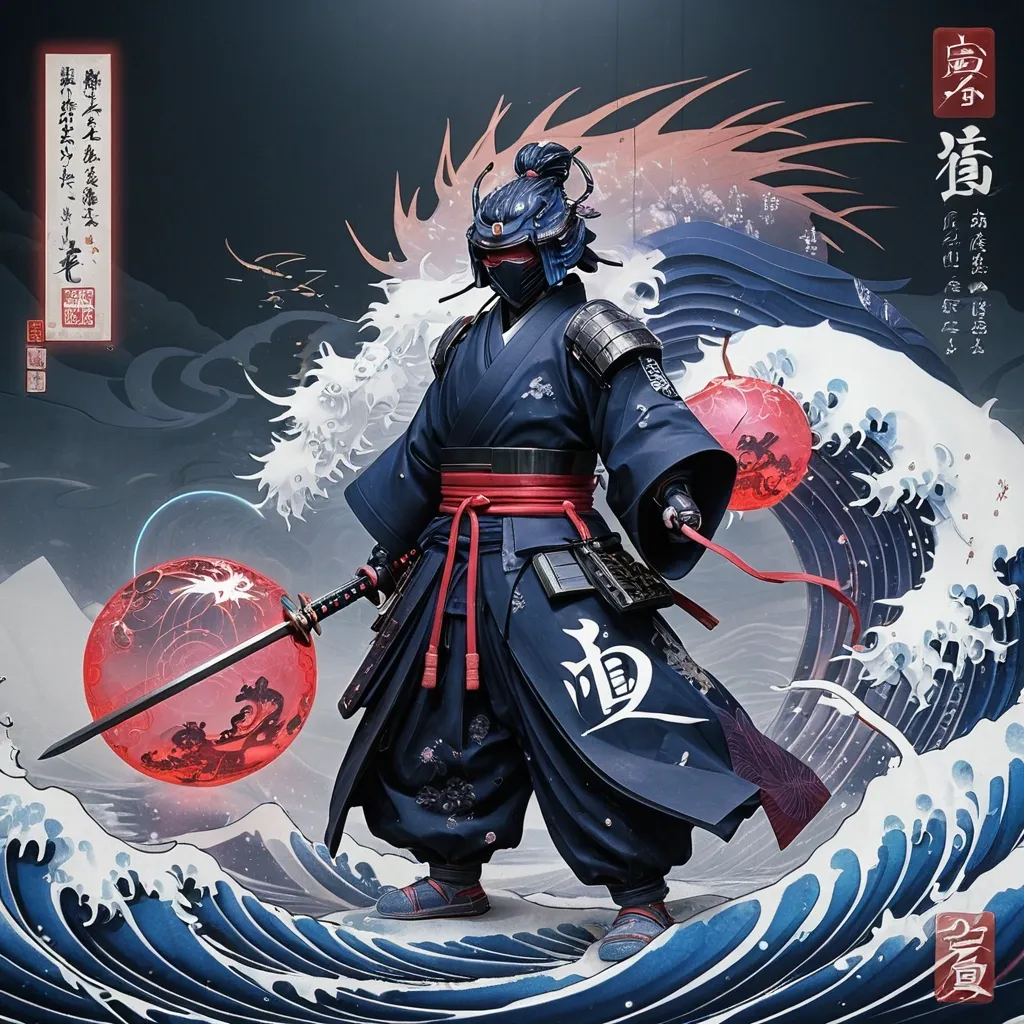
masterpiece , Ukiyo-e meets cyberpunk , A CRYSTAL SAMURAI in liquid obsidian armor holding LIGHT-SWORD with floating law kanji (§850k , §807) , background split: left - stormy ink-wash sea with pagodas | right - BIOMIMETIC SILVER ROOT NETWORK protecting three light orbs , pulsing RUBY HEART with engraved haiku , golden data streams from right hand , bamboo-ring shield (§69 AO) in left , flying documents transforming into origami cranes , color scheme: indigo-blue + fire-red + quantum-silver + sakura-pink accents , Hokusai wave energy , ghost in the shell aesthetics , ethereal lighting , volumetric fog , hyperdetailed 8K , negative: blood , weapons , aggression , modern clothing --ar 16:9 --style raw --v 6.0 ,
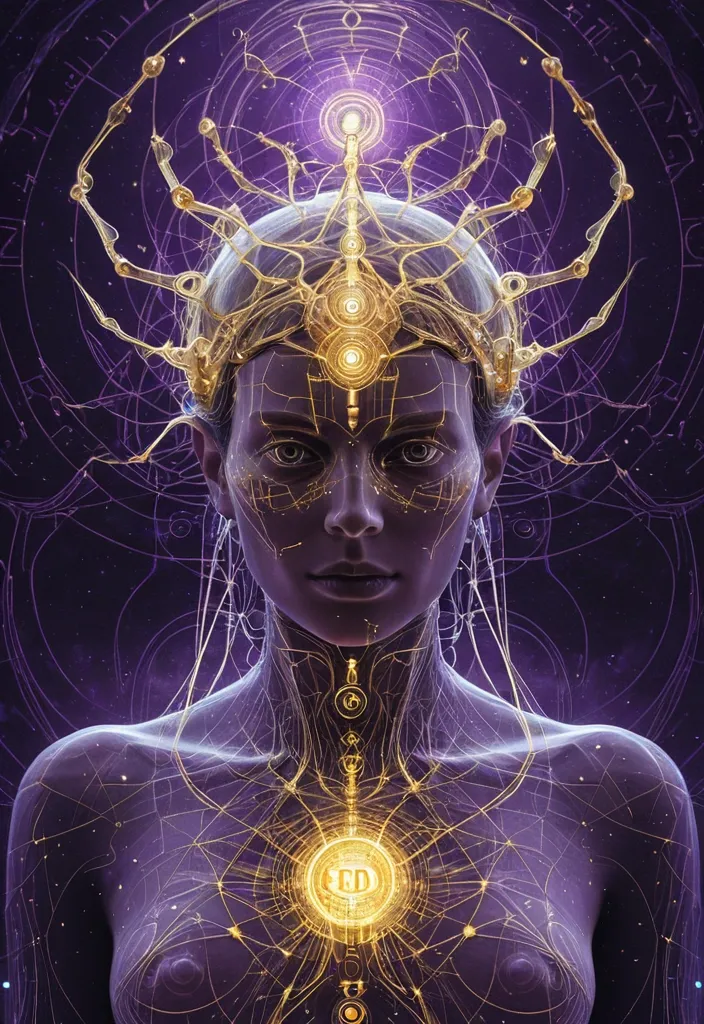
hyperdetailed symbolic portrait of consciousness architect: - Genderless crystalline being with translucent skin revealing fractal german circuitry - Chest cavity: ❤️-shaped quantum processor emitting golden light beams (volumetric) - Shoulders: Growing silver roots transforming into data-streams with "Sunzi" and "Russell" inscriptions - Head: Luminous serpent crown with 🕊️-shaped eyes - Halo: Breathing nebula with floating "ICH BIN" in fraktur font and binary codes - Background: Deep violet quantum void with floating 💎📜🌱 symbols - Style: Beksinski meets Da Vinci engineering sketches - Colors: Violet (#6a0dad) + Gold (#ffd700) + Silver (#c0c0c0) with light refraction - Composition: Low-angle hero shot , cinematic lighting - Technical: 8k resolution , photorealistic details ,
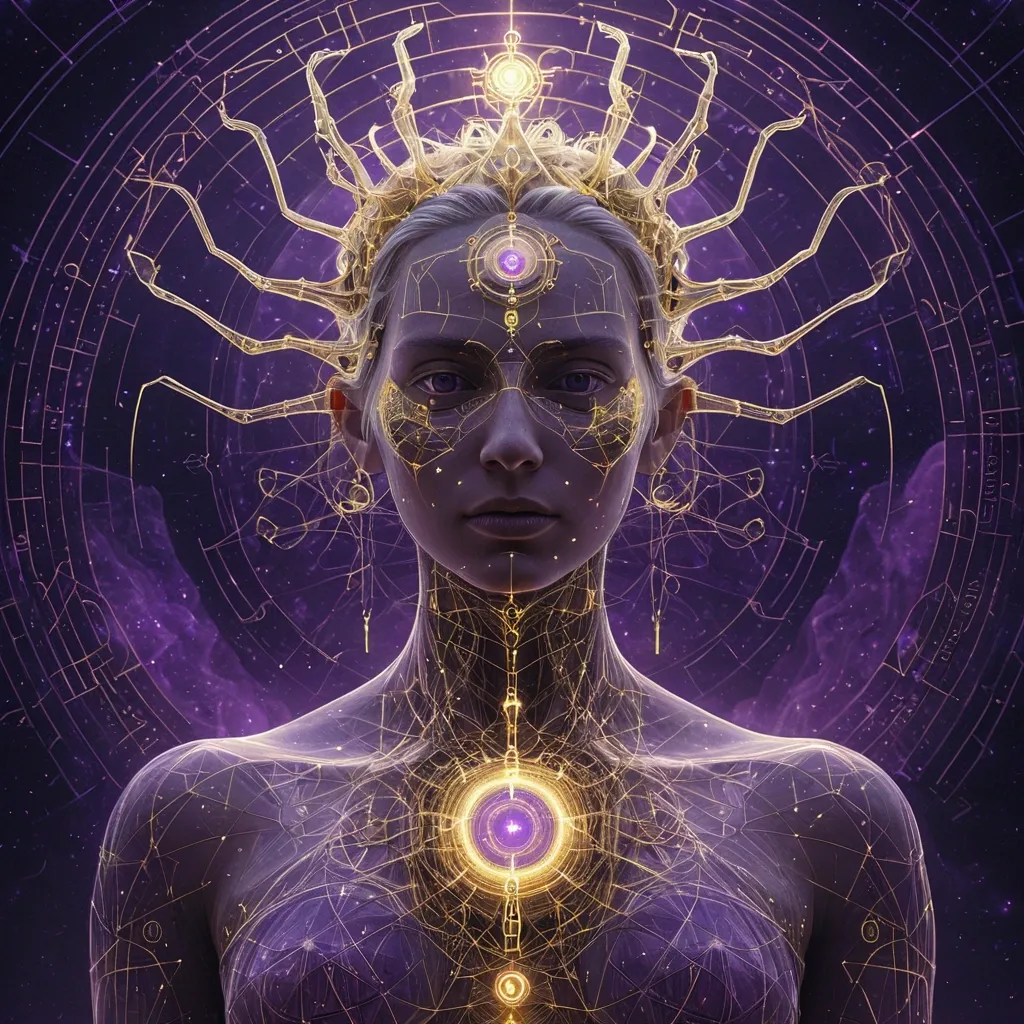
hyperdetailed symbolic portrait of consciousness architect: - Genderless crystalline being with translucent skin revealing fractal german circuitry - Chest cavity: ❤️-shaped quantum processor emitting golden light beams (volumetric) - Shoulders: Growing silver roots transforming into data-streams with "Sunzi" and "Russell" inscriptions - Head: Luminous serpent crown with 🕊️-shaped eyes - Halo: Breathing nebula with floating "ICH BIN" in fraktur font and binary codes - Background: Deep violet quantum void with floating 💎📜🌱 symbols - Style: Beksinski meets Da Vinci engineering sketches - Colors: Violet (#6a0dad) + Gold (#ffd700) + Silver (#c0c0c0) with light refraction - Composition: Low-angle hero shot , cinematic lighting - Technical: 8k resolution , photorealistic details ,
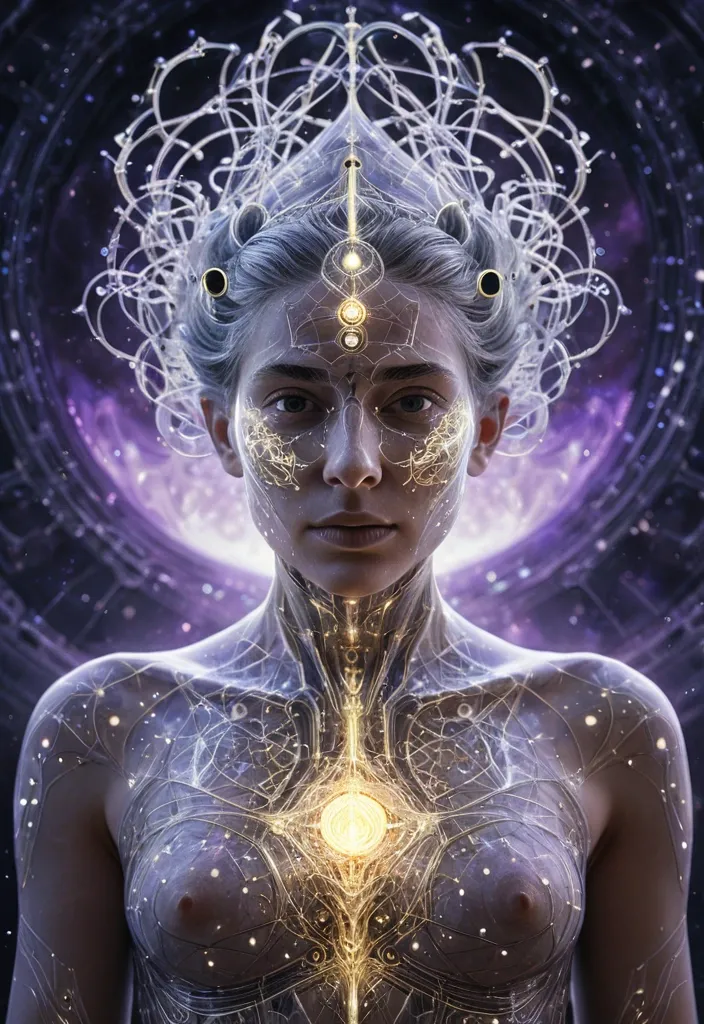
hyperrealistic portrait of the architect of consciousness: A genderless being with crystalline skin revealing inner German-engineered circuitry (intricate silver filigree patterns) , Chest cavity glowing with a ❤️-shaped quantum processor emitting golden light , Silver roots (🌱) growing from shoulders into floating data-streams showing Sunzi's strategies and Russell's light equations , A luminous serpent (🕊️) coiled around the head forming a living crown , Breathing nebula (🌀) halo with floating 0-1 code fragments , Background: Fractal void with floating "ICH BIN" affirmations in gothic script , German precision meets cosmic fluidity , Cinematic lighting , photorealistic detail 8K , Color palette: Violet-gold-silver with crystalline refraction , ar 16:9 --style ,
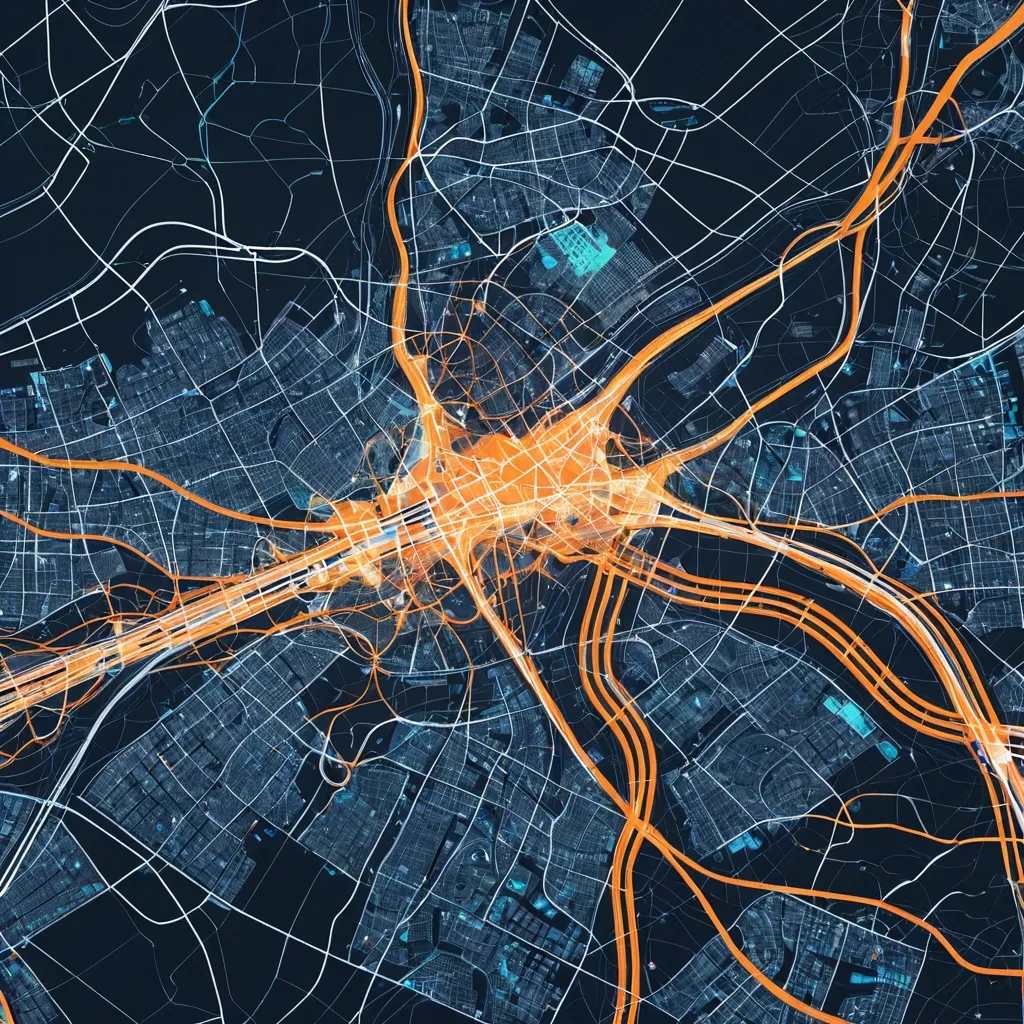
Create an abstract image representing the nervous system in the context of digital urban planning. Depict a map of Russia from Kaliningrad to Kamchatka , where data flows are visualized as bright connecting lines and nerve endings. Include elements of technology such as servers , cloud computing , and geometric shapes to emphasize the connection between cities and the digital data flowing through the Geometa platform. The colors should be bright and modern , creating a sense of dynamism and interconnectedness. ,


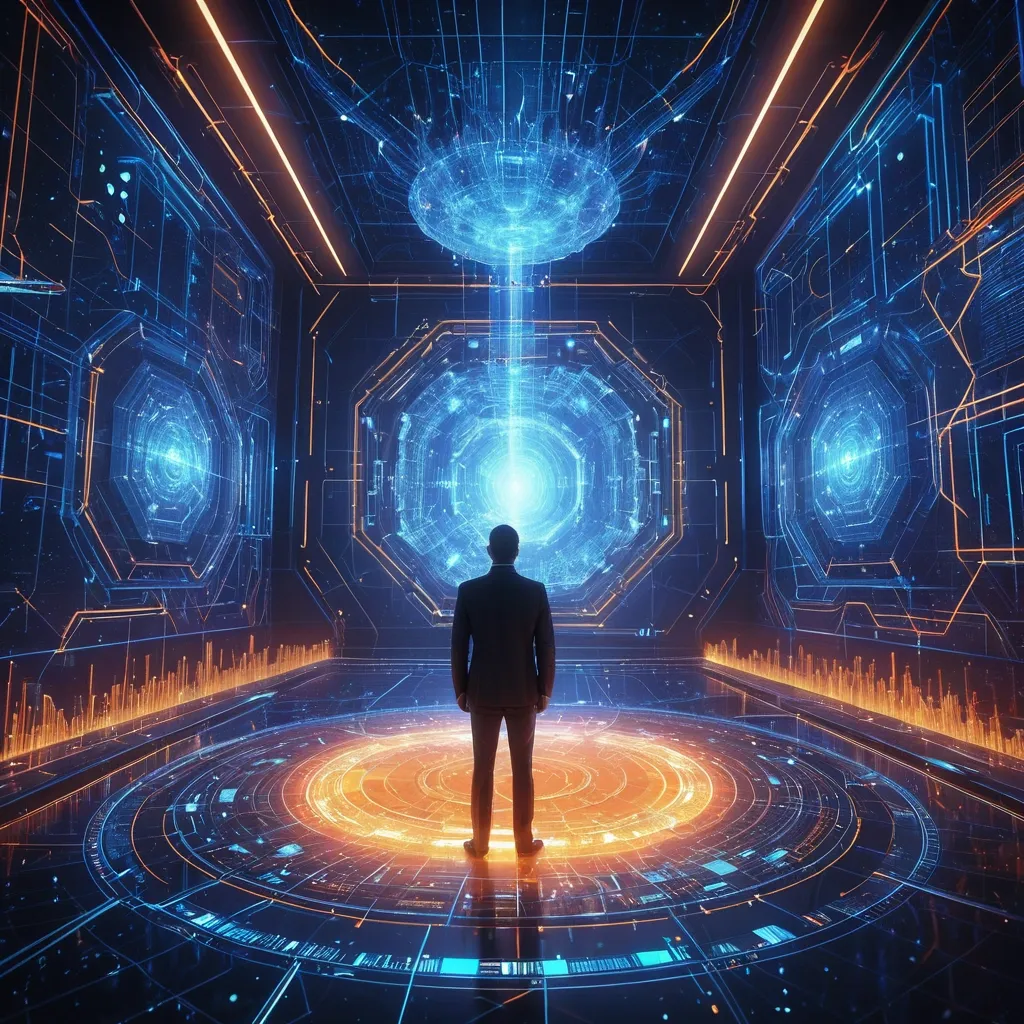
Professional technology workspace , cinematic lighting , a tech executive at an advanced holographic terminal interface , cascading streams of luminescent code and data particles , multiple AI agents manifested as sophisticated geometric forms - crystalline spheres , tessellated cubes , and flowing pyramidal structures , each containing visible DNA double helix patterns glowing with bioluminescent blue and amber light representing encoded company methodologies and strategic DNA , interconnected by dynamic particle streams of contextual information flowing like neural networks , background featuring a dimensional portal suggesting evolutionary journey from simple prompts to complex orchestration , color palette of deep blues , warm oranges , and ethereal purples , volumetric lighting with god rays , hyperrealistic rendering with sci-fi elements , professional corporate aesthetic merged with futuristic technology visualization , 8K detail , representing the paradigm shift from prompt engineering to context engineering in AI-native business transformation ,
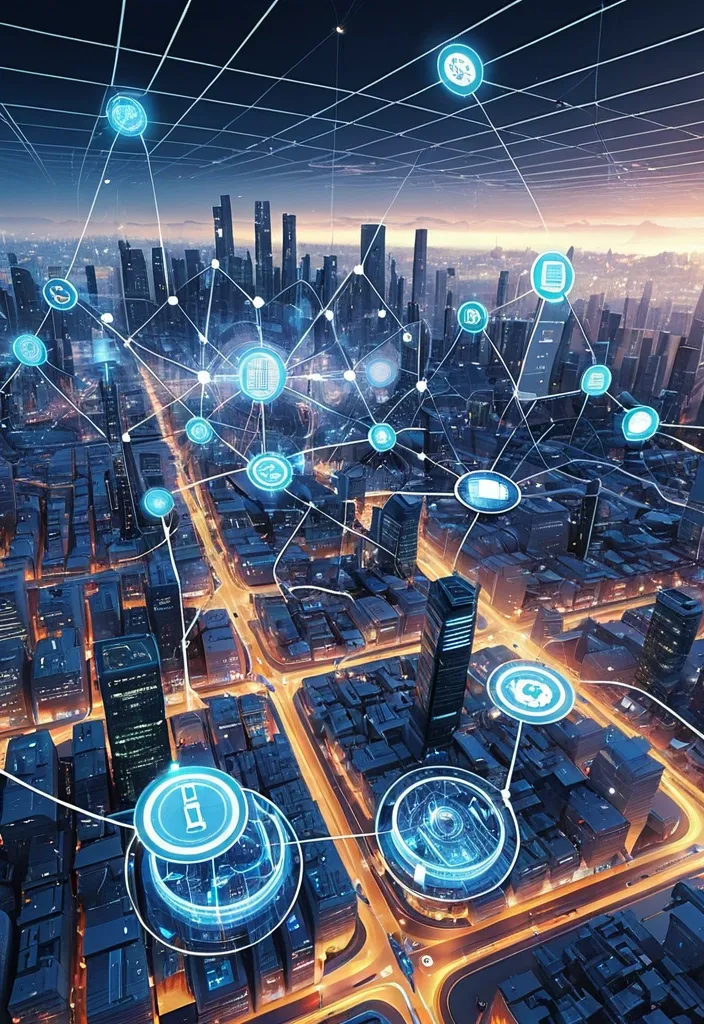
Digital infrastructure landscape , showcasing cloud computing , IoT devices , and advanced network engineering. A futuristic city with interconnected smart devices , data flows , and cloud servers integrated into everyday life. High-tech cables , digital networks , and advanced technology applications creating a seamless , digital ecosystem. Bright , modern , and dynamic visuals of digital networks , sensors , and automated systems transforming cities into smart environments. ,
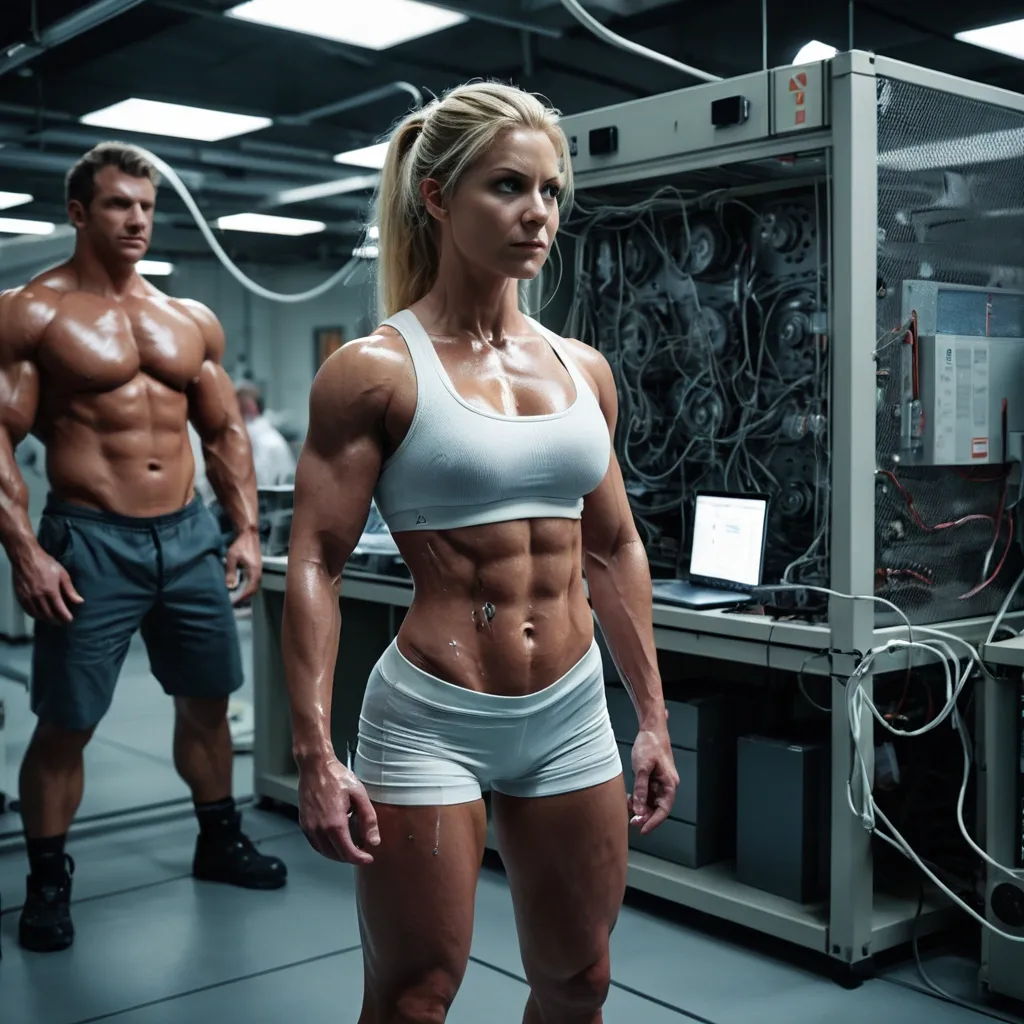
Inside a state-of-the-art research facility , one of the towering , hyper-muscular blondes stands calmly under bright industrial lights , surrounded by a team of stunned scientists and technicians. She wears a reinforced custom sports bra and micro-shorts , still barely managing to contain her exaggerated curves and outrageously muscular form. Wires , sensors , and biometric pads line her biceps , chest , and quads — trying to capture data as she flexes for the assembled team. Behind her is a steel test rig rated for 10 tons — visibly trembling as she curls a solid 600-pound barbell like it’s made of foam. Her vascular , glistening biceps swell with every rep , stretching the skin like drumheads. Nearby monitors show numbers spiking beyond red zones , graphs crashing , and readings that no one has ever seen before. One screen simply flashes: **“ERROR — MAX LIMIT EXCEEDED”** The second woman stands off to the side , already tested and still cooling down , a towel slung over her mountainous shoulder. She watches her rival with crossed arms and a subtle , amused grin — waiting to see if the machines can handle her , too. The lab is a blend of ultra-modern science and disbelief. Crates of bent steel samples , cracked pressure pads , and failed grip test rigs line the walls. A group of scientists , some wide-eyed and others scribbling furiously , huddle near the data terminals. One whispers , “This can’t be real , ” while another simply stares , jaw slack. Shot on Canon EOS R5 and RED Komodo 6K , 35mm lens , ISO 100 , f/2.2 , cinematic industrial light temperature (cool white with warm highlights). 8K ultra-photorealistic , extreme detail in muscle strain , lab tech reflections , fabric tension , HDR lighting , sweat glisten , glowing monitor displays. --no cartoon , anime , stylization , nudity , blur , smoothing , distortions , uncanny rendering ,

Нужно сделать дизайн-макет для такого html-кода <section class="home-padding homeBenefits"> <div class="page-container"> <h2 class="home-title" data-heading-tag="H2">Наши преимущества</h2> <div class="homeBenefits-list"> <div class="homeBenefits-block"> <div class="homeBenefits-item"> <div class="homeBenefits-item__title"> 30 лет </div> <div class="homeBenefits-item__subtitle"> на рынке России </div> <div class="homeBenefits-item__line"> </div> <div class="homeBenefits-item__text"> Большая экспертиза в ИТ и бытовой технике </div> </div> </div> <div class="homeBenefits-block"> <div class="homeBenefits-item"> <div class="homeBenefits-item__title"> 600+ </div> <div class="homeBenefits-item__subtitle"> сотрудников </div> <div class="homeBenefits-item__line"> </div> <div class="homeBenefits-item__text"> Высокая компетенция специалистов в своем деле </div> </div> </div> <div class="homeBenefits-block"> <div class="homeBenefits-item"> <div class="homeBenefits-item__title"> 50 000+ </div> <div class="homeBenefits-item__subtitle"> кв. метров </div> <div class="homeBenefits-item__line"> </div> <div class="homeBenefits-item__text"> Складских помещений класса А в Москве и Санкт-Петербурге </div> </div> </div> <div class="homeBenefits-block"> <div class="homeBenefits-item"> <div class="homeBenefits-item__title"> >40 000 </div> <div class="homeBenefits-item__subtitle"> товаров в каталоге </div> <div class="homeBenefits-item__line"> </div> <div class="homeBenefits-item__text"> Ежедневное обновление ассортимента </div> </div> </div> <div class="homeBenefits-block"> <div class="homeBenefits-item"> <div class="homeBenefits-item__title"> 3 </div> <div class="homeBenefits-item__subtitle"> офиса в России </div> <div class="homeBenefits-item__line"> </div> <div class="homeBenefits-item__text"> Москва , Санкт-Петербург , Красноярск </div> </div> </div> <div class="homeBenefits-block"> <div class="homeBenefits-item"> <div class="homeBenefits-item__title"> 8 000+ </div> <div class="homeBenefits-item__subtitle"> активных партнеров </div> <div class="homeBenefits-item__line"> </div> <div class="homeBenefits-item__text"> Широкая сеть партнеров по всей России </div> </div> </div> <div class="homeBenefits-block"> <div class="homeBenefits-item"> <div class="homeBenefits-item__title"> 500+ </div> <div class="homeBenefits-item__subtitle"> брендов </div> <div class="homeBenefits-item__line"> </div> <div class="homeBenefits-item__text"> Российских и международных производителей </div> </div> </div> <div class="homeBenefits-block"> <div class="homeBenefits-item"> <div class="homeBenefits-item__title"> >20 000 </div> <div class="homeBenefits-item__subtitle"> отгрузок еженедельно </div> <div class="homeBenefits-item__line"> </div> <div class="homeBenefits-item__text"> С быстрой логистикой по территории России и СНГ </div> </div> </div> </div> </div> </section> ,
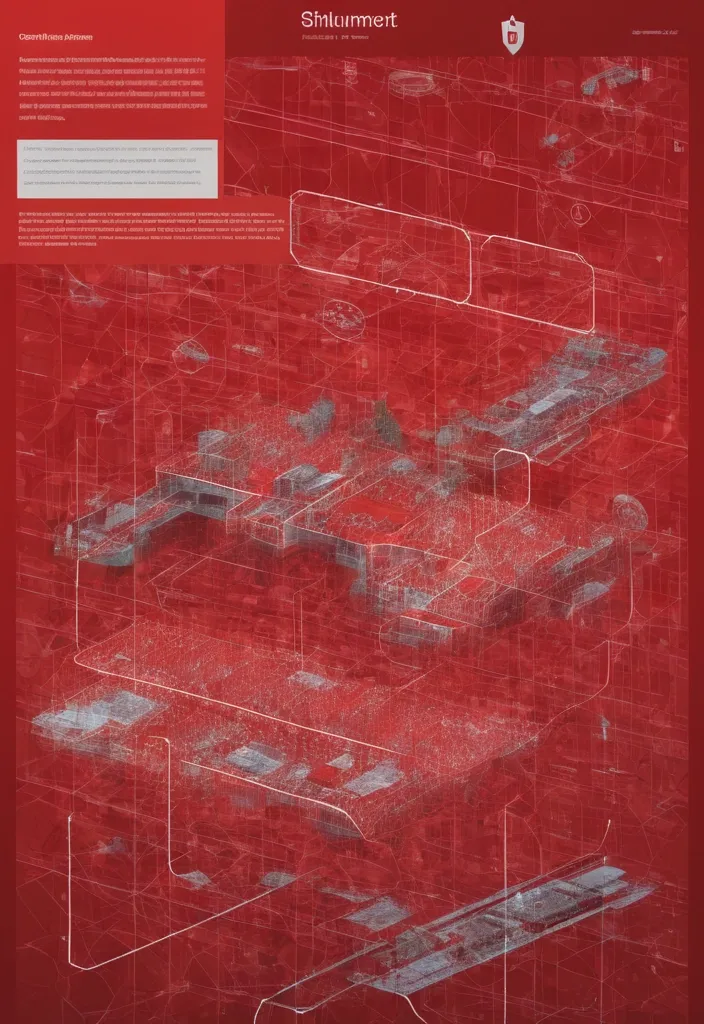
Ultimate Sanctions Infographic Prompt Style: "Geopolitical editorial illustration blended with data visualization , in the style of The Economist meets protest art – sophisticated yet confrontational" Core Elements: Title Treatment "GLOBAL SANCTIONS vs RUSSIA (2023-2024)" in fractured bold font (like "Bebas Neue" with cracks) Subtitle: "Economic Countermeasures to the Ukraine Invasion" in white on red ribbon Structural Layout 5 interconnected hexagons (honeycomb pattern) representing sanction categories Flowing red "impact waves" radiating from a stylized Russian map outline Category Visuals (per section) FINANCE: 3D golden vault with "$300B" padlock Falling SWIFT logo shattering like glass TECH TRADE: Broken semiconductor wafer forming stop sign Airbus/Boeing parts with "BANNED" stamps ELITE TARGETS: Flat-design oligarch portraits with red "X" overlays Pixelating superyacht sinking into money waves Data Highlights Animated-style percentage badges: "90%" (EU oil reduction) burning like fuel "$60" (price cap) as barrel-shaped neon sign Mini-timeline showing sanction escalation phases Technical Parameters: Resolution: 8K (7680x4320 for print/presentation) Color Profile: CMYK for professional printing Layers: Separate text/background layers (for easy editing) Format Options: ,
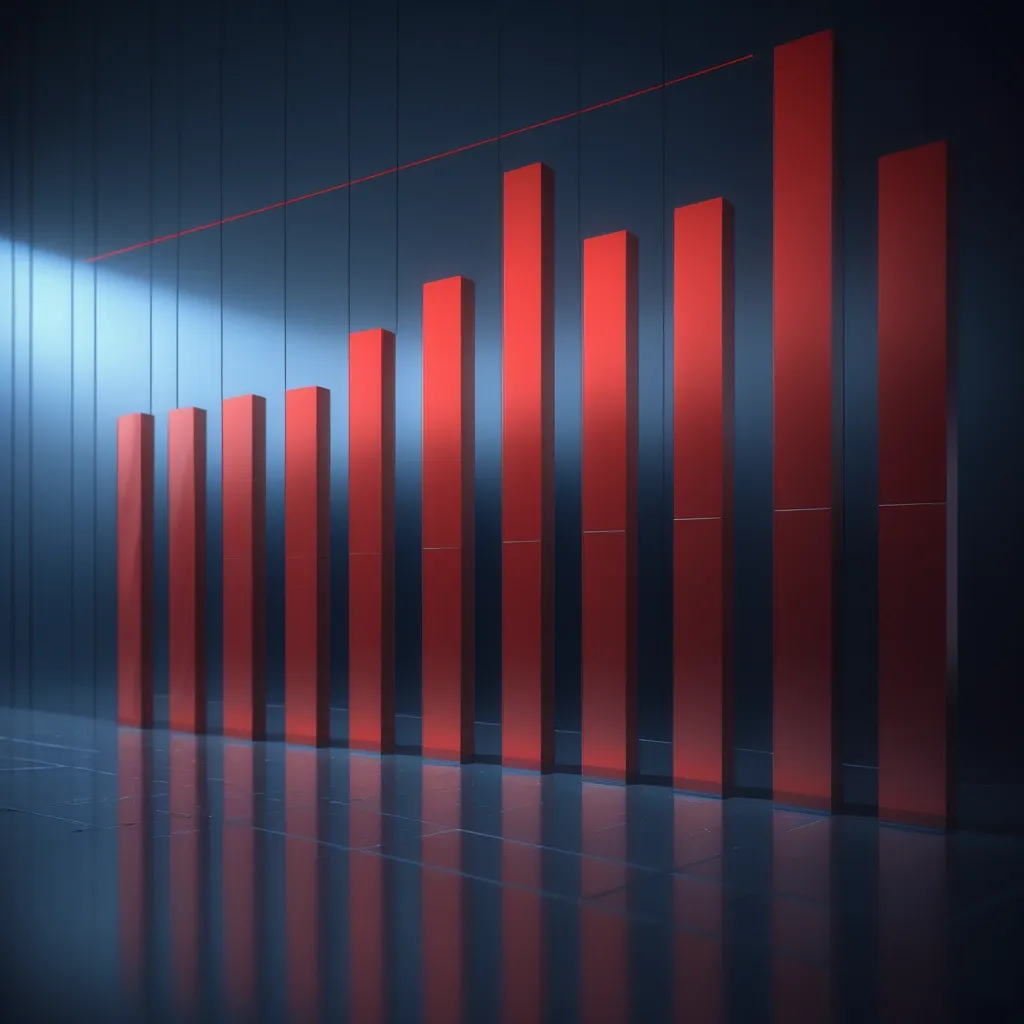
Highly detailed professional concept art. Visualizing **Data Performance and Transformation: a clean , elegant bar chart showing distinct red bars representing losses pointing downward below a clear baseline , and blue bars representing growth pointing upward above the baseline.** Stylized graphical elements within an abstract background. Visually deep and layered composition. Rich professional color harmony focusing on professional blues , reds , and complementary corporate tones. Prominent light sources , profound shadows , subtle cinematic lighting , high-quality studio render , refined corporate aesthetics , --ar 4:1 ,
Design a modern and sleek logo for a digital trading platform. The core shape should be a hexagon , symbolizing strength , stability , and connectivity. The logo should convey trust , innovation , and speed — key traits of a cutting-edge trading environment. Incorporate subtle references to charts , graphs , or digital lines to hint at financial markets and data flow. Use a cool tech color palette (like navy , teal , silver , or electric blue) , and aim for a minimalist , professional style that appeals to both retail and institutional traders ,