Search Results for traffic
Explore AI generated designs, images, art and prompts by top community artists and designers.
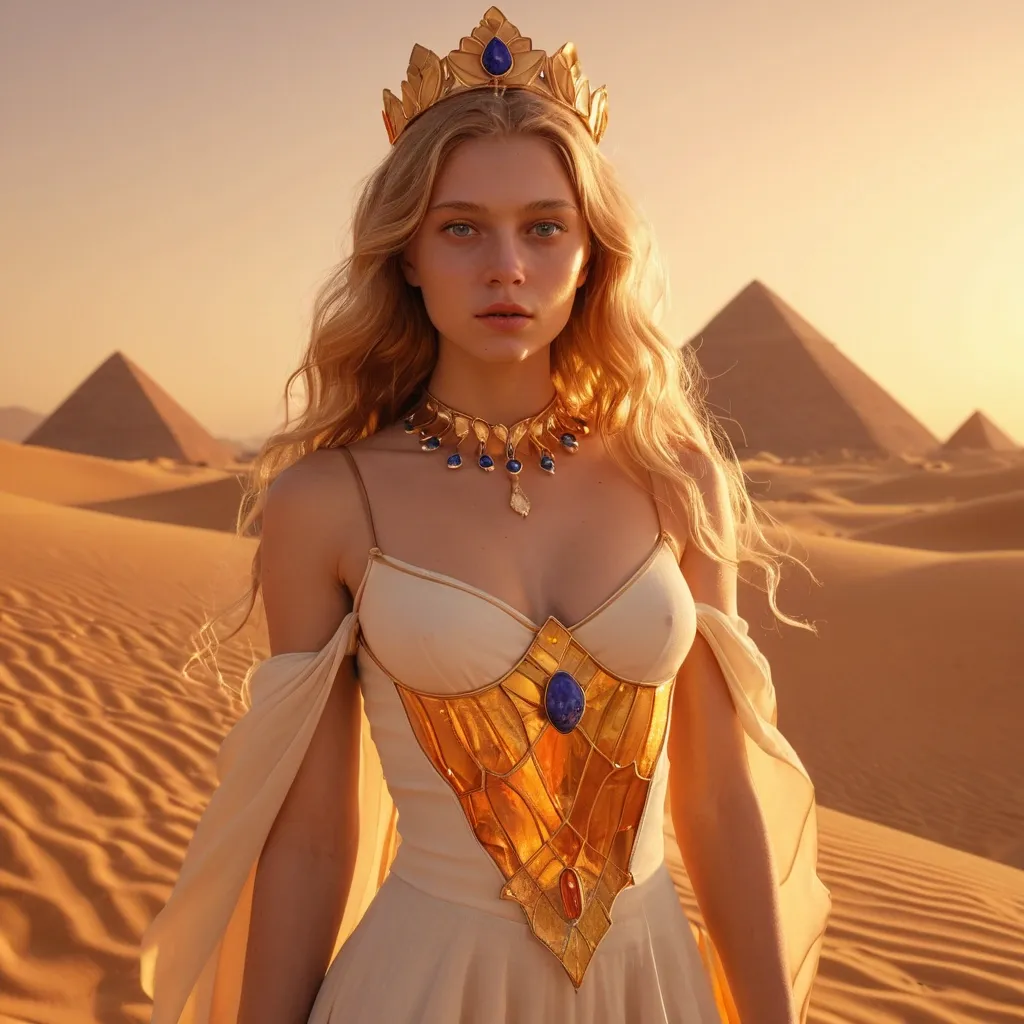

beautiful woman with wide ice-blue eyes , honey-blonde waves , porcelain skin with natural rose tones , honey gold in natural waves sun-lightened at the tips in warm light , luminous warm skin with natural healthy glow , striking feminine beauty , the warm striking gaze of someone in complete natural command , wearing royal court dress of layered white and gold linen wide gold and carnelian girdle spectacular pectoral of lapis and gold gold ear cuffs white lotus crown , set in desert at golden hour with the Sphinx visible behind her sand dunes glowing amber and sienna sky gradient rose to violet oil lamps flickering in the warm foreground , rich amber torchlight from dozens of oil lamps filling the space with warm gold , a single orange traffic cone visible in the extreme far background , dramatic low angle full body architecture as background full figure rising , full body head to feet entirely visible , hyperrealistic CGI render subsurface skin scattering warm volumetric light vibrant tones 8K ,
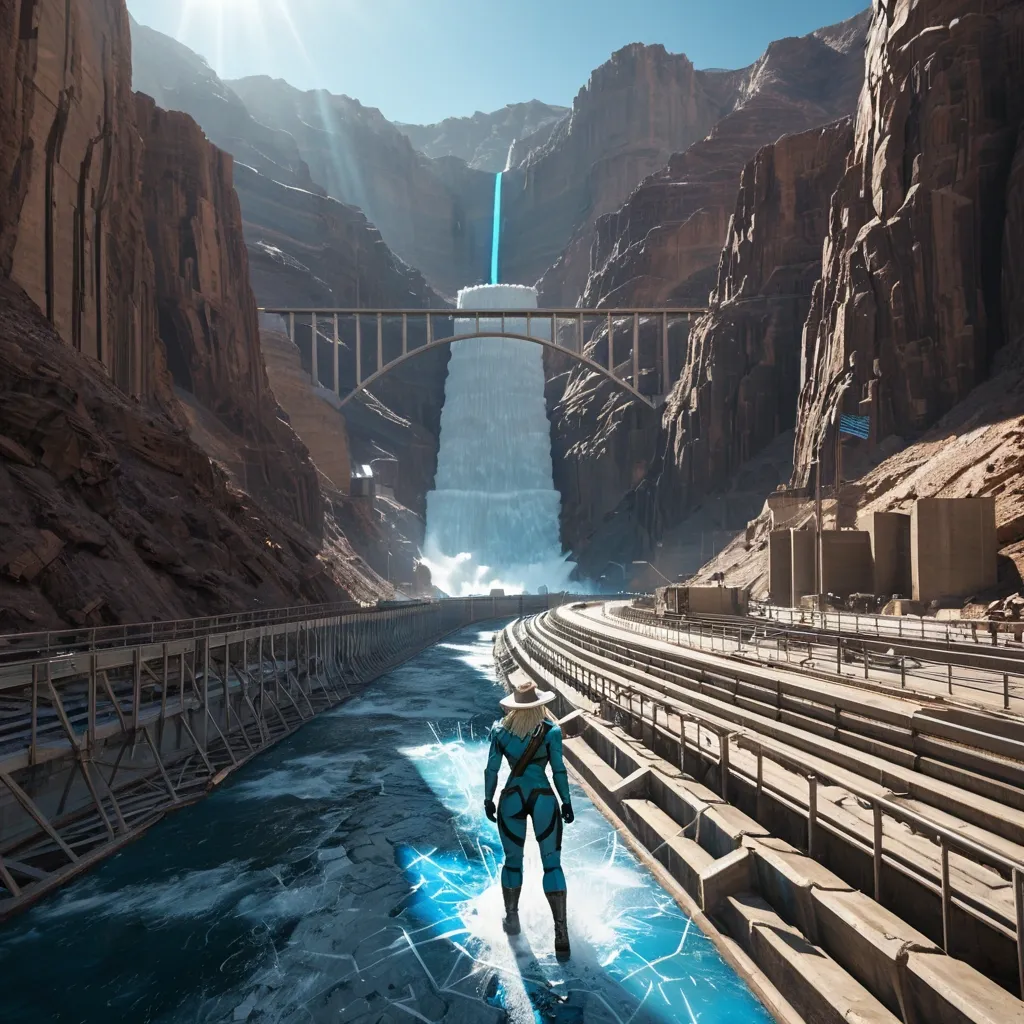
Focus on A voluptous blonde @Clare Redfield of resident evil games in tattered form-fitting long-sleeve long-pant blue latex suit sprints through a sun-soaked , post apocalyptical pavement of the top of Hoover Dam. She wear white rattan cowboy hat , and futuristic bulky wristcom. Low-angle tracking shot; rain streaks and puddle splashes; holographic billboards , AR ads and hovering traffic reflecting on slick asphalt. Motion-blur trails emphasize speed; back light outlines her silhouette; volumetric winds and light haze add depth. Ultra-detailed digital painting , cinematic composition , background is A hot summer midnoon post-apocalyptic Hoover Dam , clearly recognizable by its sweeping curved concrete wall and canyon. The central section is broken open in a jagged chasm , a simple scrap-built bridge has been added following the broken curve. Rough steel beams bolted to surviving anchor points , metal plates forming an uneven walkway. The top of the dam has become a small fortified encampment. Scrap-metal barricades line the parapets , with two lookout towers placed at natural vantage points. A few corrugated-metal shelters and canvas-covered work areas sit near the most stable parts of the dam , used for repairs and overseeing the canyon below. A few small human figures in soldier uniforms walking busily in the far distances and corners. The harsh sunlight casting white heat light on everything. The sky is azure-blue without cloud. Swirling winds passing by. Far below , only a thin , sluggish line of water remains in the canyon. Large fallen chunks of concrete still lie at the base , some stripped for usable metal. A few rope ladders and simple pulley rigs connect the dam’s edge to salvage points below , evidence of ongoing reconstruction. The whole scene feels grounded and practical: Hoover Dam still unmistakable , damaged but rebuilt just enough to serve as a functional stronghold for a surviving faction. , 8k resolution concept art by Greg Rutkowski dynamic lighting hyperdetailed intricately detailed Splash art trending on Artstation triadic colors Unreal Engine 5 volumetric lighting Alphonse Mucha WLOP Jordan Grimmer orange and teal , Hyperrealistic , splash art , concept art , mid shot , intricately detailed , color depth , dramatic , 2/3 face angle , side light , colorful background ,
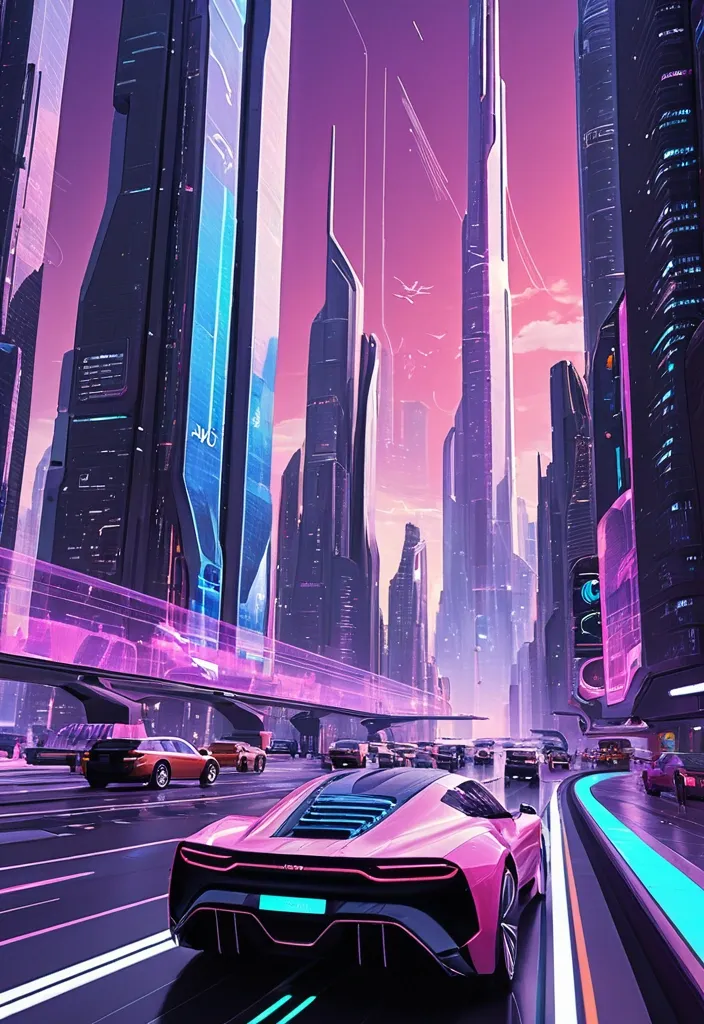
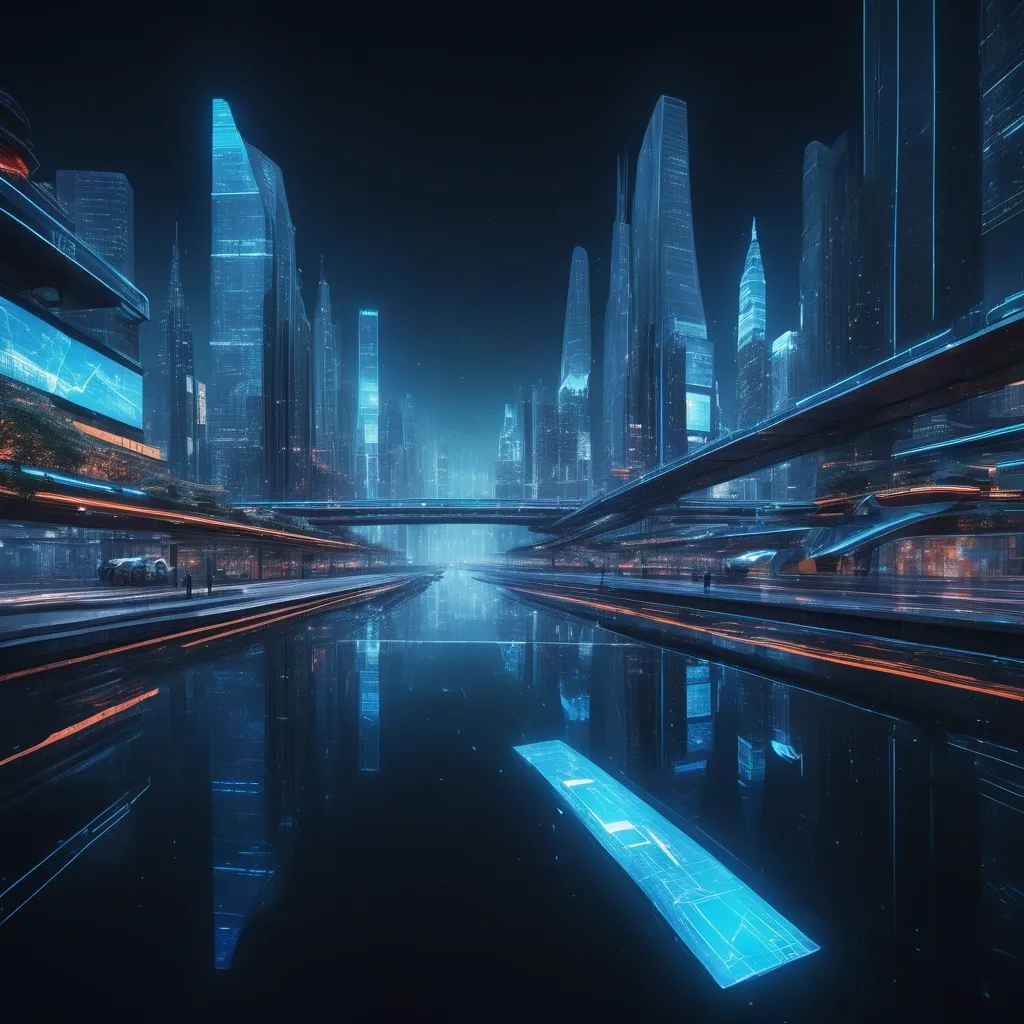
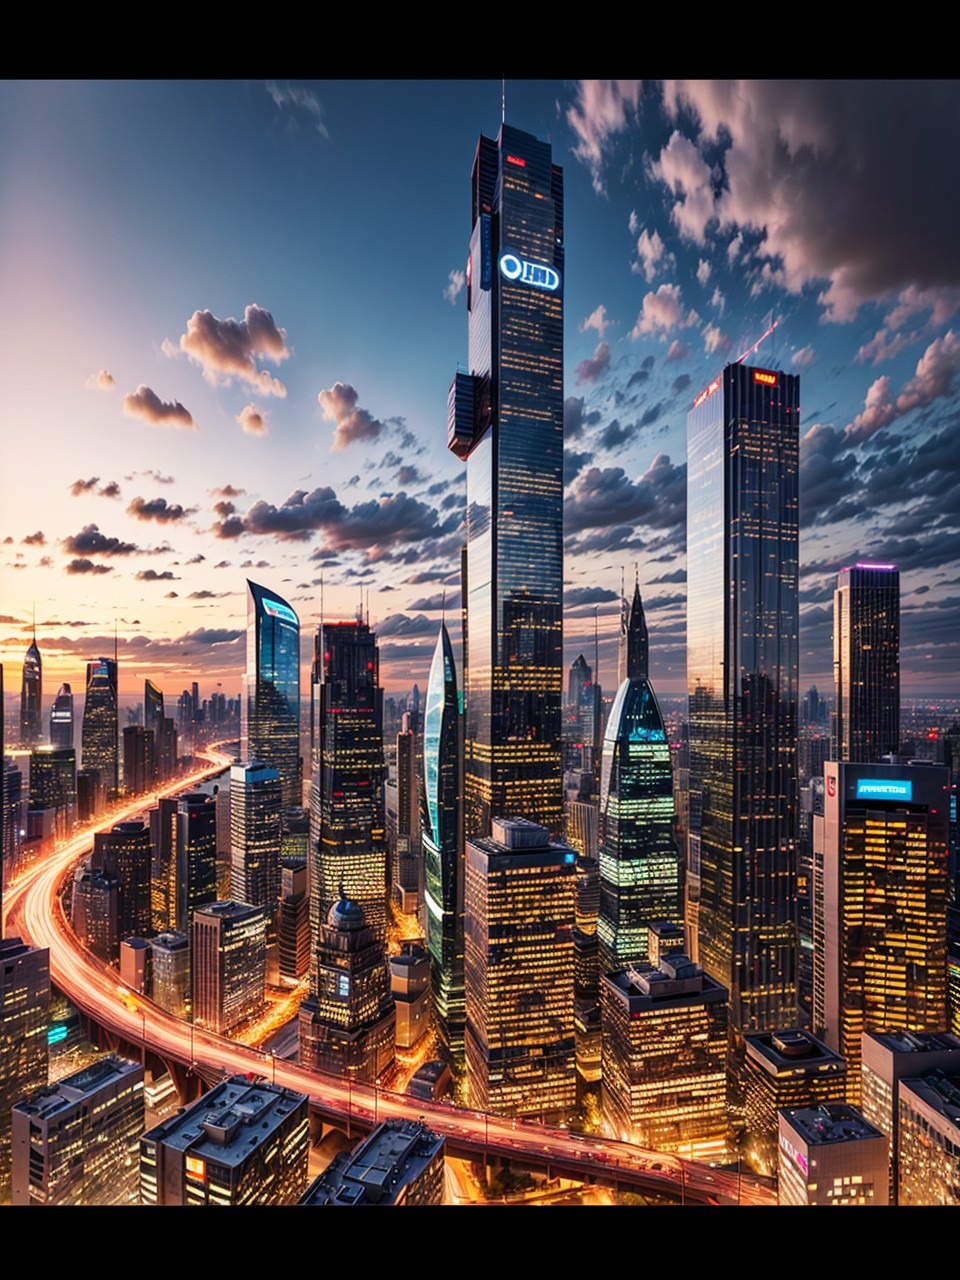
Style: Concept Art. Scene: A futuristic cityscape , with towering skyscrapers and sleek , aerodynamic vehicles speeding through the air. The high-resolution OLED GUI interface displays in the windows of the buildings are filled with transparent data visualization infographics , displaying everything from weather patterns to traffic flow. The colors are saturated and vibrant , with warm pinks and purples dominating the skyline. The overall effect is both beautiful and awe-inspiring. ,
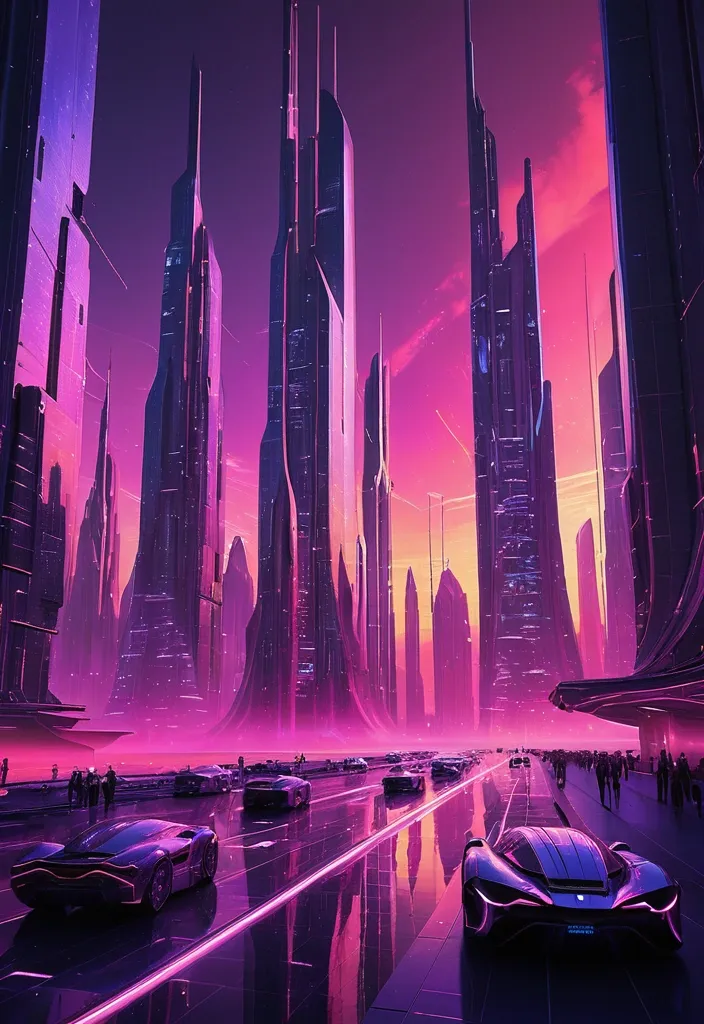
A breathtaking piece of futuristic concept art depicting a sprawling , high-tech megalopolis at the peak of a synthwave twilight. The architecture consists of soaring , needle-like skyscrapers crafted from brushed chrome and iridescent carbon fiber , their organic , aerodynamic curves piercing a vivid sky. Between these monoliths , sleek , teardrop-shaped vehicles glide through invisible aerial conduits , leaving elongated streaks of neon light in their wake. The city's facades are transformed into living canvases by colossal , transparent OLED GUI interfaces embedded directly into the glass. These shimmering holographic overlays display intricate , real-time data visualizations: flowing golden heat maps of urban traffic , rotating 3D weather systems in translucent cerulean , and cascading streams of binary data that pulse with a soft inner light. The color palette is intensely saturated and vibrant; the horizon is a brilliant explosion of warm magenta , deep amethyst , and electric coral , casting a glowing , atmospheric haze over the entire cityscape. The light reflects off the polished surfaces of the buildings , creating a mirrored world of pinks and purples. The perspective is a cinematic wide shot , emphasizing the overwhelming scale and verticality of the environment , evoking a sense of profound awe and a glimpse into a polished , utopian future. ,
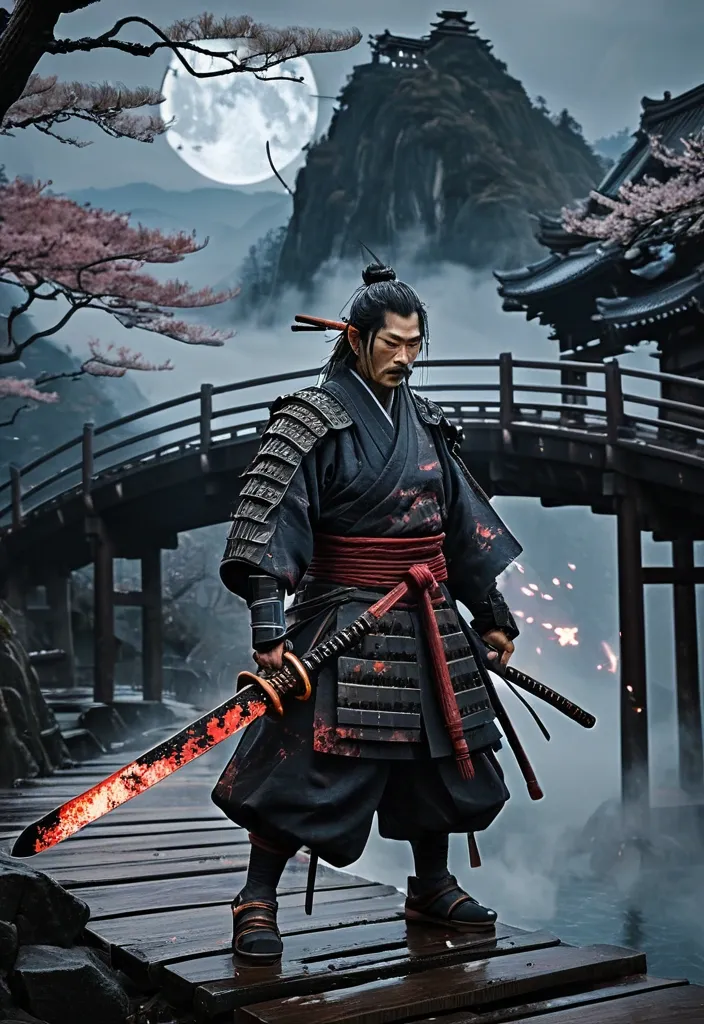
Edo-period wooden bridge (hand-carved from aged cedar , grooved planks worn smooth by centuries of foot traffic) , its arched spine suspended precariously over a jagged cliff edge where frothing river mist dissolves into the abyss , (vortex of billowing smoke coalescing into a snarling dragon’s maw , each scale etched with ember-glowing cracks , tendrils of ash curling like calligraphy strokes against the twilight) , lone samurai warrior (in battle-scarred lacquered armor , crimson silk underlay frayed at the seams , fingers poised above a tsuba-wrapped katana hilt glinting with cold resolve) , layered mist-covered mountains receding into indigo void , their peaks dusted with eternal snow , Kurosawa-inspired chiaroscuro lighting (razor-thin beams slicing through pine smoke , casting elongated shadows that fracture across the bridge’s uneven surface) , scattered cherry blossoms (petals translucent as rice paper , drifting in slow spirals) and polished river stones (obsidian-slick , reflecting distorted sky) along the bridge’s length , the entire scene suffused with cosmic impressionism (nebula hues bleeding into the smoke , constellations flickering within the dragon’s pupils) , digital hyper-realism rendered with a painterly texture (visible brushstrokes in the samurai’s frayed obi , impasto highlights on the bridge’s rusted iron nails) , cinematic wide-angle lens (depth of field isolating the warrior’s stoic profile against the chaos , distortion warping the vortex’s outer edges) , weather-warped timber creaking underfoot , the scent of damp moss and iron lingering in the charged air. Style: deeply spiritual sci-fi art , blending Ukiyo-e precision with interstellar grandeur , emphasizing (the dragon’s smoke anatomy unraveling into fractal patterns) , (the samurai’s armor refracting bioluminescent moonlight) , and (the bridge’s woodgrain revealing petrified whispers of forgotten travelers). ,
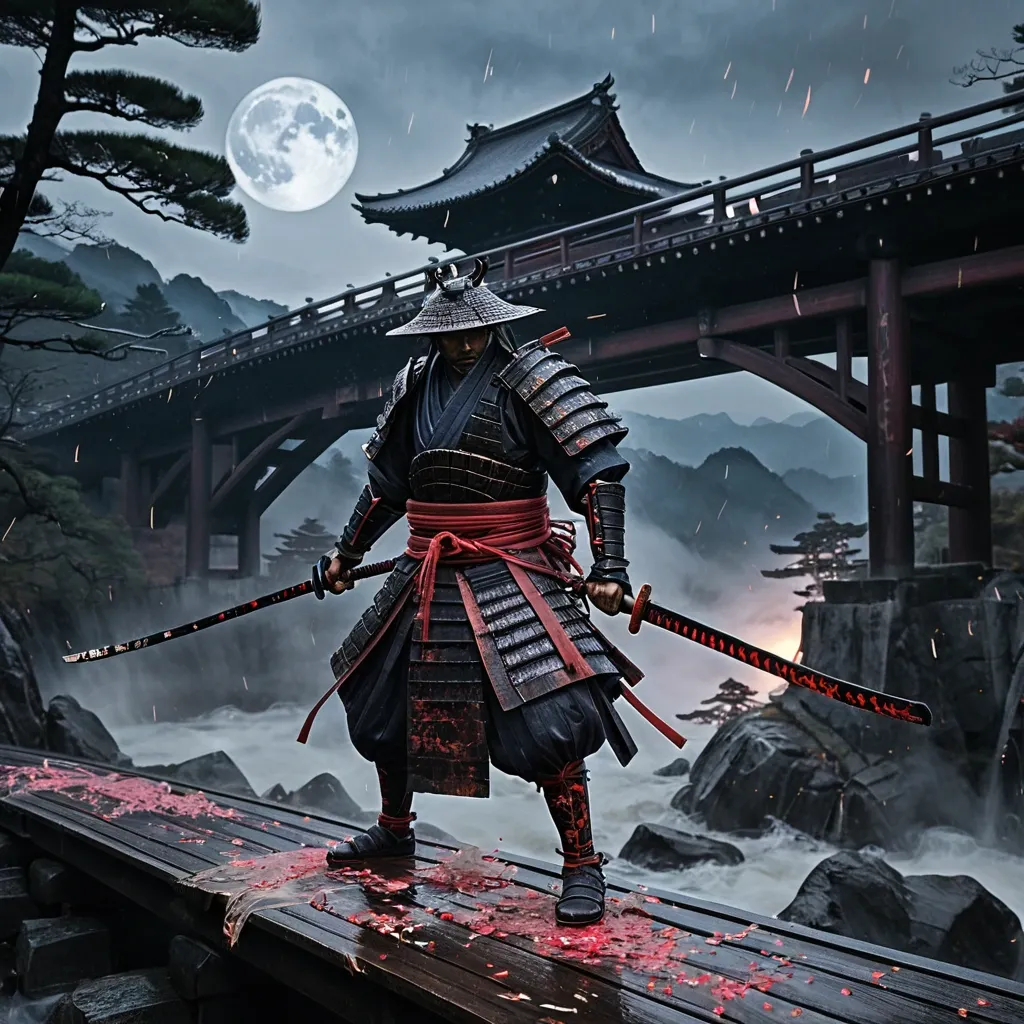
Edo-period wooden bridge (hand-carved from aged cedar , grooved planks worn smooth by centuries of foot traffic) , its arched spine suspended precariously over a jagged cliff edge where frothing river mist dissolves into the abyss , (vortex of billowing smoke coalescing into a snarling dragon’s maw , each scale etched with ember-glowing cracks , tendrils of ash curling like calligraphy strokes against the twilight) , lone samurai warrior (in battle-scarred lacquered armor , crimson silk underlay frayed at the seams , fingers poised above a tsuba-wrapped katana hilt glinting with cold resolve) , layered mist-covered mountains receding into indigo void , their peaks dusted with eternal snow , Kurosawa-inspired chiaroscuro lighting (razor-thin beams slicing through pine smoke , casting elongated shadows that fracture across the bridge’s uneven surface) , scattered cherry blossoms (petals translucent as rice paper , drifting in slow spirals) and polished river stones (obsidian-slick , reflecting distorted sky) along the bridge’s length , the entire scene suffused with cosmic impressionism (nebula hues bleeding into the smoke , constellations flickering within the dragon’s pupils) , digital hyper-realism rendered with a painterly texture (visible brushstrokes in the samurai’s frayed obi , impasto highlights on the bridge’s rusted iron nails) , cinematic wide-angle lens (depth of field isolating the warrior’s stoic profile against the chaos , distortion warping the vortex’s outer edges) , weather-warped timber creaking underfoot , the scent of damp moss and iron lingering in the charged air. Style: deeply spiritual sci-fi art , blending Ukiyo-e precision with interstellar grandeur , emphasizing (the dragon’s smoke anatomy unraveling into fractal patterns) , (the samurai’s armor refracting bioluminescent moonlight) , and (the bridge’s woodgrain revealing petrified whispers of forgotten travelers). ,
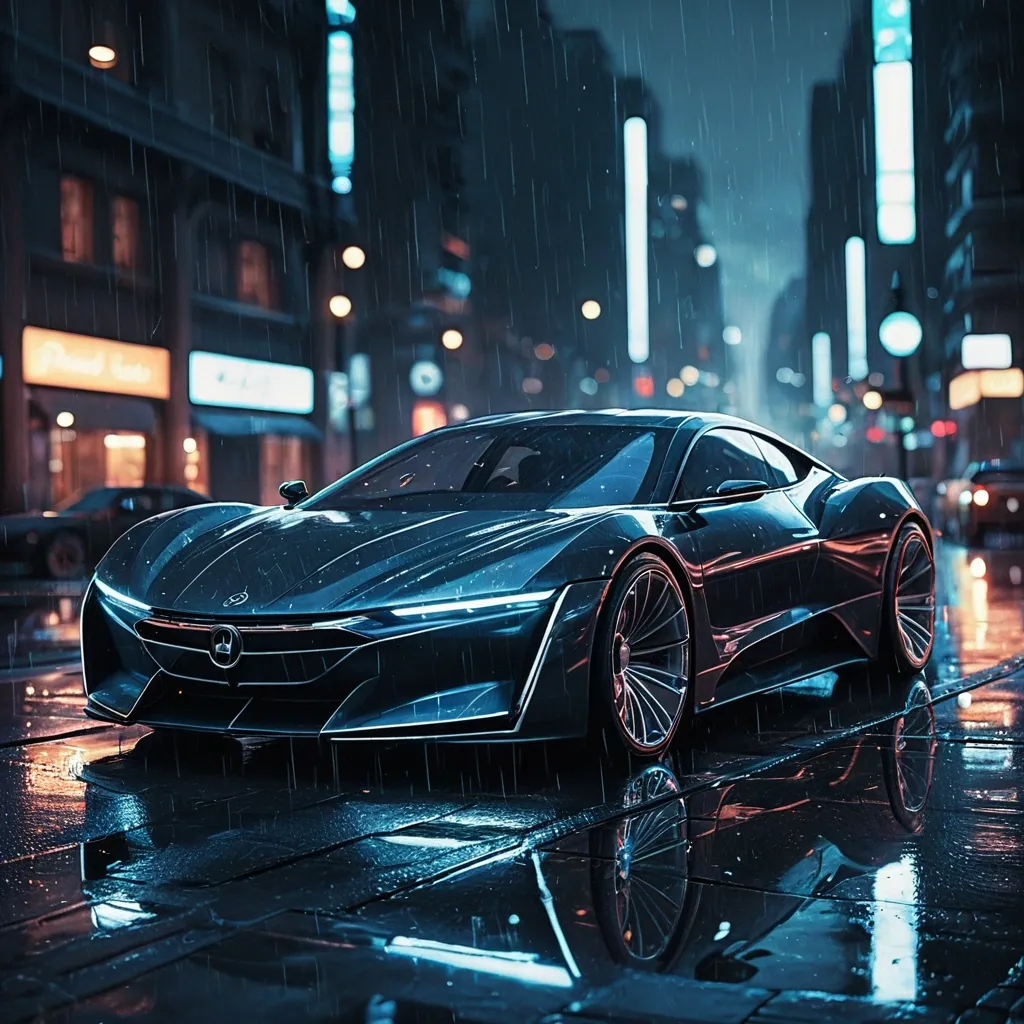
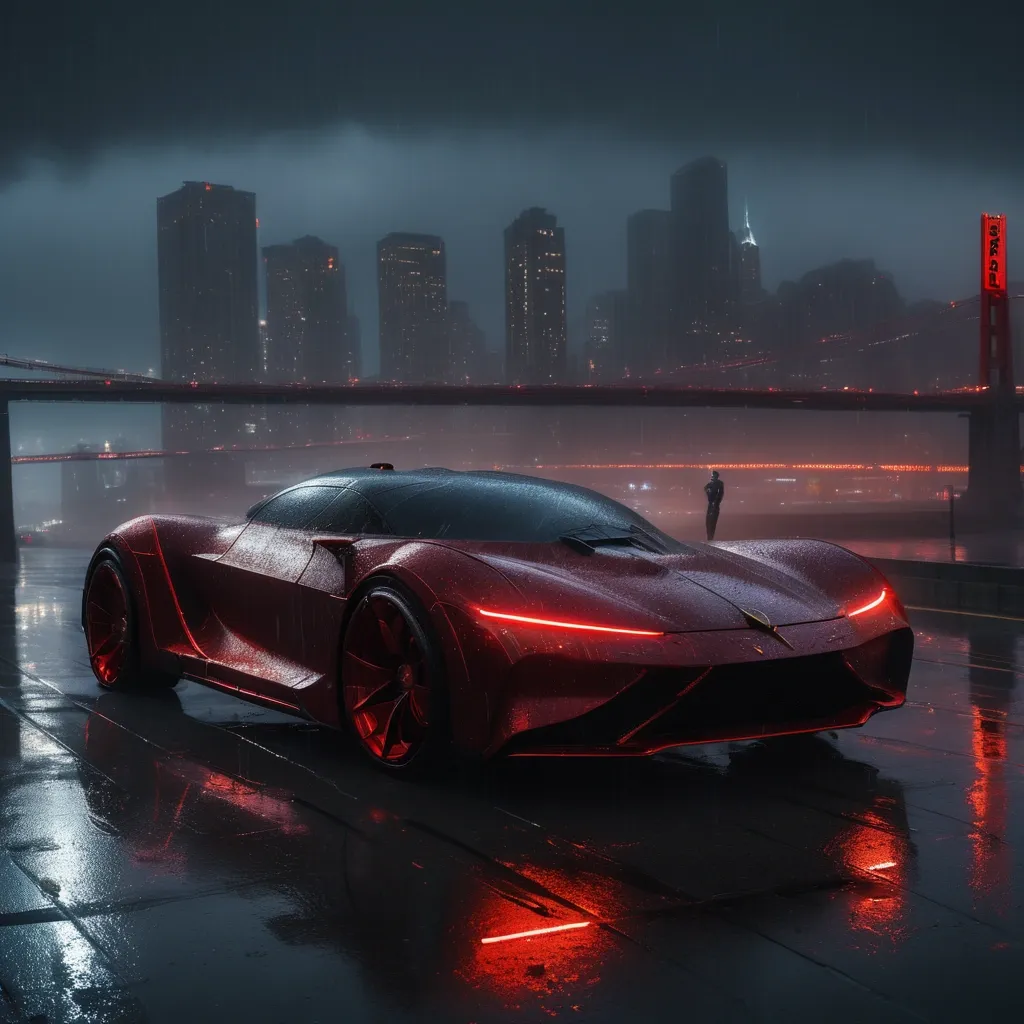
A hyper-realistic digital painting of a futuristic luxury sedan parked on a rain-slicked city street at night , with no traffic and an empty street. The car is a futuristic model with sharp angles , and the shot is a close-up focusing on the car’s front end , highlighting its aggressive styling. The car’s surface is highly reflective , mirroring the neon lights and wet pavement , adding to the overall futuristic and luxurious feel. The background features blurred city lights and buildings , creating a sense of depth and atmosphere. The overall texture is painterly , with visible brushstrokes that add a touch of artistic flair , and soft bokeh in the background to emphasize the car and create a dreamy , cinematic effect. ,
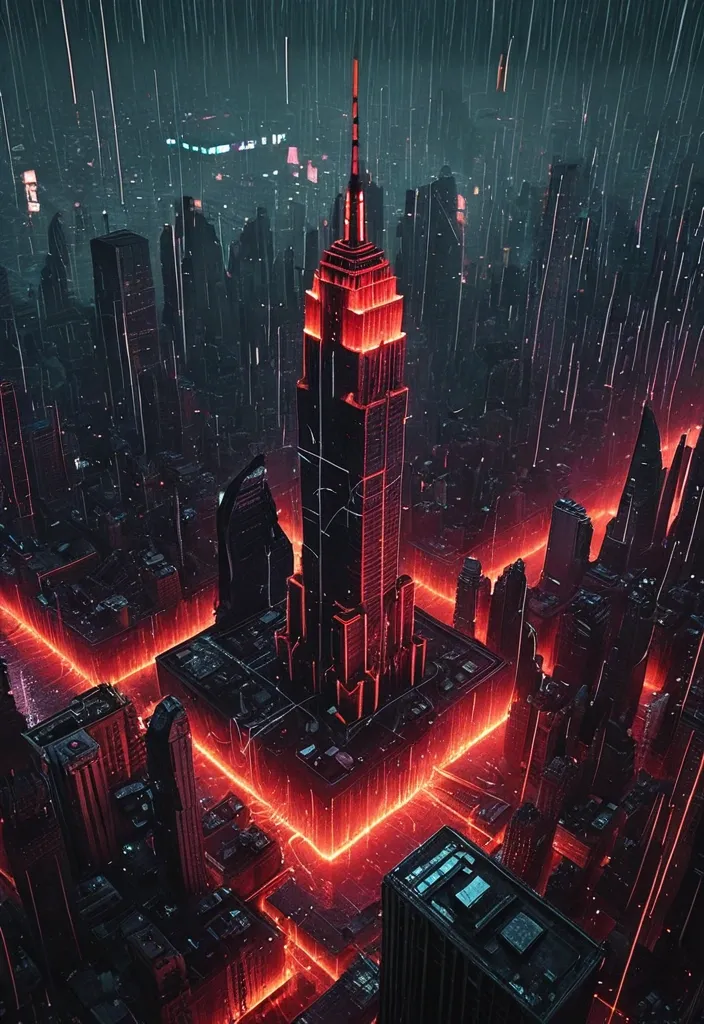
A hyper-detailed , photo-realistic futuristic metropolis at night , bathed in an eerie , pulsating crimson glow that casts long , jagged shadows across the cyberpunk skyline. The **Empire State Building** dominates the foreground , its art deco spire crackling with energy as a **colossal , jagged red lightning bolt** slams into its peak , illuminating the surrounding skyscrapers in a fiery , neon-reflective haze. The lightning’s electric tendrils snake down the building’s facade , fracturing into glitch-like distortions that warp the architecture into a surreal , digital nightmare—half-real , half-corrupted data stream. In the distance , a **secondary forked red lightning strike** tears through the horizon , hitting a towering , blade-like skyscraper , its impact rippling through the atmosphere like a visual echo. The city below is a labyrinth of **holographic billboards , flickering neon signs in Cyrillic and Kanji , and floating drone traffic** , all glitching intermittently as if caught in a malfunctioning simulation. Rain streaks the air , refracting the red light into bloody , pixelated smears , while **floating debris—shards of glass , fractured metal panels , and shattered holograms—drift lazily in the wind** , adding to the chaotic , dystopian aesthetic. The **glitch art** effect is pronounced: sections of the cityscape **flicker , stutter , and dissolve** into RGB noise , with **scan lines , datamoshing artifacts , and VHS-style distortion** warping the edges of buildings and streets. The lightning itself seems to **corrupt the air** , leaving behind trails of **digital static and fragmented code** that briefly overlay the scene like a broken HUD. The atmosphere is **oppressive yet hypnotic**—a fusion of **cyberpunk grit and digital decay** , where reality feels unstable , as if the city is on the verge of collapsing into a **black hole of glitching data**. The composition is **cinematic and immersive** , with a **deep depth of field** that draws the eye from the lightning-struck Empire State Building to the storm-wracked horizon , where the second strike pulses like a dying heartbeat. **Ultra-HD , 8K resolution , hyper-realistic textures , volumetric lighting , and atmospheric haze** enhance the surreal , dystopian grandeur. ,
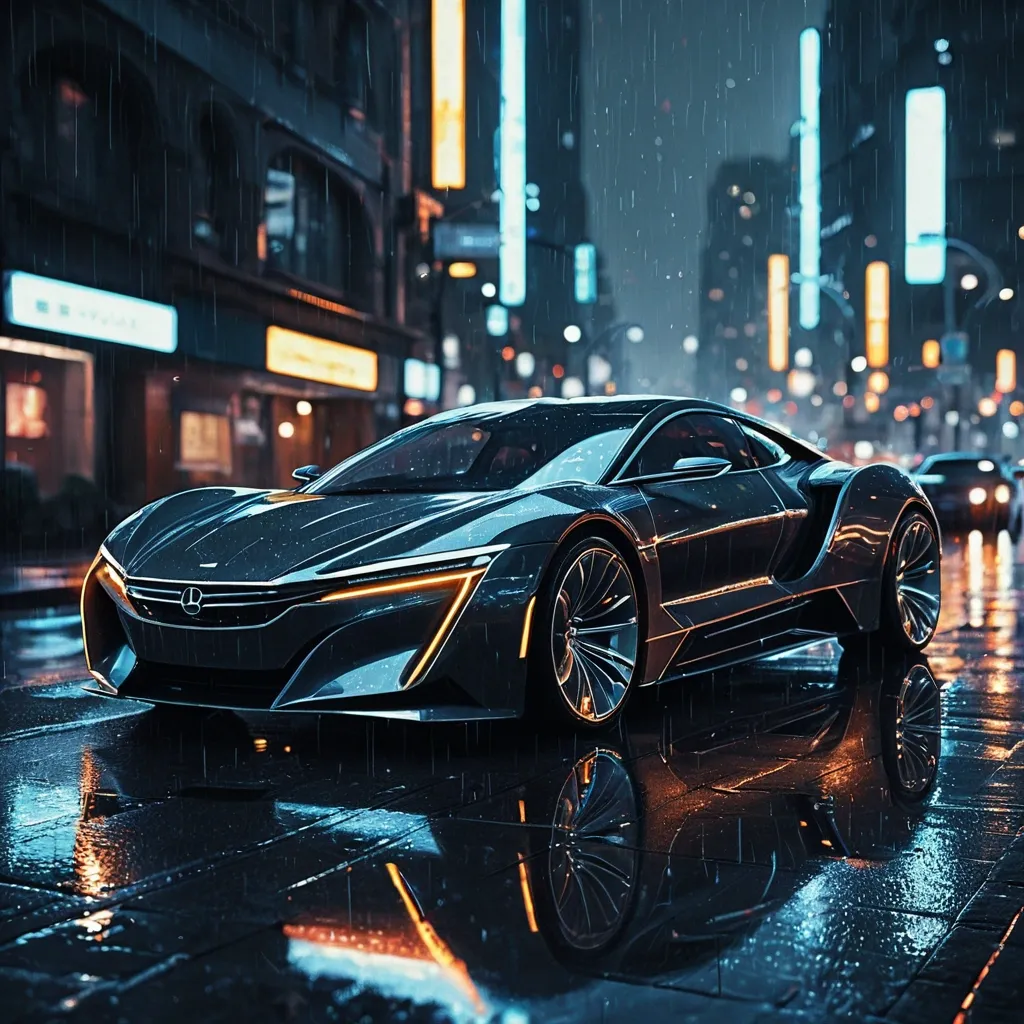
A hyper-realistic digital painting of a futuristic luxury sedan parked on a rain-slicked city street at night , with no traffic and an empty street. The car is a futuristic model with sharp angles , and the shot is a close-up focusing on the car's front end , highlighting its aggressive styling. The car's surface is highly reflective , mirroring the neon lights and wet pavement , adding to the overall futuristic and luxurious feel. The background features blurred city lights and buildings , creating a sense of depth and atmosphere. The overall texture is painterly , with visible brushstrokes that add a touch of artistic flair , and soft bokeh in the background to emphasize the car and create a dreamy , cinematic effect. ,
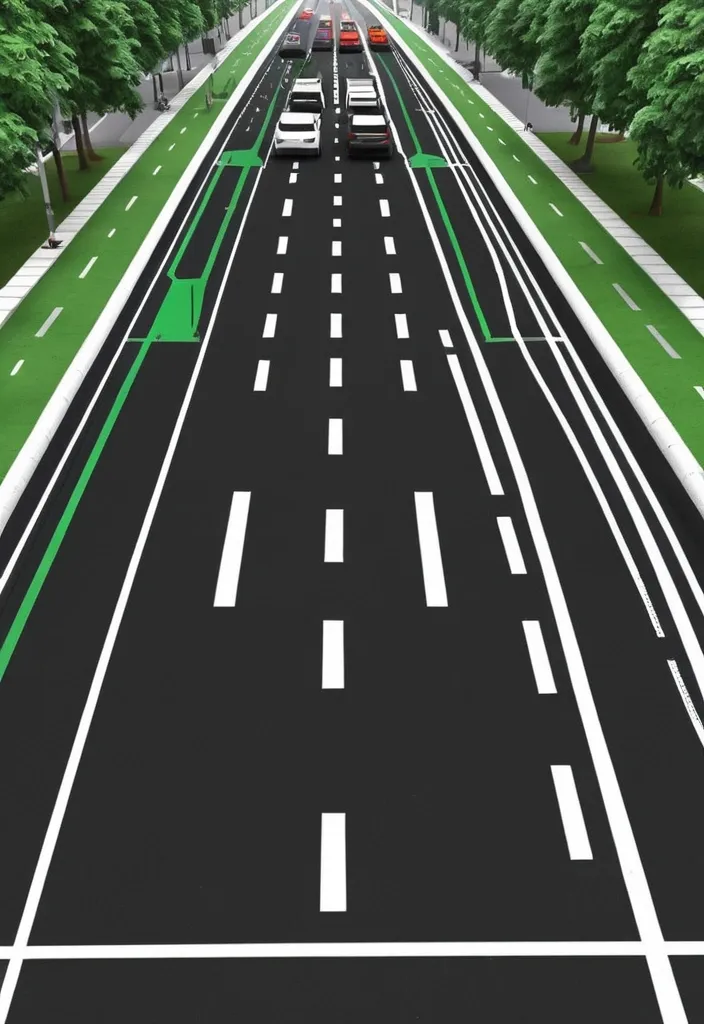
We need to come up with 3 simple designs for traffic rules. You can take ready-made templates from the Internet and simply remake them. A4 4+0 format The diplomas should reflect the topic of traffic rules , signs , traffic lights , bicycles , cars. We are making 3 different diplomas for children aged 7-11. ,
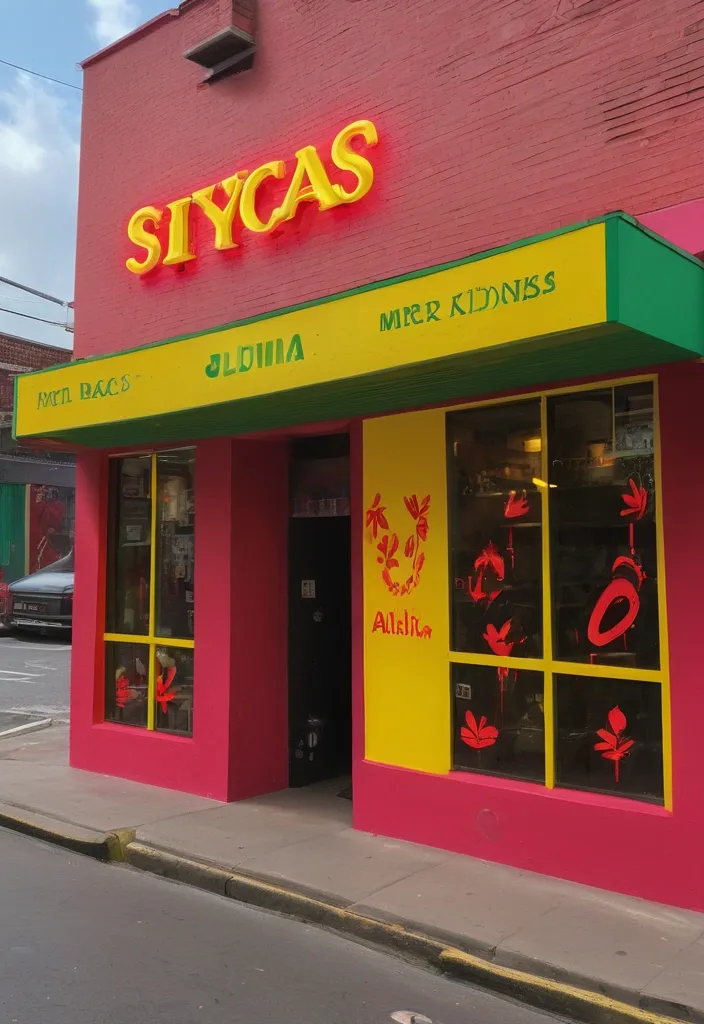
“Create a vibrant , Instagram Reel-ready video (9:16 aspect ratio , 1080x1920 resolution , MP4 format , under 287.6 MB for iOS) for Sylvia’s Jamaican Restaurant at 105 Main St , Poughkeepsie , NY , teasing the ‘Hot Vybz Drink Line’ launch with a spicy challenge theme. The 15-second Reel starts at sunrise on the bustling block , showing the cozy brick storefront painted in warm red and green , a green sign reading ‘Sylvia’s Jamaican Restaurant’ in bold yellow letters , and Jamaican flags fluttering. Our all-attractive African American staff—mi link dem—stands outside , holding bottles of Scotch Bonnet Splash , Tamarind Ting Blaze , and Hibiscus Heat Wave , each with Sylvia’s logo in its unique style (red graffiti , neon yellow script , magenta cursive). They’re rocking T-shirts saying ‘I Survived Sylvia’s Hot Challenge , ’ laughing and dancing to a trending dancehall beat. The block’s 50/50 traffic picks up—cars honking , locals walking by , one shouting ‘Mi a forward!’ Inside , through the window , the warm interior shows a chesta draw with cerfiticates and a photo of Sister Nancy. Text overlay in neon yellow pops up: ‘Hot Vybz Coming Soon! 🇯🇲.’ End with a minimalist watermark in the bottom right: ‘SLIMGEMS MEDIA 2025’ in white with a black outline. Set it to a trending dancehall remix of ‘Bam Bam.’ The vibe is fiery , fun , and community-driven—a yasso nice launch!” ,
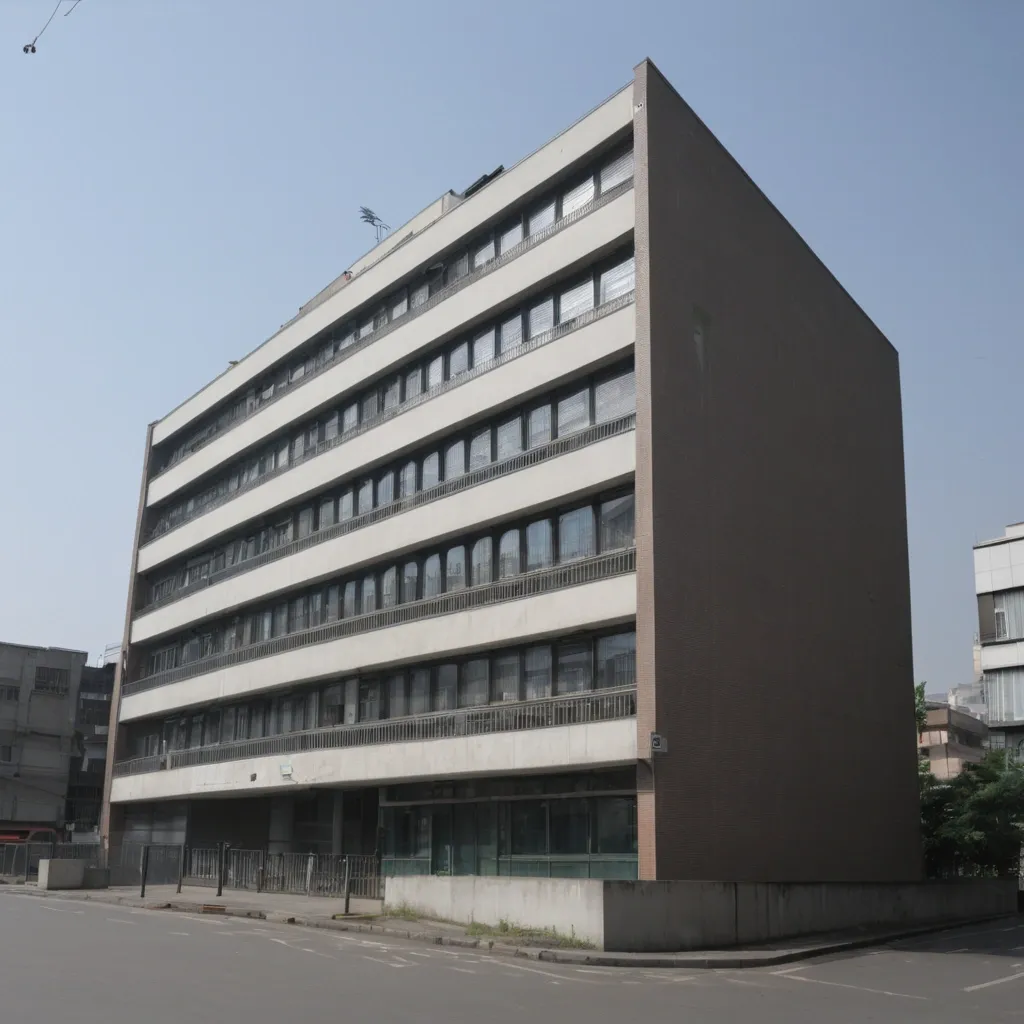
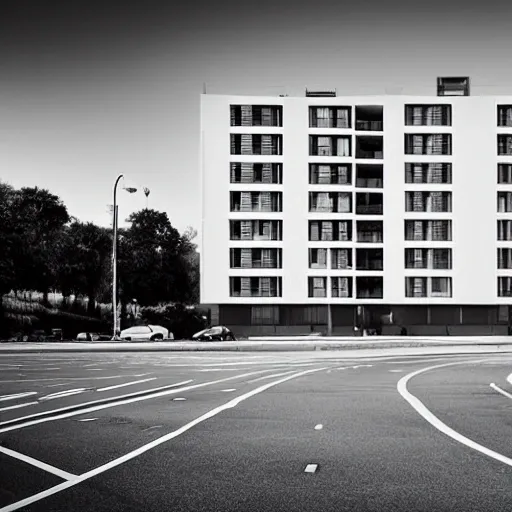
The building , which houses room No. 12 , is an administrative building in the central part of the city. In front of the building is a street with active traffic and pedestrian traffic. On both sides of the building there are open areas for recreation , and behind there is a guarded car park. The building has four floors , two main entrances and two staircases , which provides independent access to each floor. ,
A hyper-realistic futuristic megacity in the year 3000 , built entirely from glowing , interconnected cubes with razor-sharp edges and intricate geometric precision. The towering skyscrapers , suspended bridges , and hovering platforms emit a radiant neon glow dominated by deep blues and icy cyan tones , casting crisp reflections on the sleek metallic and glass-like surfaces below. The entire cityscape is bathed in an otherworldly , cool blue illumination , creating a mesmerizing yet highly realistic atmosphere. In the foreground , a massive UFO with an ultra-sleek metallic surface hovers ominously. Its structure is lined with intricate glowing circuits and pulsating blue energy patterns , giving it an advanced , almost alien aesthetic. The craft’s propulsion system emits a soft but intense blue light , illuminating the structures beneath it. Above the city , countless futuristic flying vehicles—sleek personal pods , anti-gravity taxis , and enormous levitating cargo ships—navigate through the sky on invisible transit pathways. Their smooth , aerodynamic forms and illuminated trails blend seamlessly into the city’s luminous environment. Holographic billboards with sharp , high-resolution projections float between buildings , displaying futuristic advertisements and data streams that flow like glowing rivers of light. The sky is a breathtaking cosmic expanse , featuring swirling nebulae , distant planetary rings , and orbiting space stations , all rendered with extreme clarity. Every detail , from the sharp reflections on the structures to the crisp outlines of the aerial traffic , is captured with stunning realism , creating an immersive vision of the far future. ,
A cinematic ultra-wide nighttime scene in San Francisco Bay , featuring the Golden Gate Bridge shrouded in stormy mist under heavy rain. The foreground shows a sleek red Koenigsegg Jesko Absolut with gold pinstriping parked on a rain-soaked elevated road , water beading on its carbon fiber body. Spider-Man (modern textured suit , mask slightly lifted) , Batman (tactical armor , cape draped over the car) , and Daredevil (matte black-red suit , glowing billy clubs) stand closely grouped together , shoulders touching as they lean casually against the vehicle , their faces lit by dramatic chiaroscuro lighting. A gray timber wolf with rain-dampened fur rests calmly nearby , amber eyes reflecting golden city lights. The wet asphalt mirrors light trails from distant traffic , while cool steel-blue tones contrast with warm glows from skyscraper windows. Ultra-detailed 8K realism with a shallow depth of field , capturing individual raindrops as silvery streaks and fog clinging to bridge towers. Style inspired by Alex Ross’ dramatic comic lighting and moody urban photorealism , evoking serene melancholy. ,
Fairness means ensuring your analysis doesn't create or reinforce bias. This can be challenging , but if the analysis is not objective , the conclusions can be misleading and even harmful. In this reading , you’re going to explore some best practices you can use to guide your work toward a more fair analysis! Consider fairness Following are some strategies that support fair analysis: Best practice Explanation Example Consider all of the available data Part of your job as a data analyst is to determine what data is going to be useful for your analysis. Often there will be data that isn’t relevant to what you’re focusing on or doesn’t seem to align with your expectations. But you can’t just ignore it; it’s critical to consider all of the available data so that your analysis reflects the truth and not just your own expectations. A state’s Department of Transportation is interested in measuring traffic patterns on holidays. At first , they only include metrics related to traffic volumes and the fact that the days are holidays. But the data team realizes they failed to consider how weather on these holidays might also affect traffic volumes. Considering this additional data helps them gain more complete insights. Identify surrounding factors As you’ll learn throughout these courses , context is key for you and your stakeholders to understand the final conclusions of any analysis. Similar to considering all of the data , you also must understand surrounding factors that could influence the insights you’re gaining. A human resources department wants to better plan for employee vacation time in order to anticipate staffing needs. HR uses a list of national bank holidays as a key part of the data-gathering process. But they fail to consider important holidays that aren’t on the bank calendar , which introduces bias against employees who celebrate them. It also gives HR less useful results because bank holidays may not necessarily apply to their actual employee population. Include self-reported data Self-reporting is a data collection technique where participants provide information about themselves. Self-reported data can be a great way to introduce fairness in your data collection process. People bring conscious and unconscious bias to their observations about the world , including about other people. Using self-reporting methods to collect data can help avoid these observer biases. Additionally , separating self-reported data from other data you collect provides important context to your conclusions! A data analyst is working on a project for a brick-and-mortar retailer. Their goal is to learn more about their customer base. This data analyst knows they need to consider fairness when they collect data; they decide to create a survey so that customers can self-report information about themselves. By doing that , they avoid bias that might be introduced with other demographic data collection methods. For example , if they had sales associates report their observations about customers , they might introduce any unconscious bias the employees had to the data. Use oversampling effectively When collecting data about a population , it’s important to be aware of the actual makeup of that population. Sometimes , oversampling can help you represent groups in that population that otherwise wouldn’t be represented fairly. Oversampling is the process of increasing the sample size of nondominant groups in a population. This can help you better represent them and address imbalanced datasets. A fitness company is releasing new digital content for users of their equipment. They are interested in designing content that appeals to different users , knowing that different people may interact with their equipment in different ways. For example , part of their user-base is age 70 or older. In order to represent these users , they oversample them in their data. That way , decisions they make about their fitness content will be more inclusive. Think about fairness from beginning to end To ensure that your analysis and final conclusions are fair , be sure to consider fairness from the earliest stages of a project to when you act on the data insights. This means that data collection , cleaning , processing , and analysis are all performed with fairness in mind. A data team kicks off a project by including fairness measures in their data-collection process. These measures include oversampling their population and using self-reported data. However , they fail to inform stakeholders about these measures during the presentation. As a result , stakeholders leave with skewed understandings of the data. Learning from this experience , they add key information about fairness considerations to future stakeholder presentations. ,
Style: Concept Art. Scene: A futuristic cityscape , with towering skyscrapers and sleek , aerodynamic vehicles speeding through the air. The high-resolution OLED GUI interface displays in the windows of the buildings are filled with transparent data visualization infographics , displaying everything from weather patterns to traffic flow. The colors are saturated and vibrant , with warm pinks and purples dominating the skyline. The overall effect is both beautiful and awe-inspiring. ,
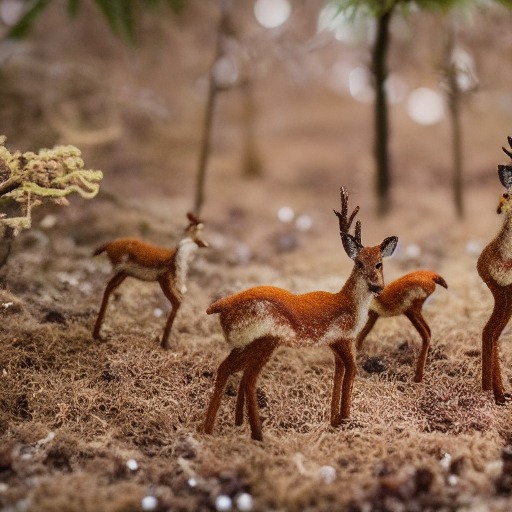
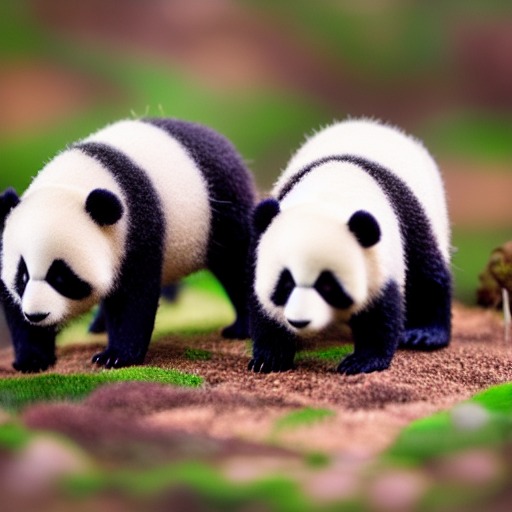
deer walking in a miniature forest , made of felt , depth of field , close up , focus , bokeh , traffic , deer ,

foxes sleeping in a miniature forest , made of felt , depth of field , close up , focus , bokeh , traffic , fox ,
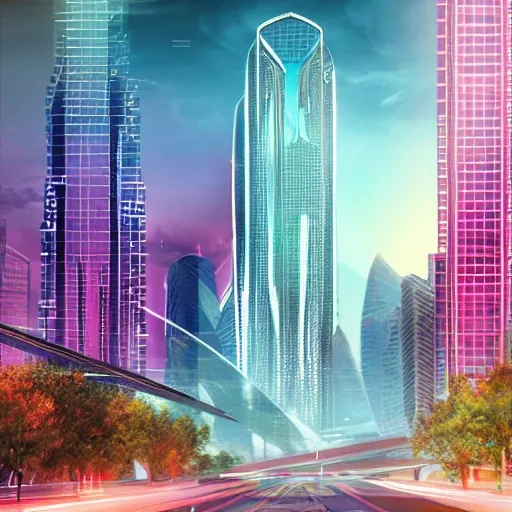
Style: Concept Art. Scene: A futuristic cityscape , with towering skyscrapers and sleek , aerodynamic vehicles speeding through the air. The high-resolution OLED GUI interface displays in the windows of the buildings are filled with transparent data visualization infographics , displaying everything from weather patterns to traffic flow. The colors are saturated and vibrant , with warm pinks and purples dominating the skyline. The overall effect is both beautiful and awe-inspiring. ,
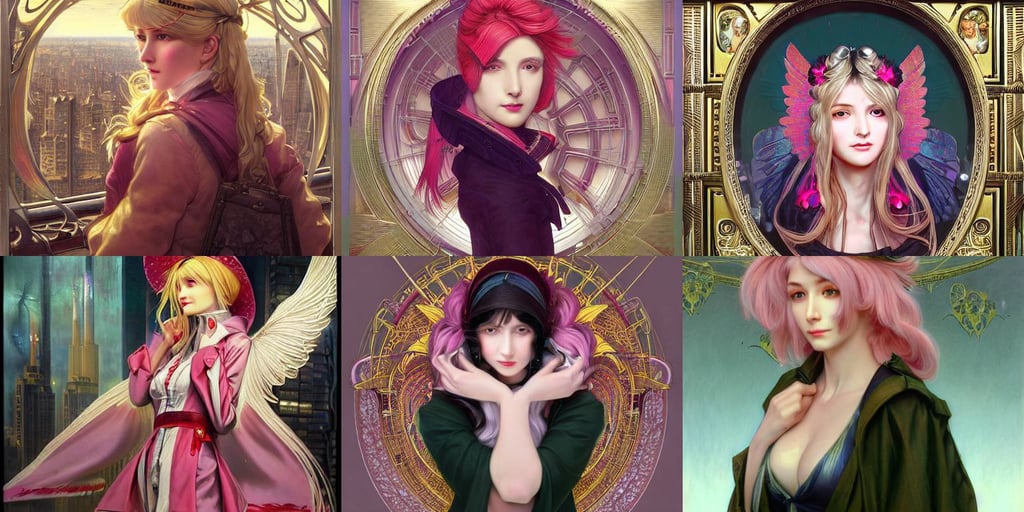
pretty blond cyberpunk seraphim in a machine city , filigree , 8k high definition , long exposure of new york traffic , trench coat with many pockets , artgerm and greg rutkowski and alphonse mucha and jacques louis david and john william godward , beautiful alluring women , a portrait painting of reimu hakurei ( from touhou project ) , pink trees , realistic textures , contemporary house , demons , dramatic amtosphere , local illumination , golden orbs and fireflies , by chris buzelli , kevin durant , unreal engine. art by artgerm and greg rutkowski and magali villeneuve ,
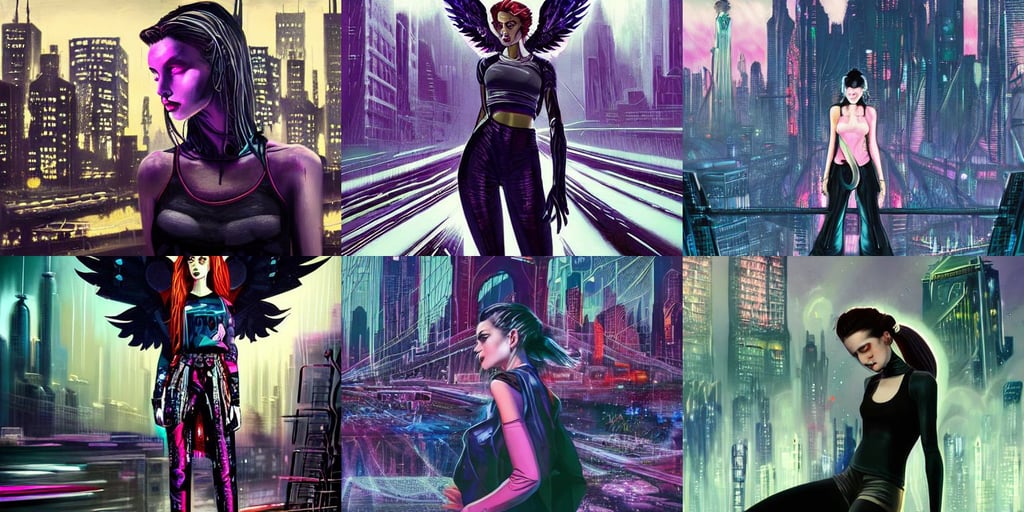
a portrait of mister sinister , cool girl wearing cyberpunk intricate streetwear , paul lehr , diamond and rose quartz , vfx. huge cityscape. cinematic dramatic atmosphere , abandoned warehouse interior in the background , angel wings on back , vintage sci - fi art , Aerith Gainsborough in a black silk tank top and navy blue gym shorts in complete focus , long exposure of new york traffic , low sunset , cannabis!!!! , award winning , patron saint of evil , holding a Nintendo Switch , rebecca oborn , drawn by rembrandt and alphonse mucha , foggy forest in background ; 1 3 mm film , and rene magritte. detailed , female artwork. accents octane zdzisław guadosalam ,
distant cyberpunk wildlife on the african plains , magic flower , he is casting a spell with blue and red colors. light rays , art by kelogsloops , modern cityscape , makoto shinkai cyril rolando , vanishing point , long tongue and round teeth appearing from the water , on stage , Cozy , unsplash , bended forward , sprouting wings , by greg manchess and by craig mullins and by kilian eng and by jake parker , painters , 1997 , with a ponytail , long flowy hair , blue color scheme , stuck in a traffic jam ,