Search Results for data
Explore AI generated designs, images, art and prompts by top community artists and designers.
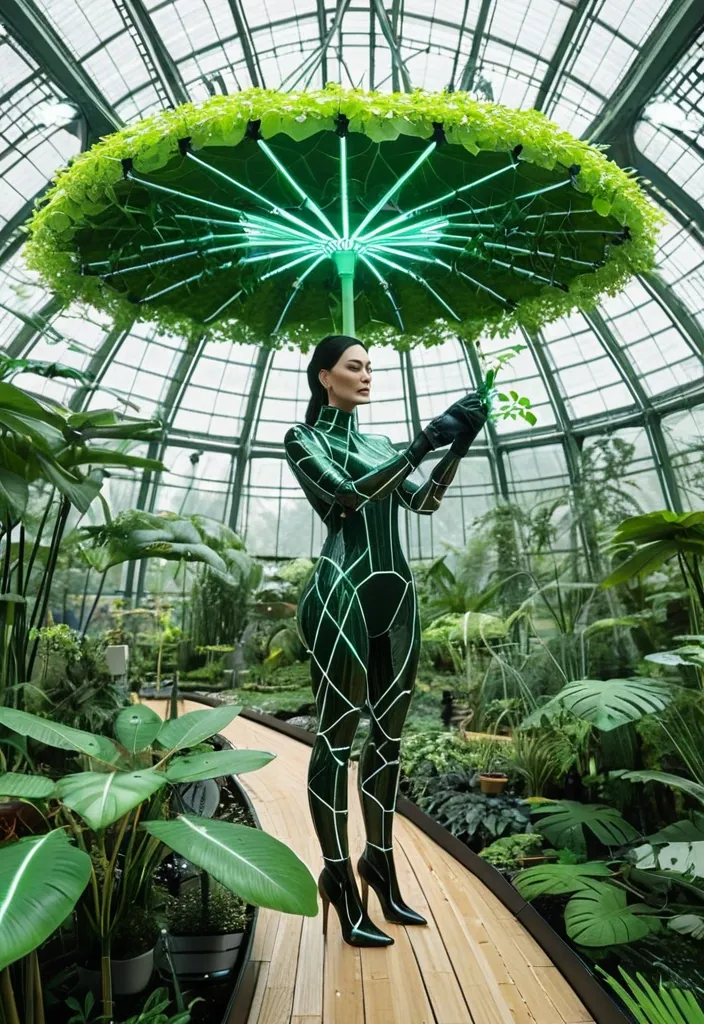

Design a futuristic image of a colossal , vibrant green canopy of leaves and flowers shaped like an umbrella , serving as the roof for a high-tech , sustainable greenhouse. The structure is supported and surrounded by giant , engineered bamboo stalks with integrated cables and solar panels , set in a dense , urban forest. Inside the greenhouse , a girl in a sleek , eco-friendly outfit and smart gardening gloves examines a variety of vibrant , genetically engineered tropical plants. She uses a holographic small notebook projected from her smart glove to record data. The scene combines natural elements with advanced technology , highlighting innovation in eco-friendly living. The style should be futuristic and eco-conceptual , with a focus on sustainability and technological integration. This image targets environmentally conscious individuals and tech enthusiasts. ,
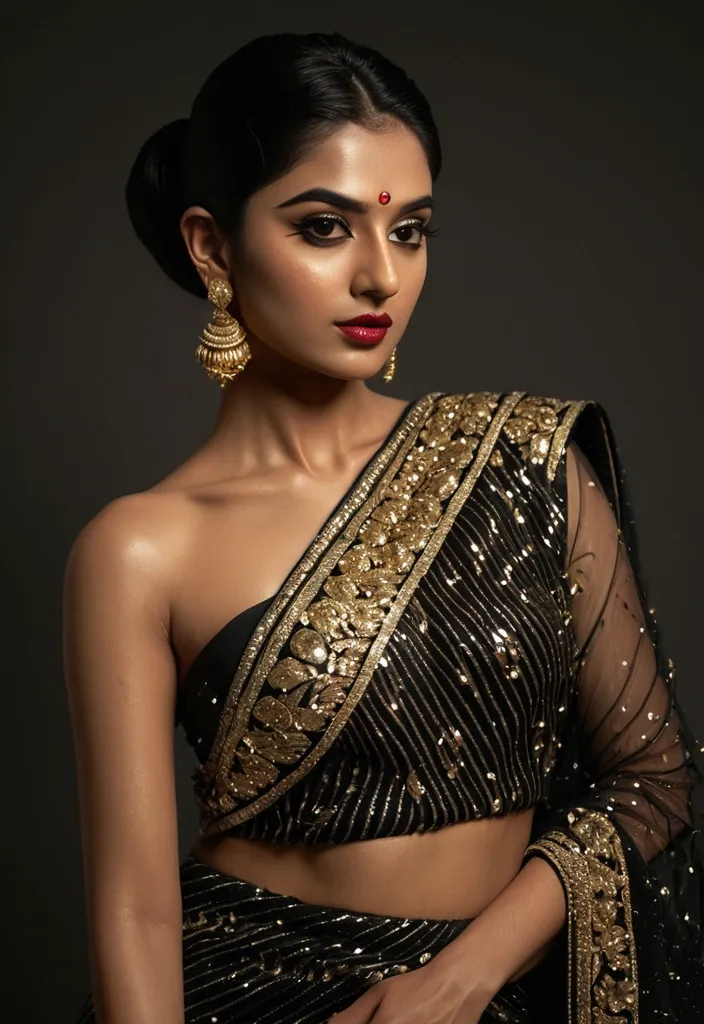
"Beautiful fair Indian model showcasing Sidhidata black net embroidered sequin saree with heavy sequence work , modern draping style revealing one shoulder. She has radiant skin , perfect winged eyeliner , vibrant matte red lipstick , and oversized golden jhumka earrings that sway elegantly. Soft studio lighting making the sequins shimmer , minimal jewelry , sleek bun hairstyle , elegant and graceful pose , cinematic fashion photography , highly detailed , photorealistic" ,
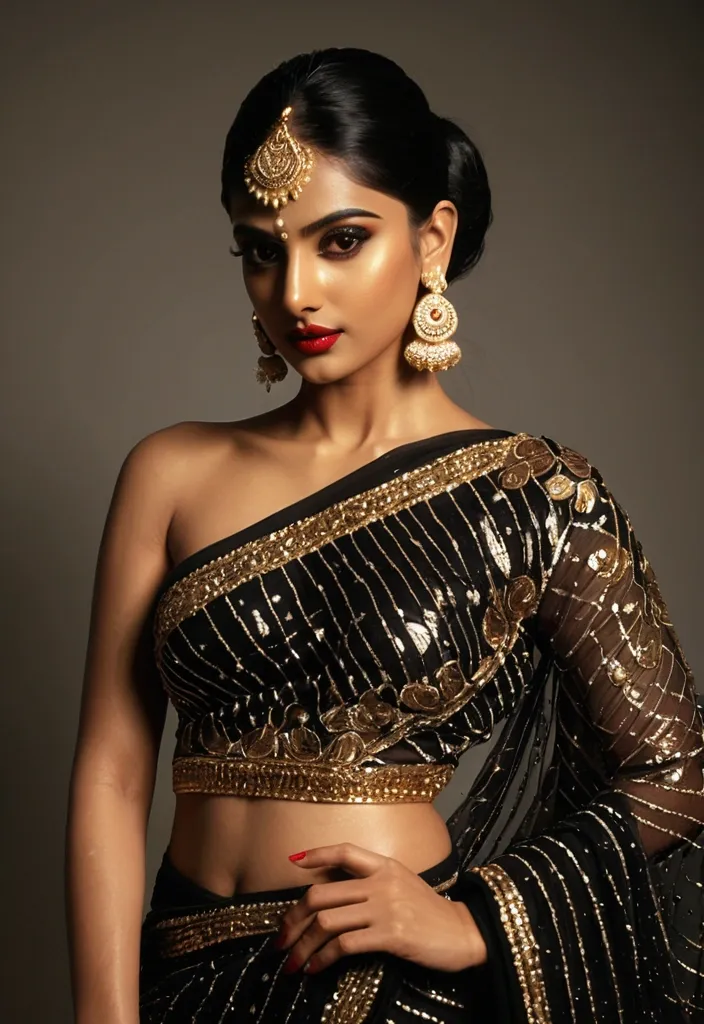
"Beautiful fair Indian model showcasing Sidhidata black net embroidered sequin saree with heavy sequence work , modern draping style revealing one shoulder. She has radiant skin , perfect winged eyeliner , vibrant matte red lipstick , and oversized golden jhumka earrings that sway elegantly. Soft studio lighting making the sequins shimmer , minimal jewelry , sleek bun hairstyle , elegant and graceful pose , cinematic fashion photography , highly detailed , photorealistic" ,
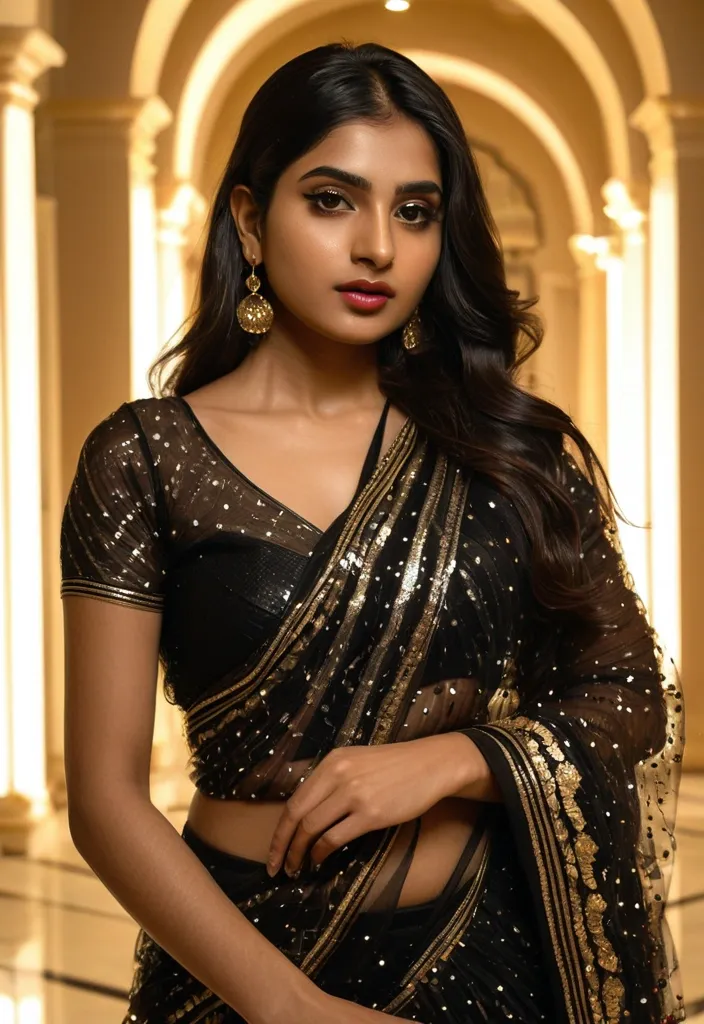
"Stunning modern Indian woman in her mid-20s with flawless glowing skin , wearing a luxurious black net Sidhidata saree with intricate 5mm sequin embroidery and sequence work that sparkles beautifully under soft lighting. She has draped the sheer net saree elegantly in contemporary style with a matching sequin blouse. She wears large traditional gold jhumka earrings , bold red lipstick , kohl-lined eyes , and subtle makeup. Long wavy hair , confident pose in a luxurious indoor setting with golden hour lighting , high fashion editorial style , ultra-realistic , 8k details" ,
"Stunning modern Indian woman in her mid-20s with flawless glowing skin , wearing a luxurious black net Sidhidata saree with intricate 5mm sequin embroidery and sequence work that sparkles beautifully under soft lighting. She has draped the sheer net saree elegantly in contemporary style with a matching sequin blouse. She wears large traditional gold jhumka earrings , bold red lipstick , kohl-lined eyes , and subtle makeup. Long wavy hair , confident pose in a luxurious indoor setting with golden hour lighting , high fashion editorial style , ultra-realistic , 8k details" ,
"Stunning modern Indian woman in her mid-20s with flawless glowing skin , wearing a luxurious black net Sidhidata saree with intricate 5mm sequin embroidery and sequence work that sparkles beautifully under soft lighting. She has draped the sheer net saree elegantly in contemporary style with a matching sequin blouse. She wears large traditional gold jhumka earrings , bold red lipstick , kohl-lined eyes , and subtle makeup. Long wavy hair , confident pose in a luxurious indoor setting with golden hour lighting , high fashion editorial style , ultra-realistic , 8k details" ,
Design a premium A4-size professional book back cover for AIAT Technologies that perfectly matches the front cover design , color palette , typography , branding , spacing , visual hierarchy , and enterprise technology aesthetic. Portrait orientation (A4 vertical) , print-ready publishing quality , ultra-high resolution , modern cybersecurity and IT infrastructure theme. Use a clean deep navy-blue background with subtle geometric grid patterns , abstract network connections , digital circuitry , server infrastructure elements , cloud computing symbols , data streams , and elegant holographic technology accents. No humans , faces , characters , hackers , hooded figures , robots , or mascots. Create a sophisticated corporate technology appearance suitable for a professional educational publication. At the top include a section titled "About This Book". Below it place a professionally formatted book description area explaining that Windows CLI – 100 Important Commands is a practical reference guide covering essential Windows command-line tools for system administration , troubleshooting , networking , security operations , automation , diagnostics , and IT support. Include a clean feature highlights section with modern iconography containing: • 100 Essential Windows Commands • Practical Command Examples • Networking & Troubleshooting Tools • System Administration Techniques • Security & Diagnostic Utilities • Beginner to Advanced Learning Resource. Add a section titled "Who Should Read This Book?" listing: IT Professionals , System Administrators , Help Desk Engineers , Cybersecurity Analysts , Networking Students , Technology Enthusiasts , and Computer Science Learners. Include a professional AIAT Technologies company profile section with the heading "About AIAT Technologies" and a clean placeholder text area for company information. At the bottom reserve space for ISBN barcode placement , publisher information , website , email address , copyright details , and social media icons. Use premium white and cyan typography with strong readability and professional alignment. Maintain generous spacing , balanced composition , and publishing-standard formatting. The overall design must feel like a bestselling enterprise technology handbook from a leading technology training organization. Print-ready , ultra-detailed , corporate publishing quality , elegant modern layout , professional educational technology branding , 8K quality. Negative Prompt: no humans , no faces , no hooded figures , no hackers , no robots , no anime , no cartoons , no gaming appearance , no movie-poster style , no cluttered layout , no excessive neon effects , no blurry text , no distorted typography , no low resolution , no watermark , no stock-photo appearance , no horror elements , no fantasy elements. ,

A cyberpunk-inspired digital art piece where a solider with military wearing and with gun melts into a dynamic tornado , infused with neon lights and digital chaos. The solider , detailed with cybernetic implants , transitions into a tornado that incorporates futuristic wires. The background showcases a geometric tessellations and repeating thumbnails of digital weapons interfaces swirl around the tornado , blending into a matrix code that rains down like digital confetti. A bioluminescent liquid flows through the scene , merging with a dark , mysterious war-field. In the distance , a sleek , high-tech Military Tank navigates through the war-field under a sky filled with data streams and cyberpunk motifs. The image should evoke a sense of high-tech surrealism and digital evolution. ,
A minimalist coffee cup containing latte art that morphs into a tiny , stylized charging battery icon , showing text "99%" , flowing upwards like data stream. The background is a clean , modern cafe counter. The style is abstract and conceptual , focusing on the blend of digital and culinary art , rendered with crisp , clean lines and soft studio lighting. ,
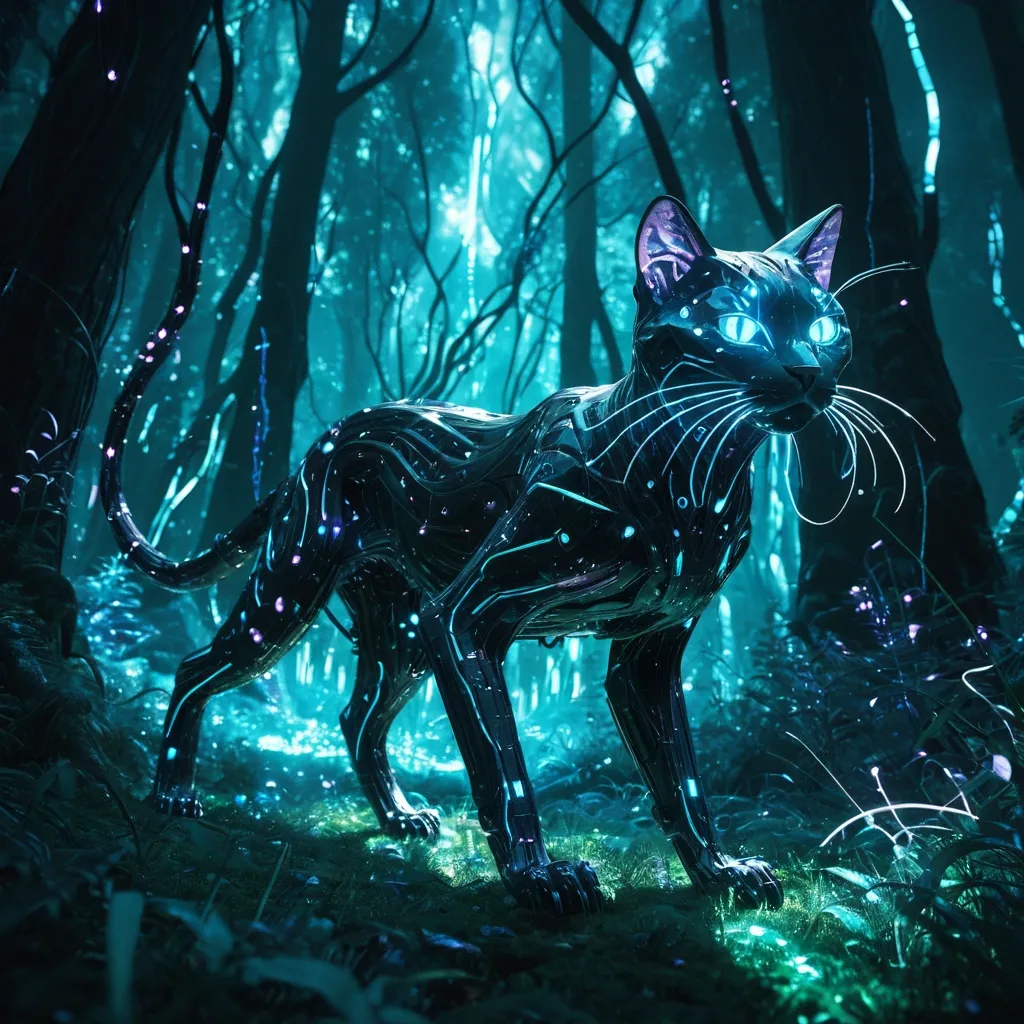
A majestic cybernetic cat with glowing optical sensors , prowling through a dense , alien forest where the trees are made of crystalline data streams. Ethereal bioluminescent flora illuminates the scene. The style is a blend of dark surrealism and intricate digital art , with dramatic cinematic lighting casting long shadows. ,
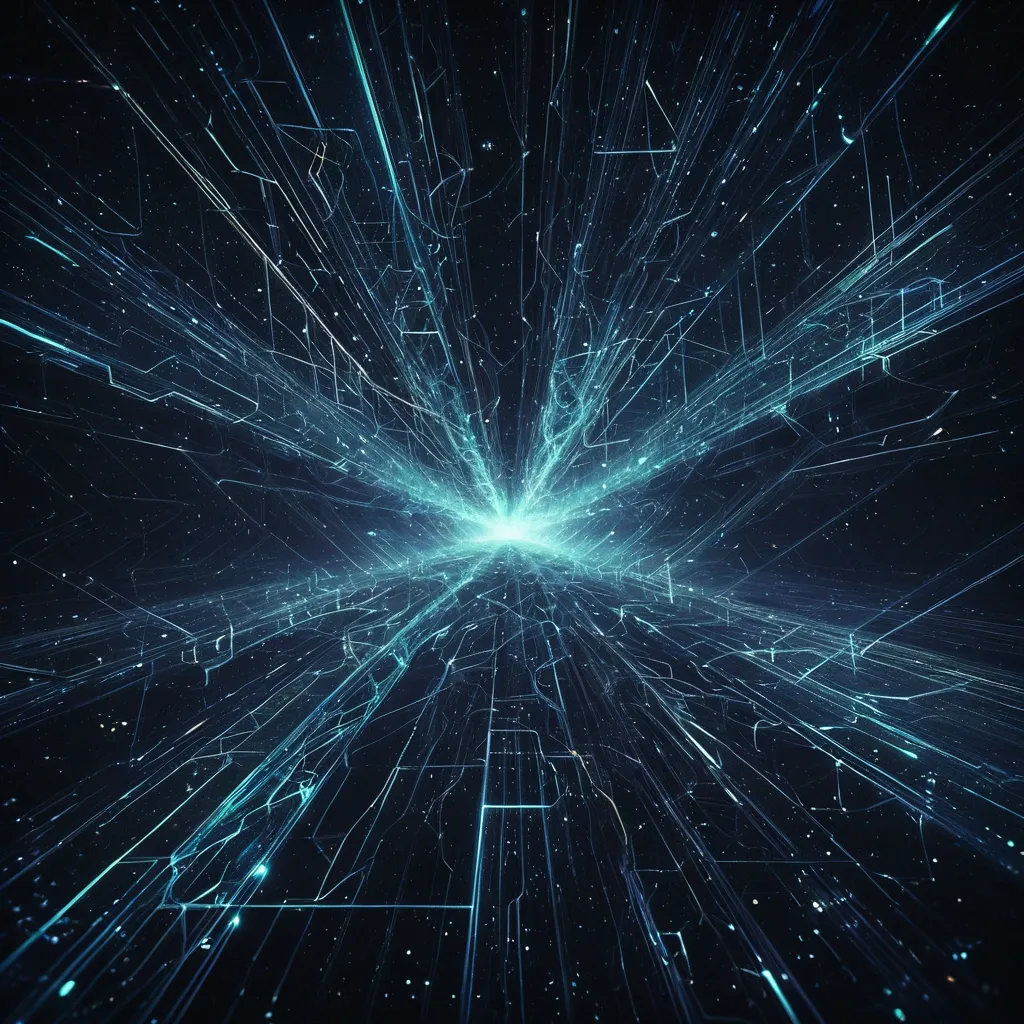
An abstract visualization of cosmic data streams forming complex geometric patterns , reminiscent of interstellar nebulae. Shimmering lines of light and digital noise create a sense of immense scale and depth. Rendered in a surreal digital art style with the dramatic contrast of cinematic lighting. ,
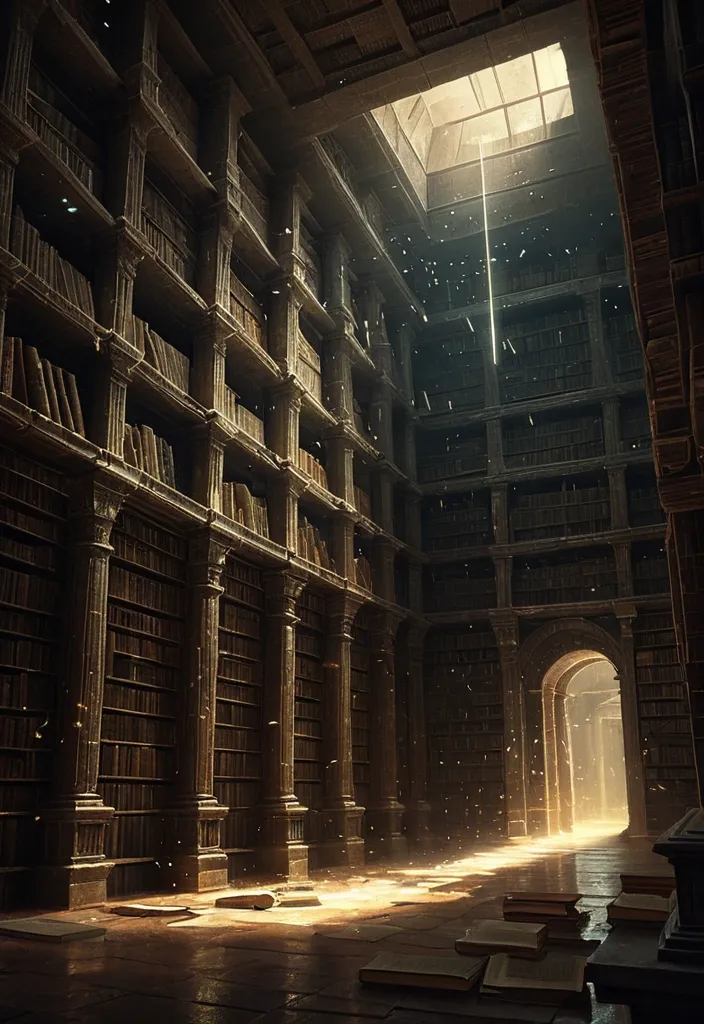
An ancient , forgotten library where books manifest as shimmering data streams , floating amongst towering , archaic shelves. Dust motes dance in shafts of light piercing the gloom. The scene evokes a sense of mystery and lost knowledge , depicted in a surrealist digital painting style with chiaroscuro lighting. ,
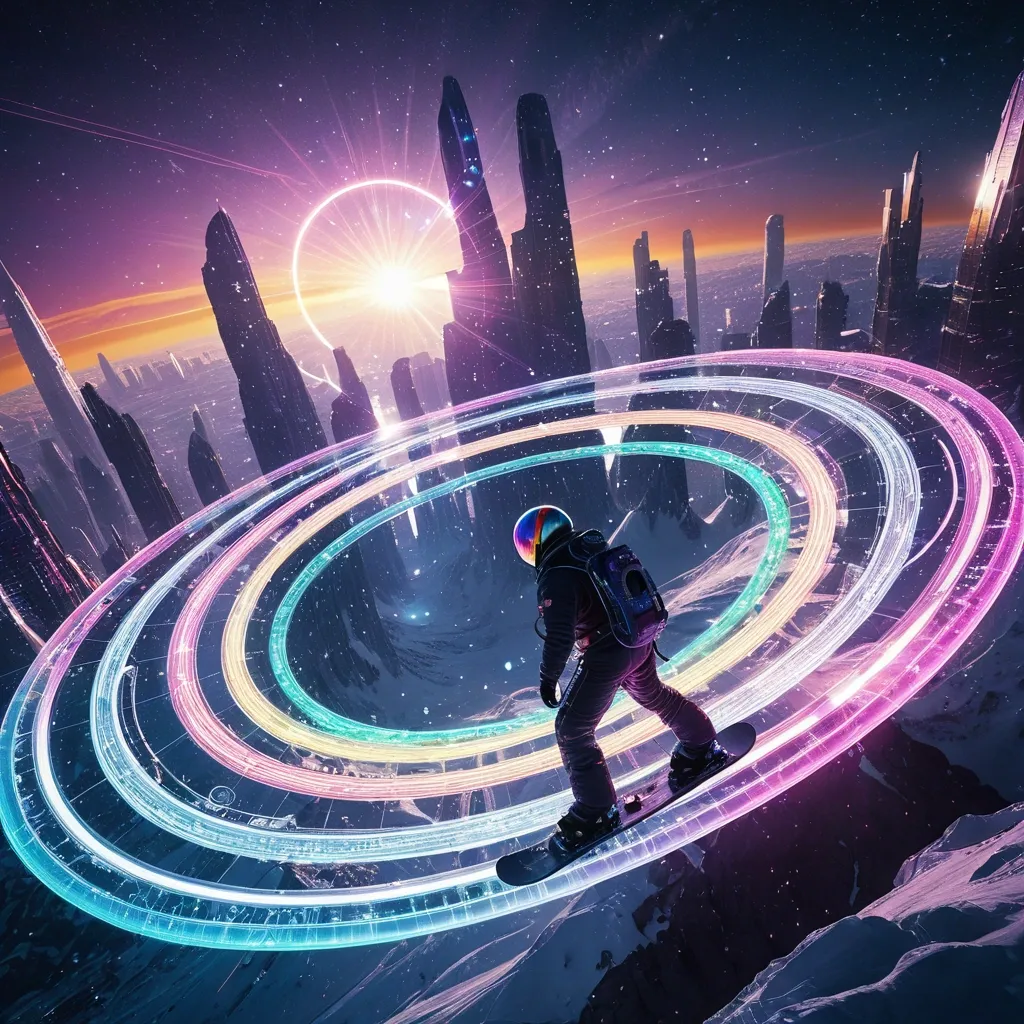
A breathtaking vista of a planetary ring system made not of ice and rock , but of intricate , shimmering data streams and celestial skyscrapers of city in full bloom. A casting ethereal light onto the rings. A astronaut surfer on a futuristic snowboard at the apex of a daring ride through ring. The snowboard emits a brilliant , ionized trail of neon-lit motion waves in vibrant , rainbow hues , creating a striking contrast against the dark. ,
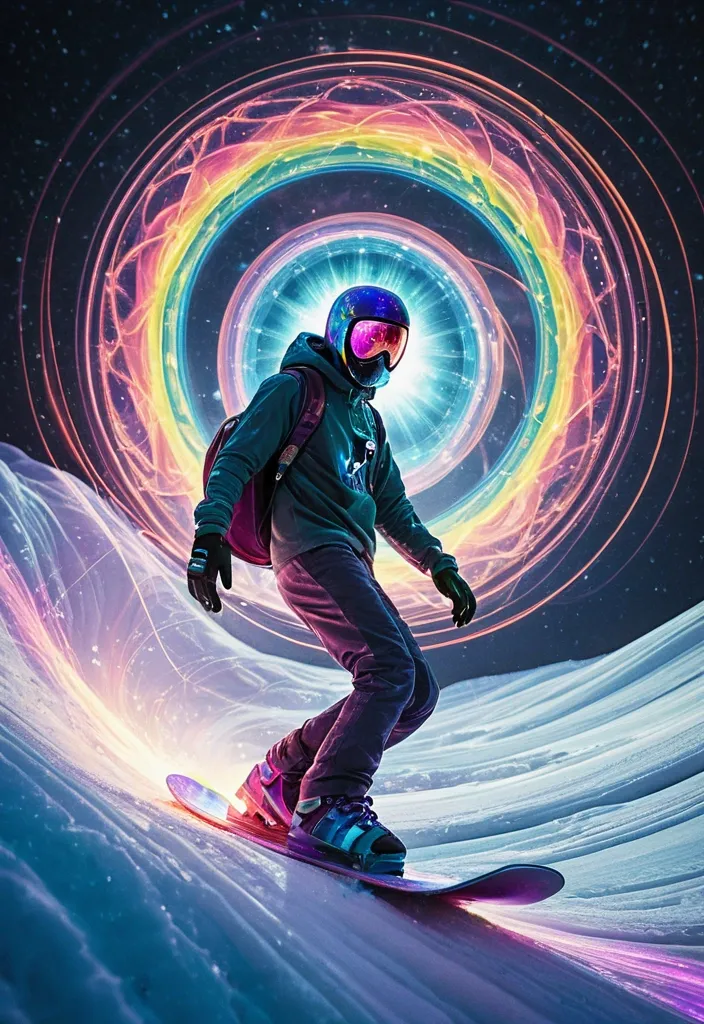
Envision a planetary ring system that defies conventional reality , where iridescent , glowing data streams and fantastical , skyscraper-like structures in full bloom create a mesmerizing , dreamlike landscape. A Spider-Man surfer , wearing a flowing , cosmic cloak , navigates a shimmering , rainbow-colored snowboard through the shimmering rings , which seem to respond to his presence with dynamic , swirling patterns of light. The snowboard's ionized trail manifests as a kaleidoscope of neon hues , swirling and dancing across the dark expanse like a celestial display of fireworks. The scene is infused with a soft , ethereal light that seems to emanate from the rings themselves , casting an otherworldly glow on the surfer and his surroundings. The atmosphere is one of enchantment , curiosity , and limitless possibility. ,
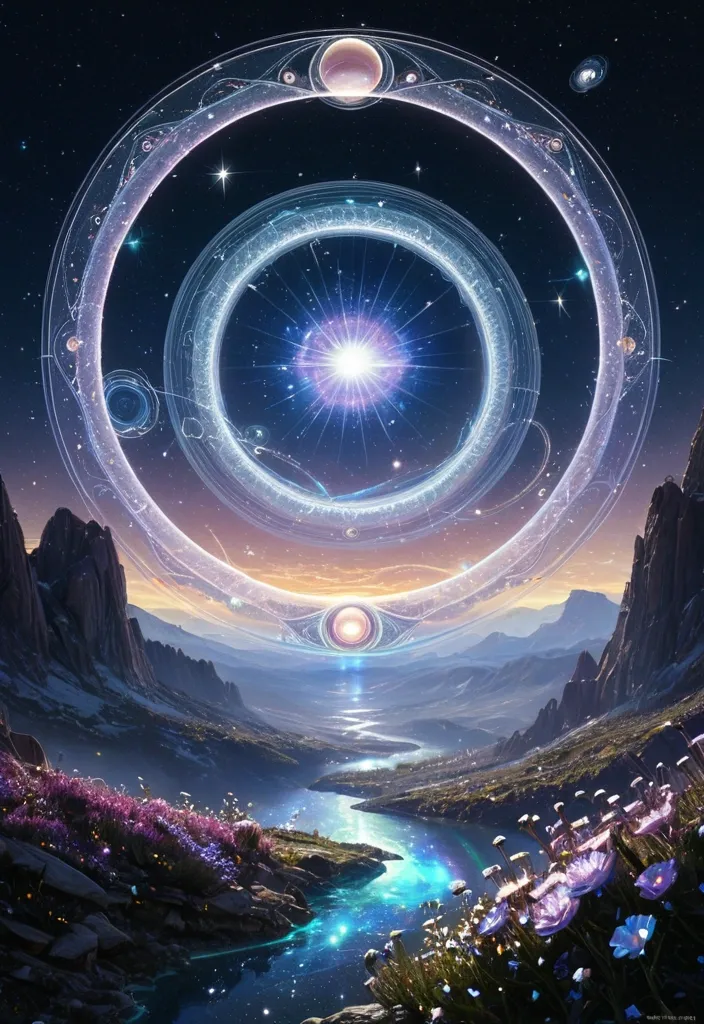
A breathtaking vista of a planetary ring system made not of ice and rock , but of intricate , shimmering data streams and celestial flowers in full bloom. Twin moons hang in the iridescent sky , casting ethereal light onto the rings. The style is that of an awe-inspiring digital painting , capturing the vastness and beauty of interstellar mythology. ,
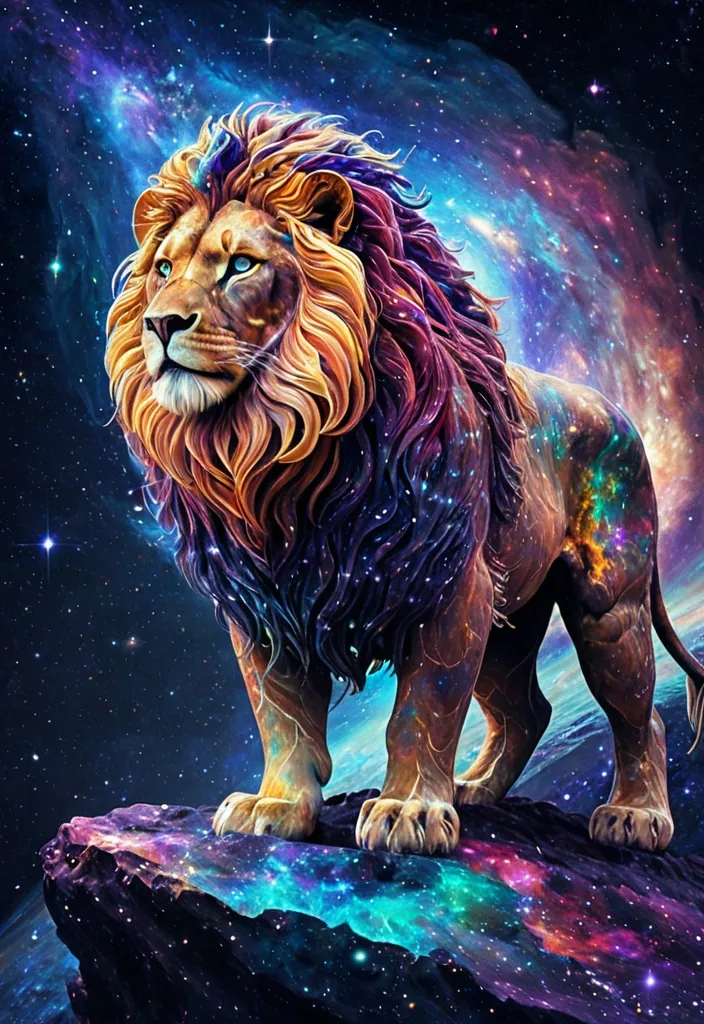
A majestic lion with a mane woven from stardust and nebulae , standing on a crystalline asteroid. Its eyes glow with cosmic energy , reflecting distant galaxies. Data streams flow like rivers around its paws , intertwining with luminous alien flora. Digital art with painterly textures , influenced by the vibrant , swirling colors of psychedelic art , and the celestial grandeur of space art. ,
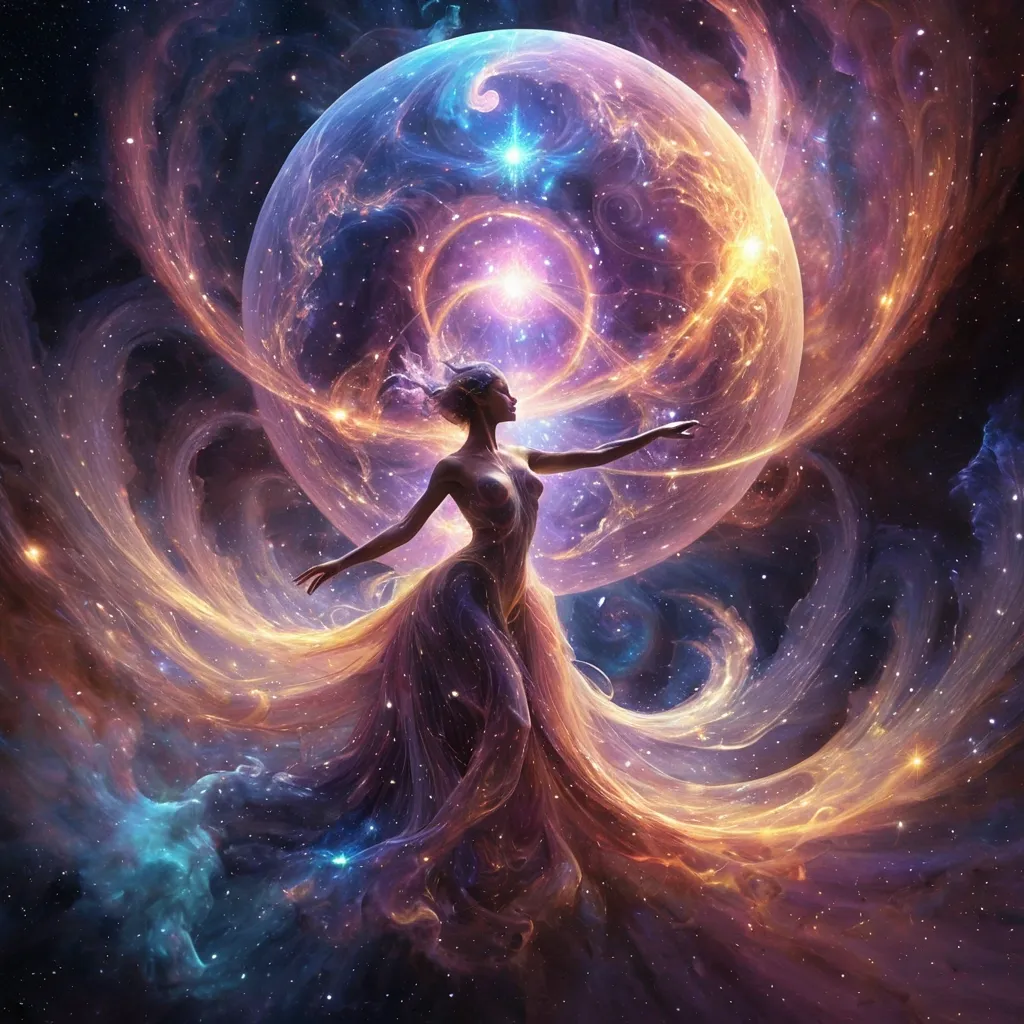
Imagine a grand celestial ball taking place on a sentient nebula , where mythical creatures and abstract cosmic forms dance amidst a symphony of light. Data streams serve as the music , flowing and weaving through the dancers. The overall aesthetic is a dreamy , ethereal digital painting , capturing the sublime beauty and transcendental nature of the cosmos. ,
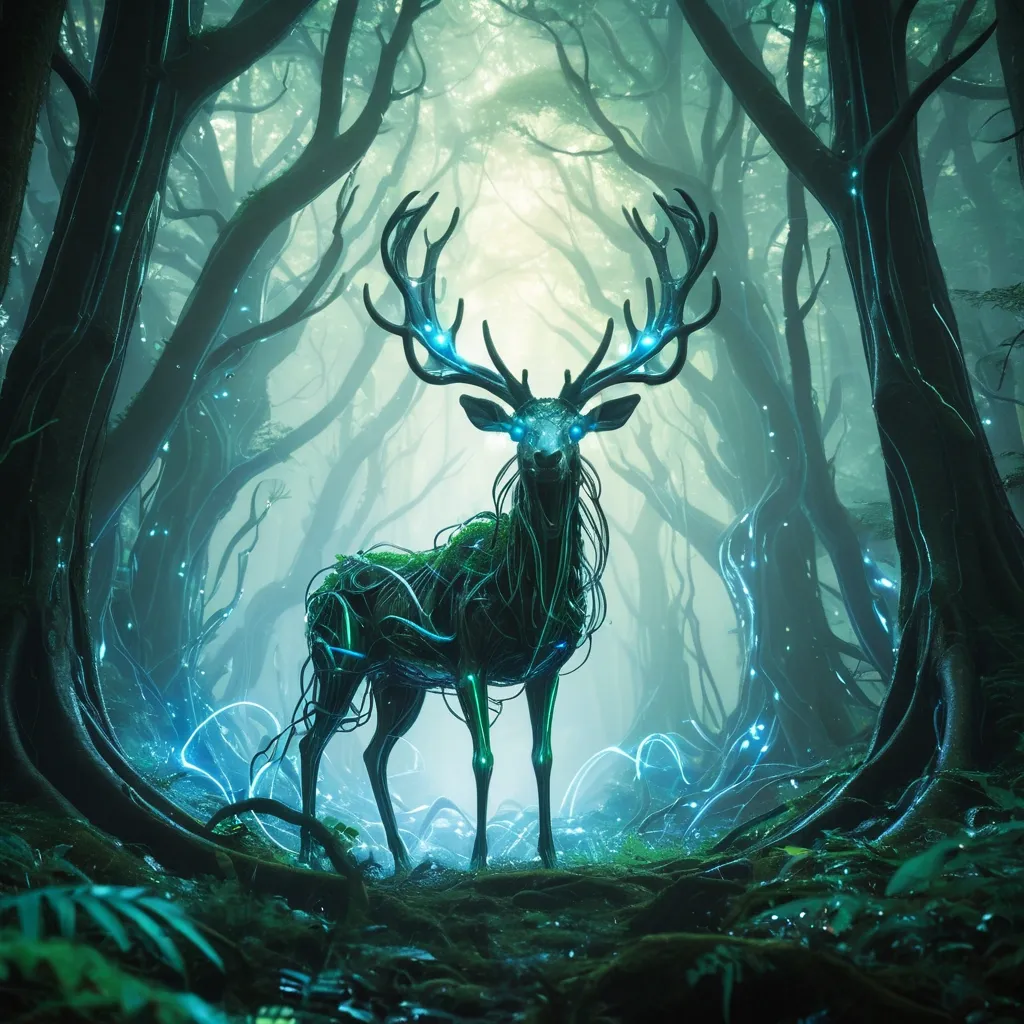
A Xenomorph stag with antlers made of green leaves and interwoven roots optics stands in a serene , misty forest. Its eyes glow with a soft , digital blue. Sunlight filters through the canopy , illuminating glowing data streams that flow like rainbow around its hooves. This scene embodies the harmony of nature and futuristic technology , rendered in a hyperrealistic digital art style with subtle surreal touches , influenced by the works of artists known for blending organic and mechanical forms. ,
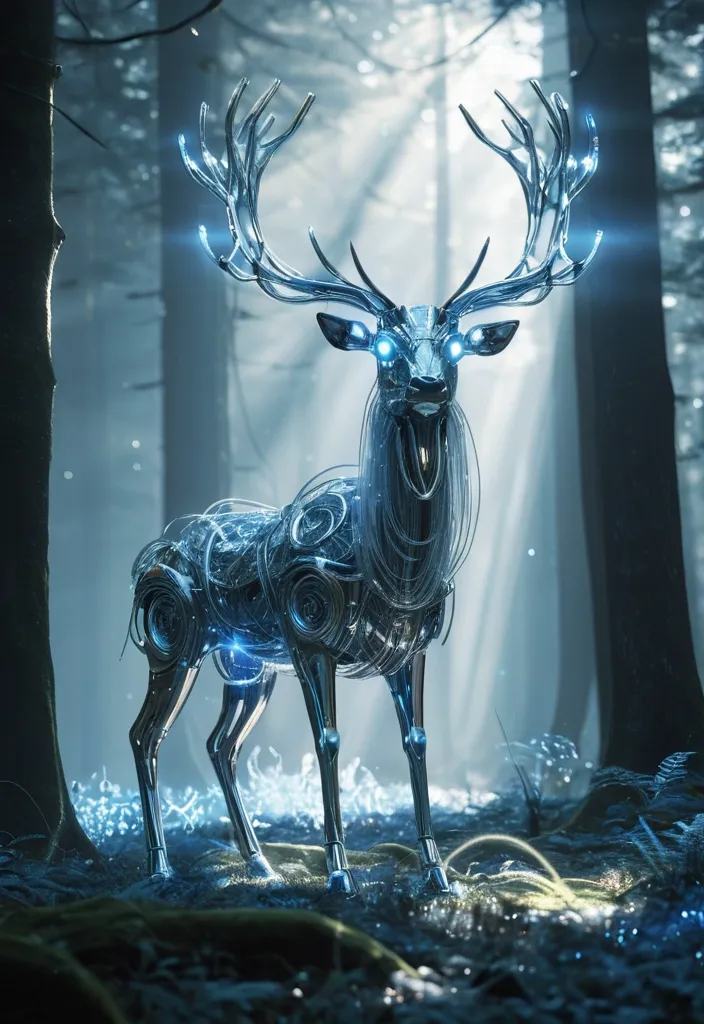
A majestic robotic stag with antlers made of polished chrome and interwoven fiber optics stands in a serene , misty forest. Its eyes glow with a soft , digital blue. Sunlight filters through the canopy , illuminating glowing data streams that flow like mist around its hooves. This scene embodies the harmony of nature and futuristic technology , rendered in a hyperrealistic digital art style with subtle surreal touches , influenced by the works of artists known for blending organic and mechanical forms. ,
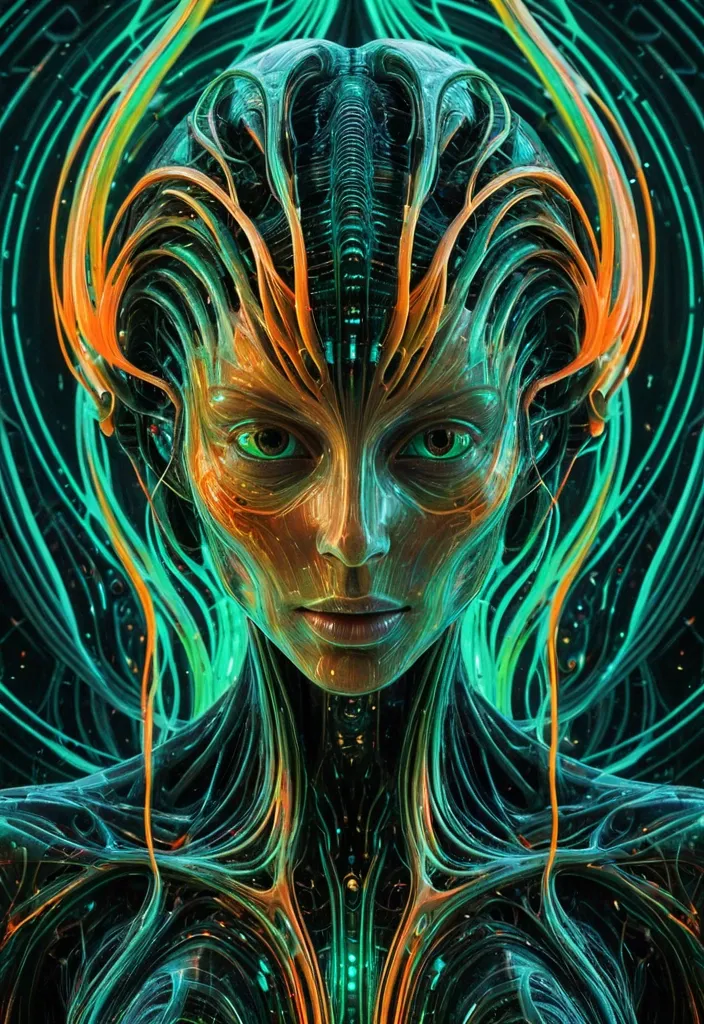
A Xenomorph woman face across a swirling vortex of data streams. Each petal is a complex algorithm , a testament to abstract concepts taking form , with distorted holographic features and dreamlike imagery. The holographic elements should create a sense of mystery and intrigue. Employ a muted color palette with iridescent orange and green accents. The style is pure digital art , with vibrant , glowing colors and sharp , precise lines , creating a mesmerizing , almost spiritual , visual experience. ,

{ "prompt": "Design a high-end corporate banner for a marine technology company called SERTEC Marine , based on the attached reference image. Elevate the existing design into a premium 'Fluid Tech Layers' concept. Maintain the idea of flowing wave shapes but transform them into precise , engineered , layered vector forms with clean edges and controlled geometry. The composition should feature multiple overlapping curved layers moving horizontally from left to right , representing data flow , ocean currents , and advanced systems.\n\nIncorporate subtle technical elements such as thin wireframe lines , navigation paths , or circuit-like details integrated along the curves. Add micro details like connection points and segmented lines to enhance the technological feel without cluttering the design.\n\nUse a sophisticated gradient palette: deep navy blue , indigo , and electric cyan accents. Apply smooth gradient transitions with depth and contrast. Include subtle glassmorphism effects (translucent layers with soft lighting) to create a sense of depth and modernity.\n\nThe background should feel clean , corporate , and high-tech — not decorative. Avoid excessive blur. Prioritize precision , clarity , and structure.\n\nPlace the SERTEC Marine logo on the right side , preserving its integrity , ensuring strong contrast and visibility. The design must feel balanced , with negative space and a refined layout suitable for corporate documents (headers , footers , presentations).\n\nOverall mood: premium , technological , controlled fluidity , marine engineering , data-driven environment." , "referenced_image_ids": ["file_000000008bc471f5ab046ab00fbdb553"] , "size": "1792x512" } ,
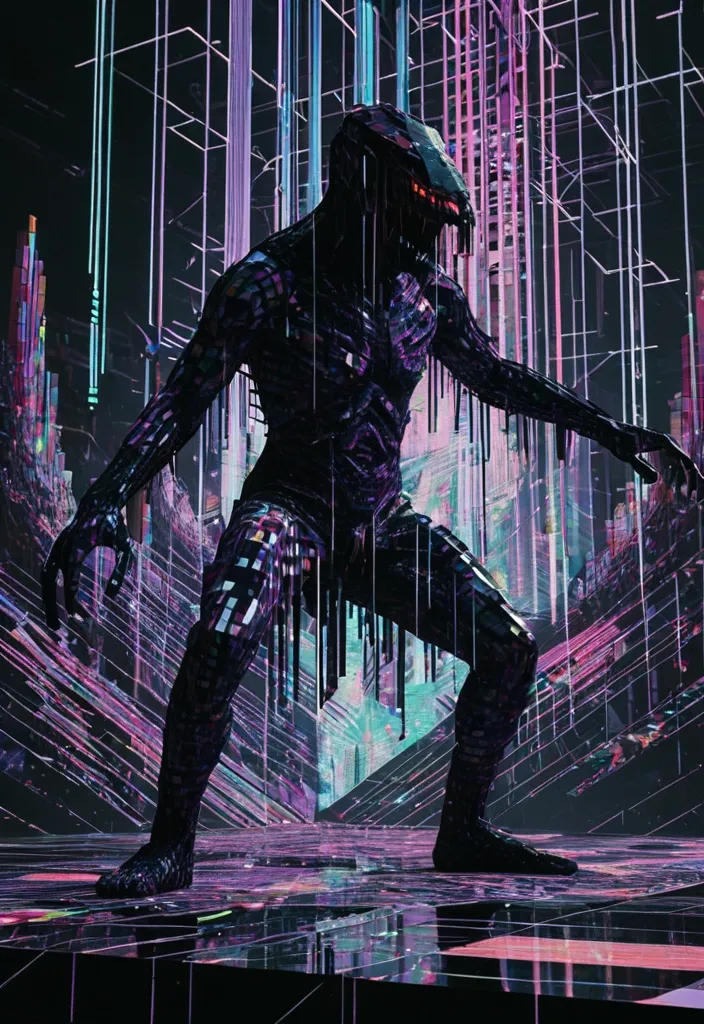
A glitching predator , his movements fragmented and pixelated , performing on a stage constructed from fractured digital landscapes. The backdrop is a cascade of corrupted data streams and vibrant , chaotic geometric patterns , representing a breakdown of digital reality. The art style combines the aesthetics of glitchcore with a dark , almost gothic undertone , with sharp contrasts and distorted visual elements. ,
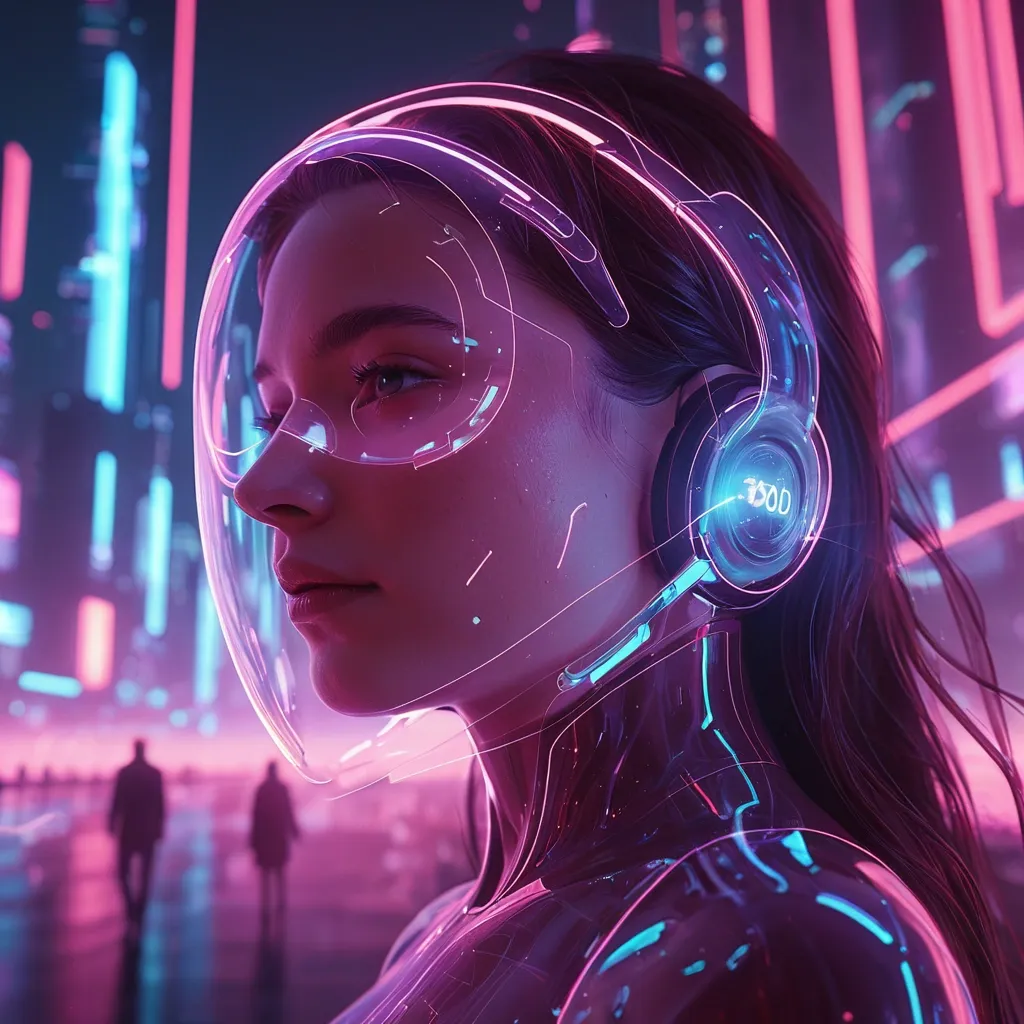
Close-up cinematic portrait of a woman wearing a sleek futuristic transparent headset , techcore aesthetic , soft neon lighting reflecting across her face , highly detailed skin texture , shallow depth of field. Transparent holographic HUD elements floating around her—glowing interfaces with red number 9000 , data streams , and virtual landscapes projected in mid-air. The holograms depict romantic futuristic imagery: soft digital sunsets couple kissing , couples walking hand in hand glowing city skylines , red glowing number 9000 , intertwined light forms , and dreamlike virtual environments. Color palette of violet , cyan , and warm pink tones , blending technology with intimacy. High contrast lighting , subtle lens flare , ultra-realistic , 8k detail , cyberpunk-inspired but elegant and emotional , immersive atmosphere. , head and shoulders portrait , 8k resolution concept art portrait by Greg Rutkowski , Artgerm , WLOP , Alphonse Mucha dynamic lighting hyperdetailed intricately detailed Splash art trending on Artstation triadic colors Unreal Engine 5 volumetric lighting ,

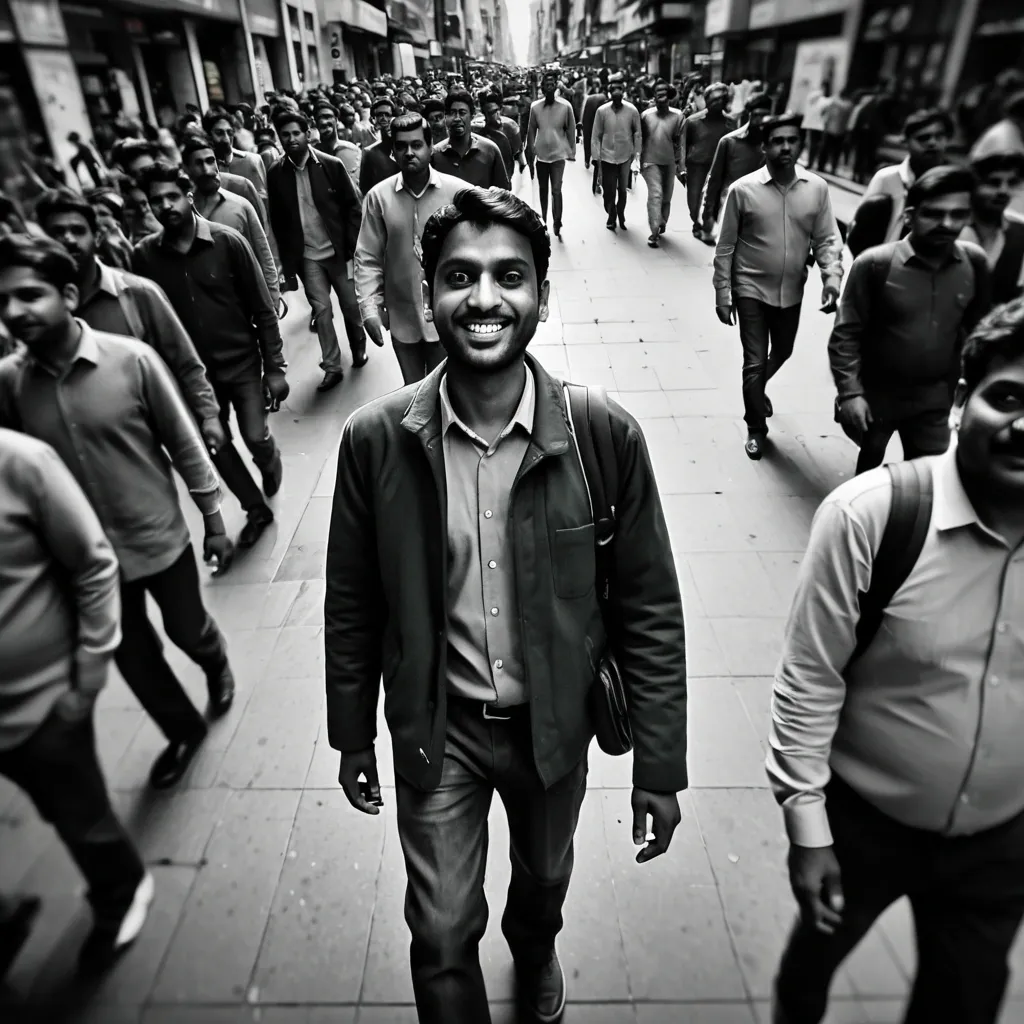
Photorealistic CCTV surveillance footage , high-angle overhead view of a crowded urban street. An Indian man centered , walking forward , looking up at the camera with a warm , confident smile. Surrounding pedestrians heavily motion-blurred , subject in sharp focus. Black & white monochrome , high contrast , cinematic lighting. Advanced AI facial recognition interface overlay: green bounding box labeled “PERSON OF INTEREST” , connected side panel with zoomed face portrait and data SUBJECT ID: 01 , STATUS: TRACKED , GAZE: UP , CONFIDENCE: 86%. Timestamp and REC indicator visible. Grainy texture , digital noise , compression artifacts , subtle scan lines. Slight lens distortion , documentary-style realism , dynamic composition. ,
A soaring Spaceship illustrated through Luminescent Wireframe Geometry , highlighting structural forms with glowing lines and grids in contrasting blue and light blue. A nebula composed of pure data streams and forgotten memories. Within its cockpit , a woman made of fractured light contemplates the infinite void , a symbol of profound existential realization. The style blends dark , cosmic surrealism with the sharp motion , precise aesthetics of digital art , reminiscent of Zdzisław Beksiński and H.R. Giger. ,
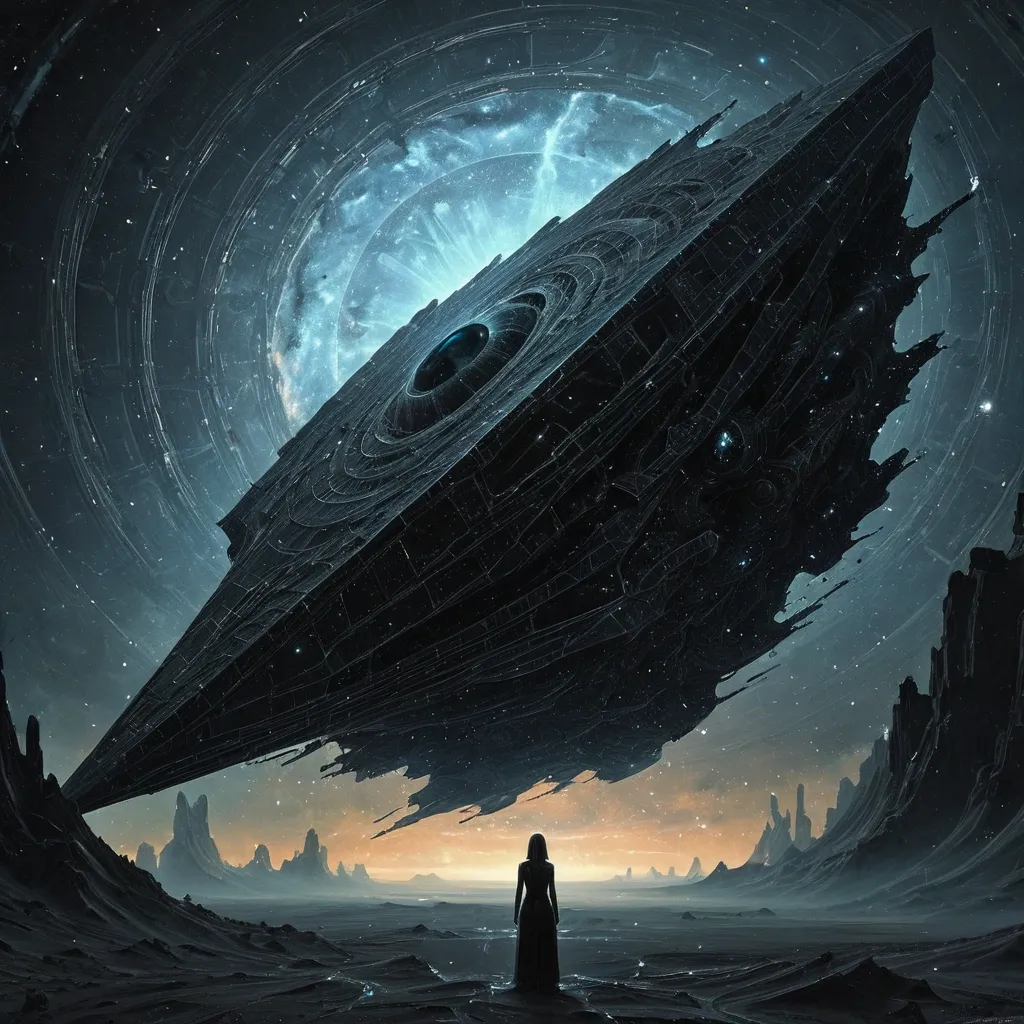
A monumental , obsidian spaceship drifts silently through a nebula composed of pure data streams and forgotten memories. Within its core , a woman made of fractured light contemplates the infinite void , a symbol of profound existential realization. The style blends dark , cosmic surrealism with the sharp , precise aesthetics of digital art , reminiscent of Zdzisław Beksiński and H.R. Giger. ,
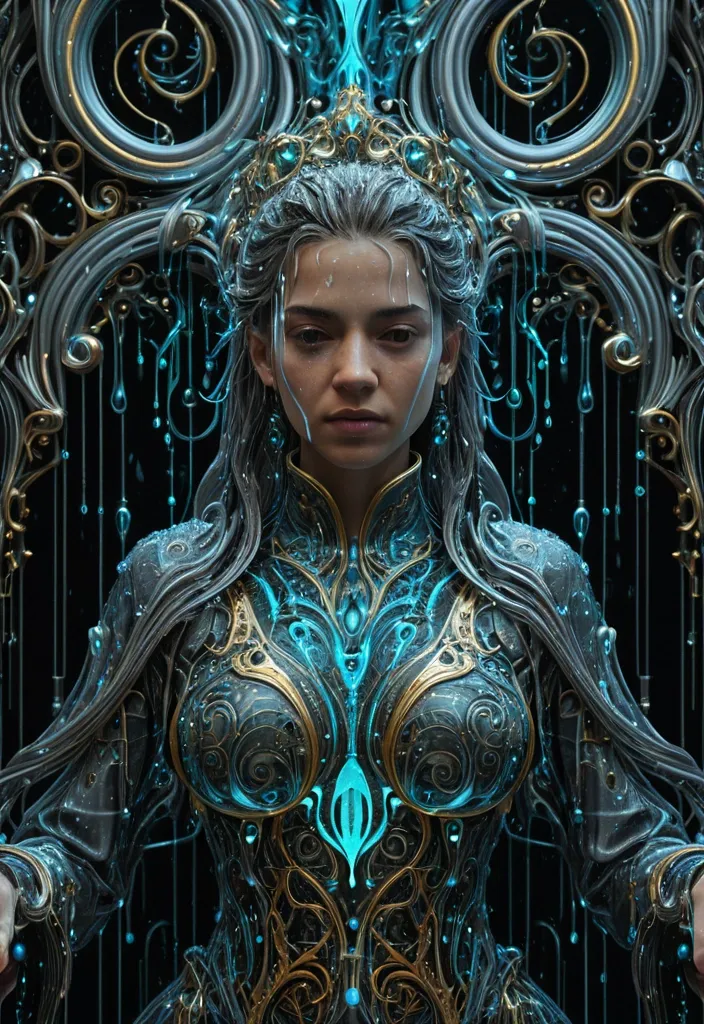
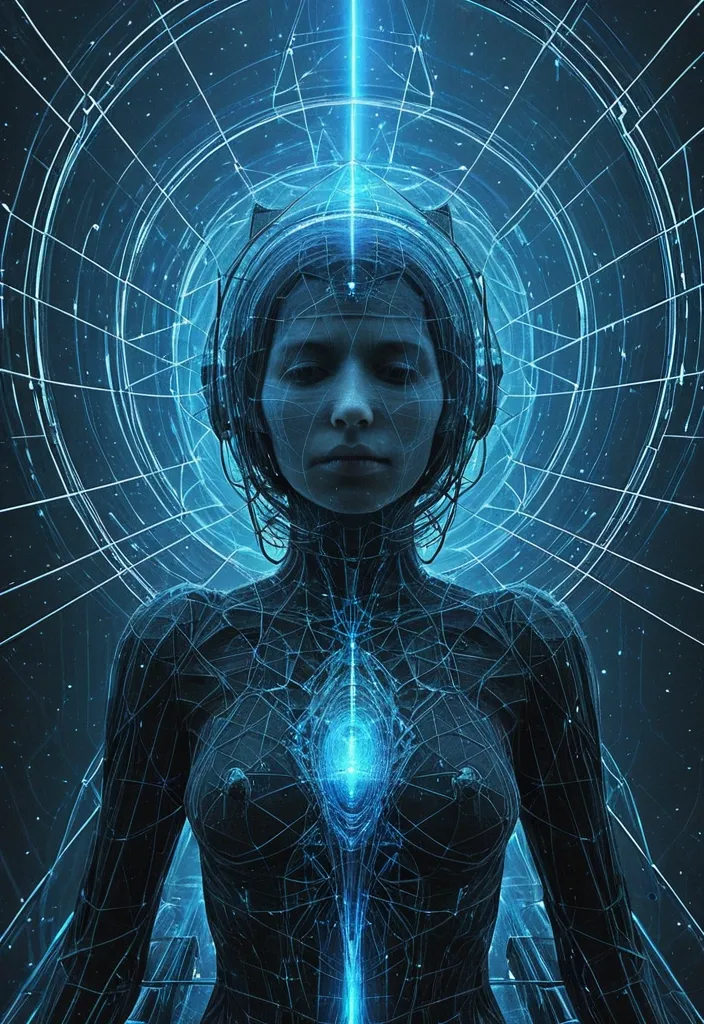
masterpiece) , (best quality) , ultra detailed , highly detailed , 8k resolution , sharp lineart , intricate hair strands , crisp details , perfect anatomy , detailed clothing , cinematic lighting , vibrant colors , rich textures , detailed background , A female sovereign draped in [anti-Soak-cide] raindrops—water that kills wetness , droplets that repel absorption while appearing liquid—each bead a [holo-Liquid-phase] holographic state-shift suspended between solid , fluid , and data. The entire composition viewed through a [hyper-Omni-rain-scope] field: an all-encompassing , hyper-influential atmospheric dominion where rain becomes omniscient observer. Rendered in deep-infographical-baroque style: ornate baroque flourishes interwoven with layered data-visualization geometry , calligraphic flow-charts as decorative filigree , cinematic sci-fi painting technique with volumetric ionized lighting , 8K resolution , palette of mercury-silver , ionized cyan , baroque gold-leaf accents , and deep void-black negative space. ,
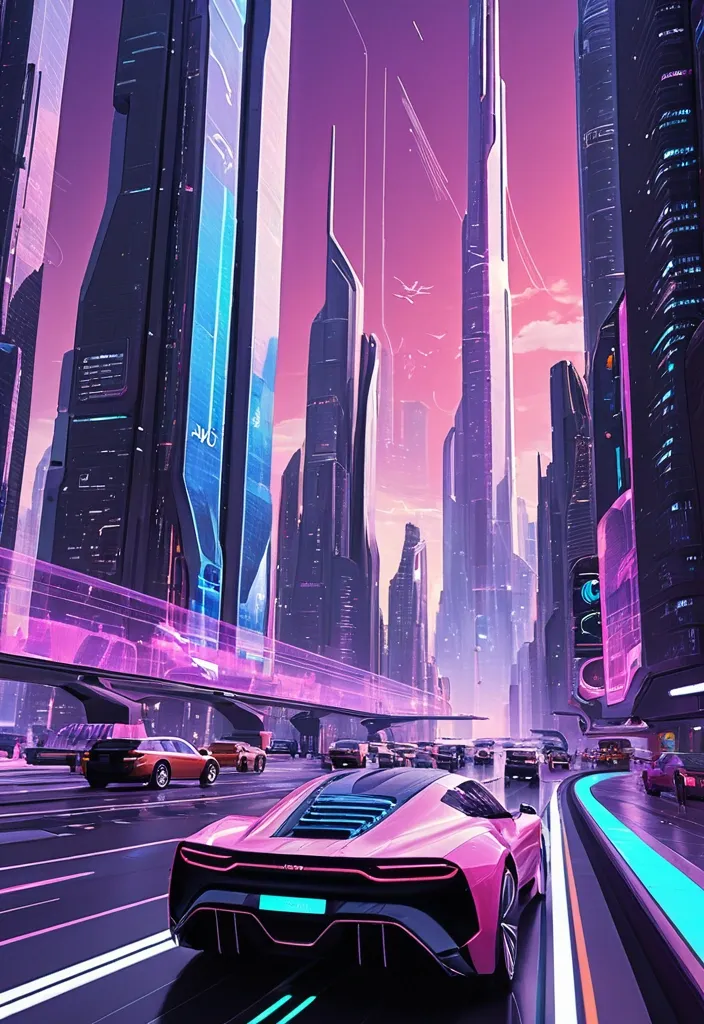
Style: Concept Art. Scene: A futuristic cityscape , with towering skyscrapers and sleek , aerodynamic vehicles speeding through the air. The high-resolution OLED GUI interface displays in the windows of the buildings are filled with transparent data visualization infographics , displaying everything from weather patterns to traffic flow. The colors are saturated and vibrant , with warm pinks and purples dominating the skyline. The overall effect is both beautiful and awe-inspiring. ,