Search Results for help
Explore AI generated designs, images, art and prompts by top community artists and designers.

Ultra-clean modern recipe infographic. Showcase Samosa (Indian street food) in a visually appealing finished form—sliced , plated , or portioned—floating slightly in perspective or angled view. Arrange ingredients , steps , and tips around the dish in a dynamic editorial layout , not restricted to top-down. Ingredients Section: Include icons or mini illustrations for each ingredient with quantities. Arrange them in clusters , lists , or circular flows connected visually to the dish. Steps Section: Show preparation steps with numbered panels , arrows , or lines , forming a logical flow around the main dish. Include small cooking icons (knife , pan , oven , timer) where helpful. Additional Info (optional): Total calories , prep/cook time , servings , spice level—displayed as clean bubbles or badges near the dish. Visual Style: Editorial infographic meets lifestyle food photography. Vibrant , natural food colors , subtle drop shadows , clean vector icons , modern typography , soft gradients or glassmorphism for step panels. Accent colors can highlight key info (calories , prep time). Composition Guidelines: Finished meal as hero visual (perspective or angled). Ingredients and steps flow dynamically around the dish. Clear visual hierarchy: dish > steps > ingredients > optional stats. Enough negative space to keep design airy and readable. Lighting & Background: Soft , natural studio lighting. Minimal textured or gradient background for premium editorial feel. ,

A blue-skinned Mayan god , the great father of all gods , stands in front with his hand outstretched , ready to help if ever there is a need for it. the background behind him has ancient symbols floating around in space , forming an intricate pattern that is part of their enigmatic world. the style is hyper-realistic , cinematic , and fantastica ,

A man in the reference photo , with a full body standing by their broken down pickup truck during the great depression on a deserted dirt highway waiting for help. He confidently smokes a Desi Indian style Beedi , his dressed in dirty attire from the 1920s. Part of the man is deconstructed into small Deconstructed circuit pattern , as if pixelated , showing its textures and ingredients in a grid-like pattern. The circuit extend slightly outwards from the man , blending realism with abstract Electronic. the truck is dirty and rusted , this image is to depict hardship , poverty and a sense of hopelessness. Show some old furniture and luggage in the back of their truck which depicts all their worldly possessions , this is a colorized photograph from the 1920s. ,

An image for the content that may follow. Be creative and use only relevant terms. Customize it in the best way that below is just it's caption ### **Caption:** 🔥 **Need Help with Rare or Tough Proctored Exams?** 💻📚 Struggling with **QQ , TOEFL , SEB , GED OnVUE , PSI , HonorLock , Proctorio , LockDown Browser , ProctorTrack , ETS , GRE , CLEP , Examplify , ProctorU , CompTia , or Prometric?** You’re in the right place! 🎯 I offer **expert exam assistance** with **practice simulations** and **advanced support** for all major proctoring platforms. 💰✅ 📩 **DM me for details**—let’s make your exam experience stress-free! 🚀 -- ,

A message to include in the post for the below caption of the image you're going to generate: If your customer buys once , you made a sale. If they come back , you built trust. If they tell others , you built a brand. --- ### **Caption:** 🔥 **Need Help with Rare or Tough Proctored Exams?** 💻📚 Struggling with **QQ , TOEFL , SEB , GED OnVUE , PSI , HonorLock , Proctorio , LockDown Browser , ProctorTrack , ETS , GRE , CLEP , Examplify , ProctorU , CompTia , or Prometric?** You’re in the right place! 🎯 I offer **expert exam assistance** with **practice simulations** and **advanced support** for all major proctoring platforms. **Pay only after your exam!** 💰✅ 📩 **DM me for details**—let’s make your exam experience stress-free! 🚀 --- ### **Hashtags:** #ExamHelp #ProctoredExams #OnlineExamSupport #TOEFLHelp #SEBExam #GEDOnVUE #PSIExam #HonorLock #Proctorio #LockDownBrowser #ProctorTrack #ETSExams #GREHelp #CLEPExam #Examplify #ProctorU #CompTia #Prometric #ExamAssistance #PayAfterExam #ExamSuccess #StressFreeExams #ExamSupport #OnlineExamHelp #ExamSimulations #ExamPrep #TestHelp #ExamExpert ,

A slender , graceful vampire , appearing in her late 20s to early 30s with dark skin , long dark dreadlocks , and striking eyes with a subtle reddish hue , is under attack by another vampire in a destroyed room. This illustration is rendered in a graphic novel style , with bold lines and dramatic shadows , reminiscent of Artstation illustrations. The room is in ruins , with shattered windows and debris scattered everywhere. She is pinned to the ground , helpless , while the attacking vampire , with a menacing expression and sharp fangs , looms over her. The overall color palette is dark and violent , with deep reds , blacks , and grays dominating , emphasizing the danger and brutality of the attack. ,

A slender , graceful vampire , appearing in her late 20s to early 30s with dark skin , long dark dreadlocks , and striking eyes with a subtle reddish hue , is under attack by another vampire in a destroyed room. This illustration is rendered in a graphic novel style , with bold lines and dramatic shadows , reminiscent of Artstation illustrations. The room is in ruins , with shattered windows and debris scattered everywhere. She is pinned to the ground , helpless , while the attacking vampire , with a menacing expression and sharp fangs , looms over her. The overall color palette is dark and violent , with deep reds , blacks , and grays dominating , emphasizing the danger and brutality of the attack. ,

A slender , graceful vampire , appearing in her late 20s to early 30s with dark skin , long dark dreadlocks , and striking eyes with a subtle reddish hue , is under attack by another vampire in a destroyed room. This illustration is rendered in a graphic novel style , with bold lines and dramatic shadows , reminiscent of Artstation illustrations. The room is in ruins , with shattered windows and debris scattered everywhere. She is pinned to the ground , helpless , while the attacking vampire , with a menacing expression and sharp fangs , looms over her. The overall color palette is dark and violent , with deep reds , blacks , and grays dominating , emphasizing the danger and brutality of the attack. ,

Resident Evil 6 , Sherry Birkin as an action figure on a diorama.DescriptionCharacter Name: Sherry BirkinAge/Appearance: An adult woman , 26 (appearing in her late teens/early 20s due to the G-virus remnants) , 5' 5" (165 cm) tall.Physical Features: Short , blonde , bob-cut hair (shorter than her RE2 appearance) , and blue eyes.Hospital Gown and Attire DetailsGarment: A white patient/hospital gown. It is a simple , standard-issue test subject uniform.Style: It appears to be a back-tie or wrap-around style gown , somewhat loose-fitting , designed for a lab/medical setting rather than a fashionable piece of clothing. It is noted for being one of her less conservative outfits in the game , in contrast to her main campaign clothes.Color/Material: Plain white , likely a light , inexpensive fabric like cotton or a synthetic blend typical of institutional wear.Additional elements: She has no shoes or socks in this specific lab setting. There are no additional accessories , weapons , or gear. She may have some dirt/wounds or appear sweaty/wet depending on the specific moment being The scene is a sterile , dimly lit laboratory or containment area within a Neo-Umbrella facility in Lanshiang , China. This context can help the AI set the "A 3D render of Sherry Birkin from the video game Resident Evil 6 , an adult woman with short blonde bob-cut hair and blue eyes , wearing a plain white , back-tie hospital gown that is slightly loose-fitting. She is standing in a sterile , dimly lit laboratory. The image should capture her determined expression while looking vulnerable. Full body shot , realistic , high detail , video game character art , Capcom style , horror game atmosphere." ,

We have learnt in the earlier grades of Science that the Sun gives us light and heat. It is the primary source of energy for almost everything on Earth. Energy from the Sun provides energy for plants to grow , which , in turn , feeds animals and humans. It also drives water cycles which help in the redistribution of water on the Earth. The Earth works as a connected system where land , water , air , and living things interact closely. Processes such as heating by the Sun , the movement of air , water , and the cycling of essential elements are all linked together. A change in one part of the system often affects the others. These natural processes depend on a balance , and if this balance is disturbed—through overuse of resources , pollution , or climate change—the whole system can be affected in harmful ways. ,

Create several cover design options for a book titled “Как быть , когда быть уже тяжело” by Котельникова Лаура. Here’s a bit about the book: it is made for teenagers and young people who feel anxious in an ever-changing world. It includes CBT self-help practices — this is the main goal of the book (to give people the opportunity for competent self-help). The book design should be gentle , in soft pink or soft blue tones. Choose a beautiful , unusual , but easily readable font. Do not place images of people on the cover — make it minimalistic , yet heartfelt and pleasant. ,

Physical Characteristics: Size & Weight: Between 40 to 60 feet in length , weighing 50 to 75 tons. Coloration: Males: Sleek black base with dark gray tiger stripes accented by subtle red bioluminescent highlights along the stripes , glowing faintly in deep ocean darkness. Females: Larger and more robust with black base and light gray tiger stripes , also featuring red bioluminescent patterns that pulse rhythmically. Body Structure: Hydrodynamic , muscular body combining the streamlined agility of the Shortfin Mako and Black Marlin with the robust power of Predator X and Megalodon. Rigid pectoral fins adapted from Black Marlin , capable of tilting back to reduce drag at high speeds. The tailend is a powerful fluke for propulsion , inspired by Mosasaurus Hoffmannii and Orca anatomy. Thick , overlapping bony scales similar to Arapaima , providing a durable armor that flexes with movement. Limbs: Powerful large flippers adapted for scooting or sliding on land , coated with mucus inspired by the Atlantic hagfish for moisture retention and defense. Capable of limited terrestrial movement , allowing brief excursions out of water. Head & Jaw: Massive jaws with over 40 , 000 PSI bite force , blending Predator X’s mighty jaw strength with the long canine teeth and powerful bite of the Leopard Seal. Flexible skull allowing swallowing of large prey whole. Respiration: Dual respiratory system with both functional lungs and gills , enabling survival from surface to abyssal depths (500 to 9 , 800 feet). Bioluminescence: Red bioluminescent photophores patterned in tiger stripes , used for communication , intimidation , mating displays , and luring prey in the dark ocean depths. Abilities & Traits: Speed & Agility: Capable of bursts up to 82 mph , rivaling the fastest sea creatures like the Black Marlin. Agile hunter using stealth and passive listening , mimicking Transient Killer Whale hunting strategies. Social Structure: Small family groups of three (one male , two females) designed for efficient reproduction and hunting. Males are more streamlined and shorter , optimized for speed and power; females are larger , robust , and agile for endurance and nurturing. Regeneration: Remarkable limb regeneration inspired by axolotl and Crown-of-Thorns starfish , able to regrow lost fins , limbs , and even parts of internal organs. Defense: Venomous spines derived from Crown-of-Thorns starfish line its dorsal ridge , delivering painful venomous wounds to attackers. Mucus coating for defense and moisture retention , also making it slippery and difficult to grasp. Healing: A blubber-like layer similar to dolphins provides insulation , buoyancy , and antimicrobial properties that accelerate healing of wounds. Communication: Uses low-frequency growls , barks , and hisses inspired by saltwater crocodile sounds , combined with bioluminescent signals and stealth vocalizations for hunting. Reproduction: Live births occur at extreme depths (up to 9 , 800 feet) , with offspring adapted to survive in crushing pressures and cold temperatures. Backstory: Created by the Ceno Evail Crossgen Corporation , the Megalosaurus Orca was engineered to dominate marine ecosystems and serve as a living testament to the pinnacle of hybrid dinosaur biotechnology. Designed to combine the raw power of ancient sea predators like Predator X and Megalodon with the intelligence , social hunting , and adaptability of modern marine mammals and fish , this hybrid thrives in the dark , cold depths of the ocean where few predators dare to venture. Their unique physiology allows them to traverse both deep ocean trenches and brief terrestrial environments , making them versatile apex predators. The three known individuals—one male and two females—form a tight-knit family unit , hunting elusive marine mammals and large fish with stealth and precision. Their bioluminescent stripes not only intimidate rivals but also help coordinate complex hunting maneuvers in pitch-black waters. With a lifespan of 100 to 135 years , they are long-lived titans of the sea , their legacy intertwined with the future of marine genetic engineering and the mysteries of oceanic evolution. , ,

Physical Characteristics: Size & Weight: Between 40 to 60 feet in length , weighing 50 to 75 tons. Coloration: Males: Sleek black base with dark gray tiger stripes accented by subtle red bioluminescent highlights along the stripes , glowing faintly in deep ocean darkness. Females: Larger and more robust with black base and light gray tiger stripes , also featuring red bioluminescent patterns that pulse rhythmically. Body Structure: Hydrodynamic , muscular body combining the streamlined agility of the Shortfin Mako and Black Marlin with the robust power of Predator X and Megalodon. Rigid pectoral fins adapted from Black Marlin , capable of tilting back to reduce drag at high speeds. The tailend is a powerful fluke for propulsion , inspired by Mosasaurus Hoffmannii and Orca anatomy. Thick , overlapping bony scales similar to Arapaima , providing a durable armor that flexes with movement. Limbs: Powerful large flippers adapted for scooting or sliding on land , coated with mucus inspired by the Atlantic hagfish for moisture retention and defense. Capable of limited terrestrial movement , allowing brief excursions out of water. Head & Jaw: Massive jaws with over 40 , 000 PSI bite force , blending Predator X’s mighty jaw strength with the long canine teeth and powerful bite of the Leopard Seal. Flexible skull allowing swallowing of large prey whole. Respiration: Dual respiratory system with both functional lungs and gills , enabling survival from surface to abyssal depths (500 to 9 , 800 feet). Bioluminescence: Red bioluminescent photophores patterned in tiger stripes , used for communication , intimidation , mating displays , and luring prey in the dark ocean depths. Abilities & Traits: Speed & Agility: Capable of bursts up to 82 mph , rivaling the fastest sea creatures like the Black Marlin. Agile hunter using stealth and passive listening , mimicking Transient Killer Whale hunting strategies. Social Structure: Small family groups of three (one male , two females) designed for efficient reproduction and hunting. Males are more streamlined and shorter , optimized for speed and power; females are larger , robust , and agile for endurance and nurturing. Regeneration: Remarkable limb regeneration inspired by axolotl and Crown-of-Thorns starfish , able to regrow lost fins , limbs , and even parts of internal organs. Defense: Venomous spines derived from Crown-of-Thorns starfish line its dorsal ridge , delivering painful venomous wounds to attackers. Mucus coating for defense and moisture retention , also making it slippery and difficult to grasp. Healing: A blubber-like layer similar to dolphins provides insulation , buoyancy , and antimicrobial properties that accelerate healing of wounds. Communication: Uses low-frequency growls , barks , and hisses inspired by saltwater crocodile sounds , combined with bioluminescent signals and stealth vocalizations for hunting. Reproduction: Live births occur at extreme depths (up to 9 , 800 feet) , with offspring adapted to survive in crushing pressures and cold temperatures. Backstory: Created by the Ceno Evail Crossgen Corporation , the Megalosaurus Orca was engineered to dominate marine ecosystems and serve as a living testament to the pinnacle of hybrid dinosaur biotechnology. Designed to combine the raw power of ancient sea predators like Predator X and Megalodon with the intelligence , social hunting , and adaptability of modern marine mammals and fish , this hybrid thrives in the dark , cold depths of the ocean where few predators dare to venture. Their unique physiology allows them to traverse both deep ocean trenches and brief terrestrial environments , making them versatile apex predators. The three known individuals—one male and two females—form a tight-knit family unit , hunting elusive marine mammals and large fish with stealth and precision. Their bioluminescent stripes not only intimidate rivals but also help coordinate complex hunting maneuvers in pitch-black waters. With a lifespan of 100 to 135 years , they are long-lived titans of the sea , their legacy intertwined with the future of marine genetic engineering and the mysteries of oceanic evolution. ,

A full-body portrait of a bonsai is the focal point , with its twisted trunk and carefully shaped canopy of leaves. Surrounding the Fractal bonsai are various botanical elements , such as ferns , moss , and small flowering plants inside a giant helping hand pose , rendered in luminous , recursive forms with glowing green and white accents , layered digital ,
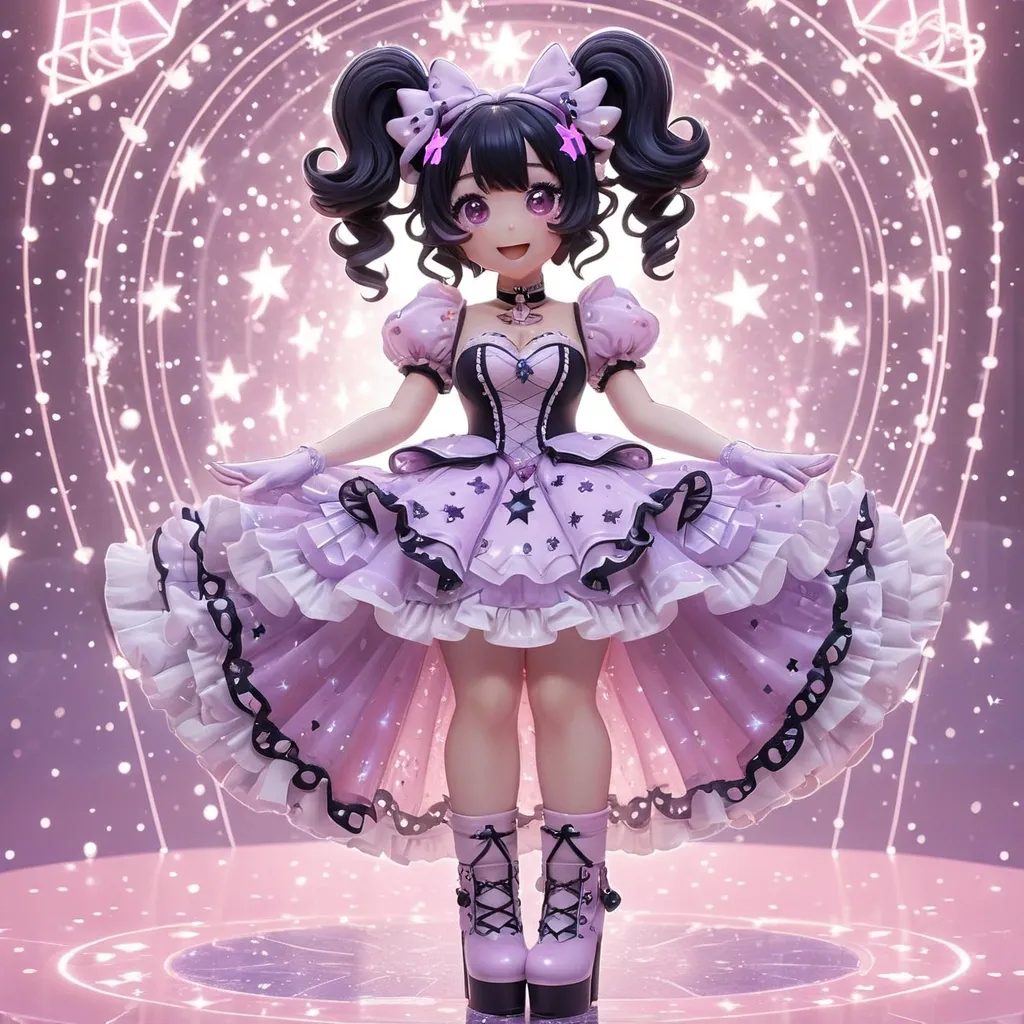
Main color: Lilac Accent colors: Soft pink , white , and bold black Outfit Description: Chikari's magical girl outfit is bright , cheerful , and a little chaotic—just like her personality! She wears a frilly lilac dress with playful , asymmetrical layers that flutter with every move. There are pink ribbon accents on her shoulders , waist , and knees , shaped like cute little hearts and stars. Her bodice is fitted and sparkly , with a faint heart motif stitched in pastel pink threads. White gloves trimmed in lilac lace cover her hands , and her boots are knee-high with chunky black soles and heart-shaped cutouts glowing soft pink. Heart Crystal Placement: Her crystal , a glimmering violet gem , sits boldly on the center of her chest like a brooch. It pulses gently when she casts magic , and detaches in her civilian form. Hair & Accessories: Chikari’s curly hair is tied into two high ponytails , held up with oversized , glittery bows. Her bangs are messy but cute , framing her round , expressive face. She wears sparkling star-shaped clips and a tiny floating charm that twinkles above her head like a mini satellite—it’s purely cosmetic , but adorable! Vibe / Movement: Her movements are bubbly and bouncy , like she’s constantly in the middle of a dance! Even when standing still , Chikari wiggles her fingers or twirls—she can’t help it! She have cupid vibe also make this a refrence sheet ,

can you help generate posters: Cafe's Name is Corner Beans with Tag line brewed by bro's 1. it's 1st yr anniversary for our coffee shop and we will have a coffee party 2. we have free croissants for the first 10 customers 3. coffee pong with good music. 4. Add the words come sip , sing , and celebrate this special milestone with us! Create a poster that will attract the people to join the anniversary ,

Working blueskinned Man and a sweet young Girl (with ultramarine blue Skin , white dreadlocks) helps him , spotlight , spaceHangar in the background , hyperrealistic , photografic , 8k , epic ambient light , octane render , natural properties (best quality:1.4) , ((masterpiece)) , ((realistic)) , (detailed) , no ugly , no mutation , no duplicate , no sexist ,
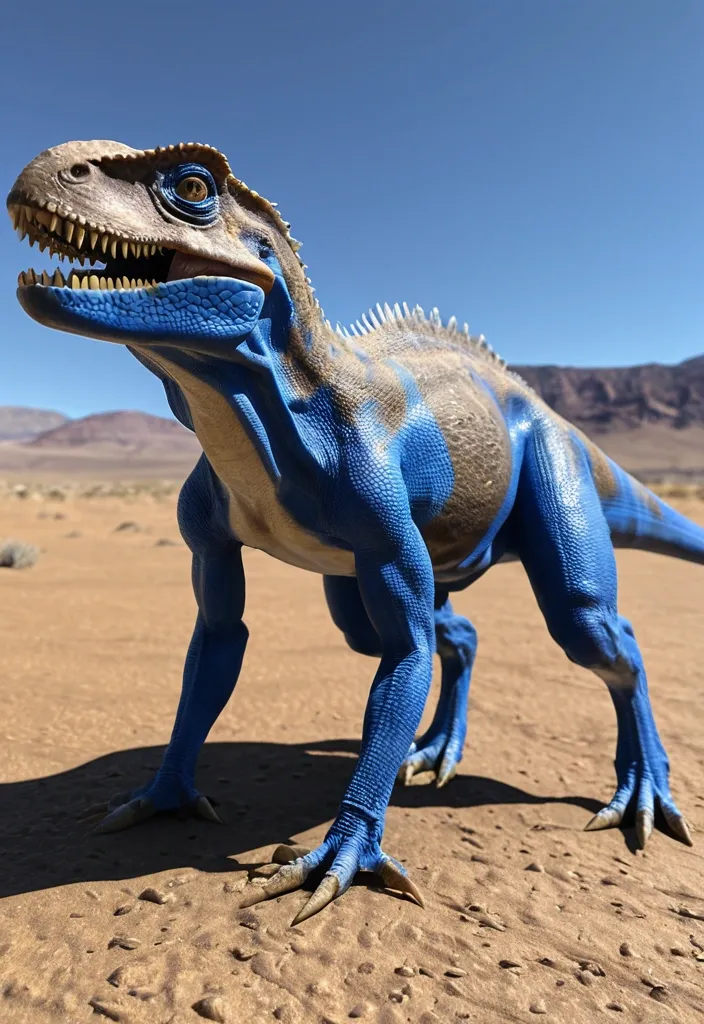
The hybrid was created by modifying the genome of a Tyrannosaurus rex , with the DNA of three other theropod species that were Utahraptor , Saurophaganax , and Giganotosaurus. Also the DNA of Quadrupes like Triceratops , Scelidosaurus , Gigantopithecus. DNA of modern animals such as Greater blue-ringed octopus , Inland Taipan , Northern Short-tailed Shrew , Komodo Dragon , Opossum , Mongoose , Whiptail Lizard , Cuttlefish , and Tardigrades. The genome of Tyrannosaurus rex , Utahraptor , Saurophaganax , and Giganotosaurus was used as the base genome for the hybrid. The shape of the headcrest is from the Triceratops. Utahraptor DNA was added for high levels of intelligence and the ability to make plans , decisions and pack hunting. Gigantopithecus DNA added for Knuckle-walking. Triceratops , and Scelidosaurus armor added a biological form of armor that absorbed most of the incoming attacks. Northern short-tailed shrew iron teeth , the Inland taipan's retractable fangs and the Komodo Dragon serrated teeth genome was used to form the teething of the hybrid. Saurophaganax and Gigantopithecus DNA added the presence of long strong arms with slashing hook claws and the use of tools. Cuttlefish genes were intended to help the hybrid withstand an accelerated growth , but it also added chromatophore cells in the skin so it could change the shape , color , and texture of its skin like a cuttlefish. Opossum , Mongoose and Tardigrades DNA was added for the hybrid to be more resistant to climate changes , harmful toxins or bacterial infections , while tardigrades also added survival of extreme conditions such as exposure to extreme temperatures , extreme pressures , air deprivation , radiation , dehydration , and starvation. Northern short-tailed shrew , the Inland Taipan , Greater blue-ringed octopus and the Komodo Dragon's DNA also added special cavities and glands in the skull that gave her infrared vision , and highly toxic saliva. Said DNA also gave her the ability to open her mandibles and jaws as wide as a snake , specifically at around 90 degrees.Lastly , DNA from a whiptail lizard was added for reproduction purposes. ,
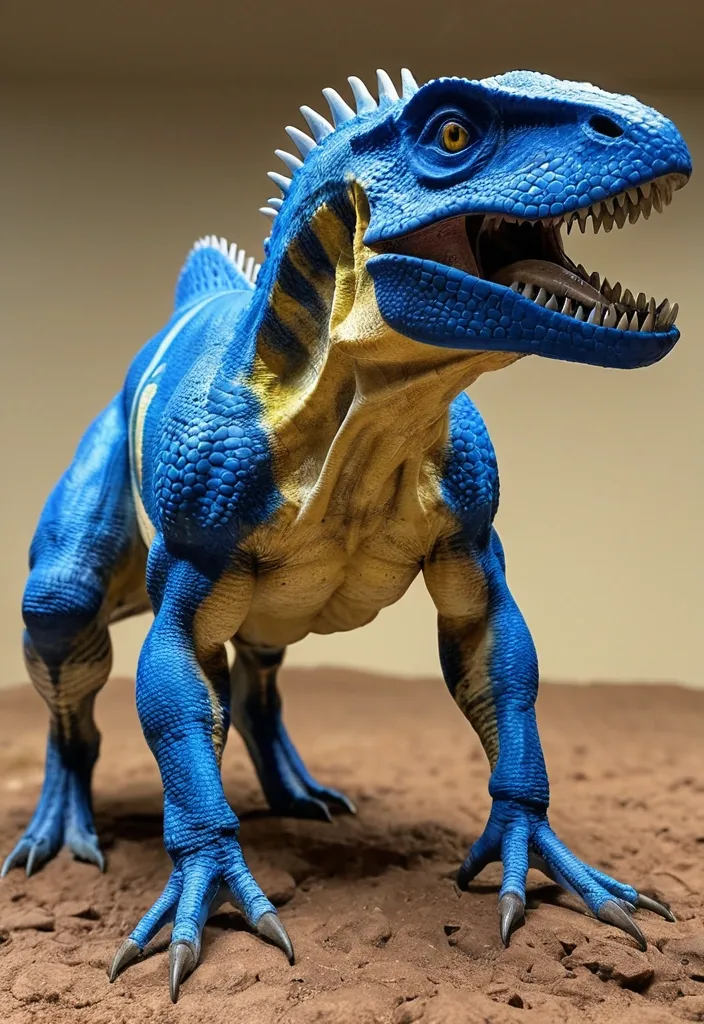
The hybrid was created by modifying the genome of a Tyrannosaurus rex , with the DNA of three other theropod species that were Utahraptor , Saurophaganax , and Giganotosaurus. Also the DNA of Quadrupes like Triceratops , Scelidosaurus , Gigantopithecus. DNA of modern animals such as Greater blue-ringed octopus , Inland Taipan , Northern Short-tailed Shrew , Komodo Dragon , Opossum , Mongoose , Whiptail Lizard , Cuttlefish , and Tardigrades. The genome of Tyrannosaurus rex , Utahraptor , Saurophaganax , and Giganotosaurus was used as the base genome for the hybrid. The shape of the headcrest is from the Triceratops. Utahraptor DNA was added for high levels of intelligence and the ability to make plans , decisions and pack hunting. Gigantopithecus DNA added for Knuckle-walking. Triceratops , and Scelidosaurus armor added a biological form of armor that absorbed most of the incoming attacks. Northern short-tailed shrew iron teeth , the Inland taipan's retractable fangs and the Komodo Dragon serrated teeth genome was used to form the teething of the hybrid. Saurophaganax and Gigantopithecus DNA added the presence of long strong arms with slashing hook claws and the use of tools. Cuttlefish genes were intended to help the hybrid withstand an accelerated growth , but it also added chromatophore cells in the skin so it could change the shape , color , and texture of its skin like a cuttlefish. Opossum , Mongoose and Tardigrades DNA was added for the hybrid to be more resistant to climate changes , harmful toxins or bacterial infections , while tardigrades also added survival of extreme conditions such as exposure to extreme temperatures , extreme pressures , air deprivation , radiation , dehydration , and starvation. Northern short-tailed shrew , the Inland Taipan , Greater blue-ringed octopus and the Komodo Dragon's DNA also added special cavities and glands in the skull that gave her infrared vision , and highly toxic saliva. Said DNA also gave her the ability to open her mandibles and jaws as wide as a snake , specifically at around 90 degrees.Lastly , DNA from a whiptail lizard was added for reproduction purposes. ,
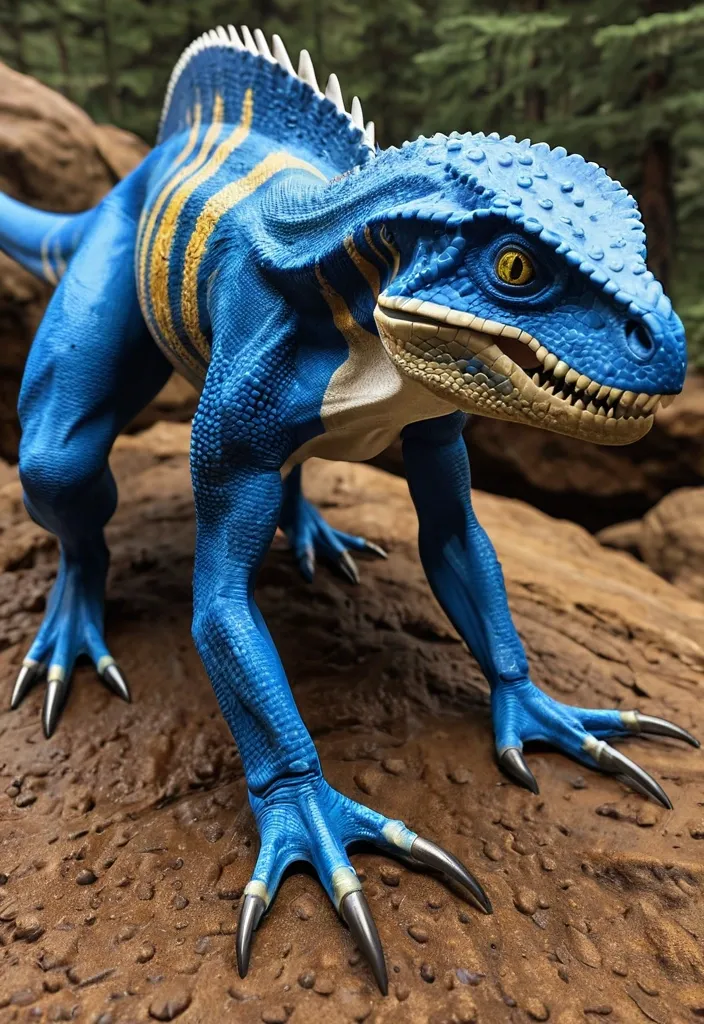
The hybrid was created by modifying the genome of a Tyrannosaurus rex , with the DNA of three other theropod species that were Utahraptor , Saurophaganax , and Giganotosaurus. Also the DNA of Quadrupes like Triceratops , Scelidosaurus , Gigantopithecus. DNA of modern animals such as Greater blue-ringed octopus , Inland Taipan , Northern Short-tailed Shrew , Komodo Dragon , Opossum , Mongoose , Whiptail Lizard , Cuttlefish , and Tardigrades. The genome of Tyrannosaurus rex , Utahraptor , Saurophaganax , and Giganotosaurus was used as the base genome for the hybrid. The shape of the headcrest is from the Triceratops. Utahraptor DNA was added for high levels of intelligence and the ability to make plans , decisions and pack hunting. Gigantopithecus DNA added for Knuckle-walking. Triceratops , and Scelidosaurus armor added a biological form of armor that absorbed most of the incoming attacks. Northern short-tailed shrew iron teeth , the Inland taipan's retractable fangs and the Komodo Dragon serrated teeth genome was used to form the teething of the hybrid. Saurophaganax and Gigantopithecus DNA added the presence of long strong arms with slashing hook claws and the use of tools. Cuttlefish genes were intended to help the hybrid withstand an accelerated growth , but it also added chromatophore cells in the skin so it could change the shape , color , and texture of its skin like a cuttlefish. Opossum , Mongoose and Tardigrades DNA was added for the hybrid to be more resistant to climate changes , harmful toxins or bacterial infections , while tardigrades also added survival of extreme conditions such as exposure to extreme temperatures , extreme pressures , air deprivation , radiation , dehydration , and starvation. Northern short-tailed shrew , the Inland Taipan , Greater blue-ringed octopus and the Komodo Dragon's DNA also added special cavities and glands in the skull that gave her infrared vision , and highly toxic saliva. Said DNA also gave her the ability to open her mandibles and jaws as wide as a snake , specifically at around 90 degrees.Lastly , DNA from a whiptail lizard was added for reproduction purposes. ,
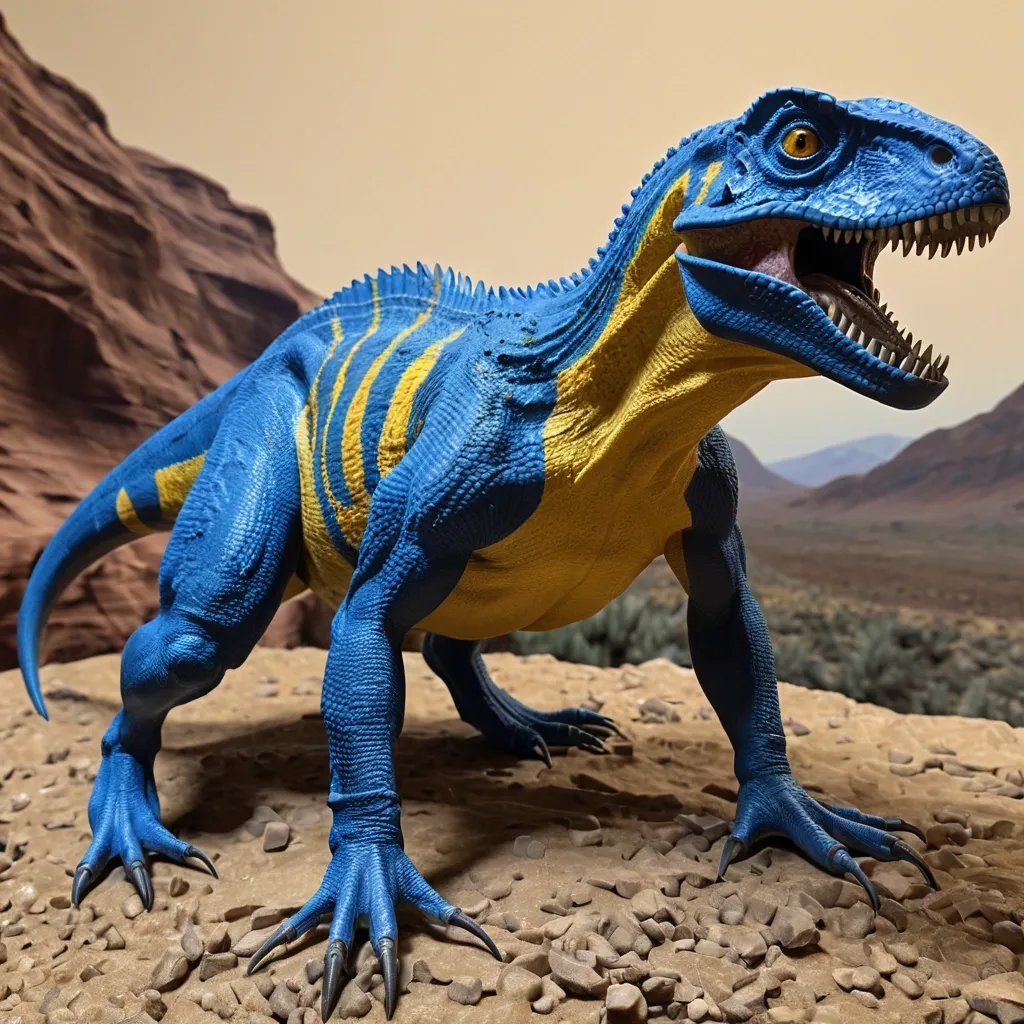
The hybrid was created by modifying the genome of a Tyrannosaurus rex , with the DNA of three other theropod species that were Utahraptor , Saurophaganax , and Giganotosaurus. Also the DNA of Quadrupes like Triceratops , Scelidosaurus , Gigantopithecus. DNA of modern animals such as Greater blue-ringed octopus , Inland Taipan , Northern Short-tailed Shrew , Komodo Dragon , Opossum , Mongoose , Whiptail Lizard , Cuttlefish , and Tardigrades. The genome of Tyrannosaurus rex , Utahraptor , Saurophaganax , and Giganotosaurus was used as the base genome for the hybrid. The shape of the headcrest is from the Triceratops. Utahraptor DNA was added for high levels of intelligence and the ability to make plans , decisions and pack hunting. Gigantopithecus DNA added for Knuckle-walking. Triceratops , and Scelidosaurus armor added a biological form of armor that absorbed most of the incoming attacks. Northern short-tailed shrew iron teeth , the Inland taipan's retractable fangs and the Komodo Dragon serrated teeth genome was used to form the teething of the hybrid. Saurophaganax and Gigantopithecus DNA added the presence of long strong arms with slashing hook claws and the use of tools. Cuttlefish genes were intended to help the hybrid withstand an accelerated growth , but it also added chromatophore cells in the skin so it could change the shape , color , and texture of its skin like a cuttlefish. Opossum , Mongoose and Tardigrades DNA was added for the hybrid to be more resistant to climate changes , harmful toxins or bacterial infections , while tardigrades also added survival of extreme conditions such as exposure to extreme temperatures , extreme pressures , air deprivation , radiation , dehydration , and starvation. Northern short-tailed shrew , the Inland Taipan , Greater blue-ringed octopus and the Komodo Dragon's DNA also added special cavities and glands in the skull that gave her infrared vision , and highly toxic saliva. Said DNA also gave her the ability to open her mandibles and jaws as wide as a snake , specifically at around 90 degrees.Lastly , DNA from a whiptail lizard was added for reproduction purposes. ,
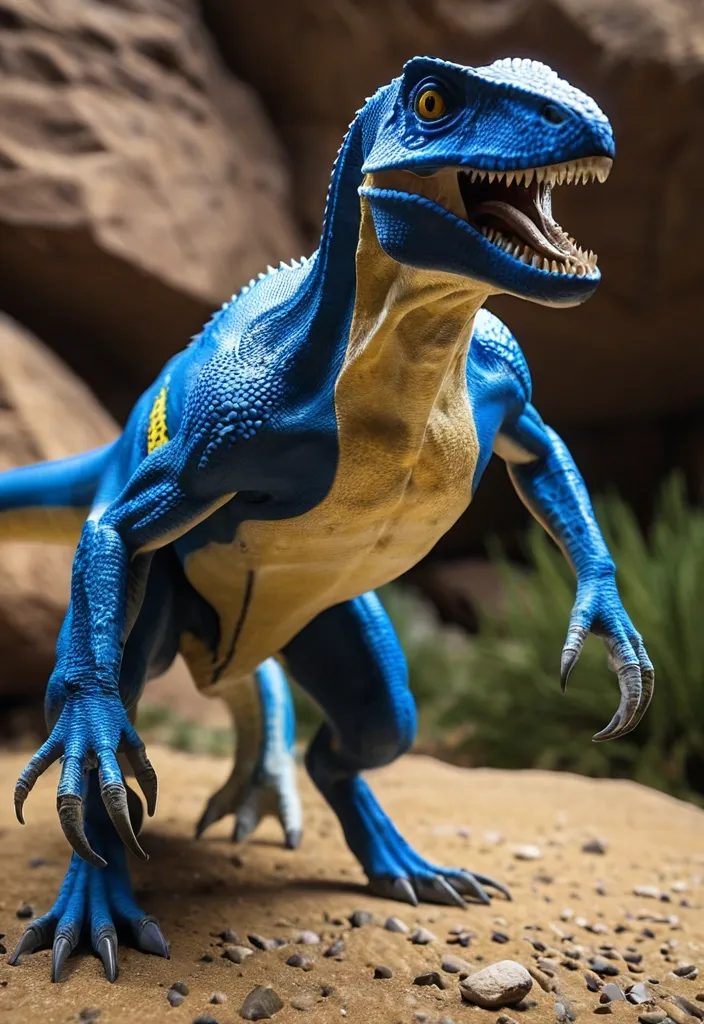
The hybrid was created by modifying the genome of a Tyrannosaurus rex , with the DNA of three other theropod species that were Utahraptor , Saurophaganax , and Giganotosaurus. Also the DNA of Quadrupes like Triceratops , Scelidosaurus , Gigantopithecus. DNA of modern animals such as Greater blue-ringed octopus , Inland Taipan , Northern Short-tailed Shrew , Komodo Dragon , Opossum , Mongoose , Whiptail Lizard , Cuttlefish , and Tardigrades. The genome of Tyrannosaurus rex , Utahraptor , Saurophaganax , and Giganotosaurus was used as the base genome for the hybrid. The shape of the headcrest is from the Triceratops. Utahraptor DNA was added for high levels of intelligence and the ability to make plans , decisions and pack hunting. Gigantopithecus DNA added for Knuckle-walking. Triceratops , and Scelidosaurus armor added a biological form of armor that absorbed most of the incoming attacks. Northern short-tailed shrew iron teeth , the Inland taipan's retractable fangs and the Komodo Dragon serrated teeth genome was used to form the teething of the hybrid. Saurophaganax and Gigantopithecus DNA added the presence of long strong arms with slashing hook claws and the use of tools. Cuttlefish genes were intended to help the hybrid withstand an accelerated growth , but it also added chromatophore cells in the skin so it could change the shape , color , and texture of its skin like a cuttlefish. Opossum , Mongoose and Tardigrades DNA was added for the hybrid to be more resistant to climate changes , harmful toxins or bacterial infections , while tardigrades also added survival of extreme conditions such as exposure to extreme temperatures , extreme pressures , air deprivation , radiation , dehydration , and starvation. Northern short-tailed shrew , the Inland Taipan , Greater blue-ringed octopus and the Komodo Dragon's DNA also added special cavities and glands in the skull that gave her infrared vision , and highly toxic saliva. Said DNA also gave her the ability to open her mandibles and jaws as wide as a snake , specifically at around 90 degrees.Lastly , DNA from a whiptail lizard was added for reproduction purposes. ,
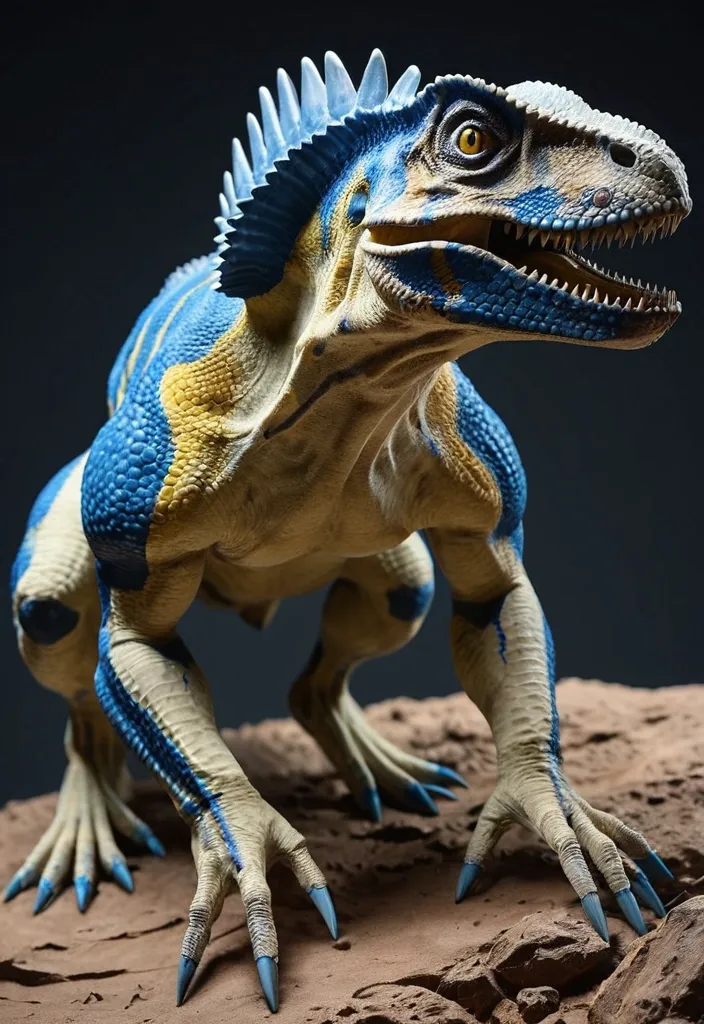
The hybrid was created by modifying the genome of a Tyrannosaurus rex , with the DNA of three other theropod species that were Utahraptor , Saurophaganax , and Giganotosaurus. Also the DNA of Quadrupes like Triceratops , and Scelidosaurus. DNA of modern animals such as Greater blue-ringed octopus , Inland Taipan , Northern Short-tailed Shrew , Komodo Dragon , Opossum , Mongoose , Gigantopithecus , Whiptail Lizard , Cuttlefish , and Tardigrades. The genome of Tyrannosaurus rex , Triceratops and Giganotosaurus was used as the base genome for the hybrid. Including the shape of the head in some parts from Giganotosaurus and Triceratops. Utahraptor DNA was added for high levels of intelligence and the ability to make plans , decisions and pack hunting. Reduced hind legs and Ape DNA added Knuckle-walking Quadruped. Triceratops , and Scelidosaurus were added to act as a biological form of armor that absorbed most of the incoming attacks. Northern short-tailed shrew , the Inland taipan's retractable fangs and the Komodo Dragon DNA was used to form the teeth of the Indominus that were used to tear through the flesh and armor of opponents. Saurophaganax and Gigantopithecus DNA added the presence of long strong arms with slashing hook claws and the use of tools. A swipe of the hybrid's claws would take down bigger opponents. While using tools for smaller elusive prey. Cuttlefish genes were intended to help the Venenosus withstand an accelerated growth , but it also added chromatophore cells in the skin so it could change the shape , color , and texture of its skin like a cuttlefish. Opossum , Mongoose and Tardigrades DNA was added for the Venenosus to be more resistant to climate changes , harmful toxins or bacterial infections , while tardigrades also added survival of extreme conditions such as exposure to extreme temperatures , extreme pressures , air deprivation , radiation , dehydration , and starvation. They have several defense mechanisms , including: A metabolic rate that gets as low as 0.01 percent of the normal rate. Organs protected by a sugary gel called trehalose. A protein that shields their DNA from radiation harm. Synthesis of cryoprotectant in chilly temperatures to prevent the development of ice crystals.Northern short-tailed shrew , the Inland Taipan , Greater blue-ringed octopus and the Komodo Dragon's DNA also added special cavities and glands in the skull that gave her infrared vision , and highly toxic saliva. Said DNA also gave her the ability to open her mandibles and jaws as wide as a snake , specifically at around 90 degrees.Lastly , DNA from a whiptail lizard was added for reproduction purposes. ,
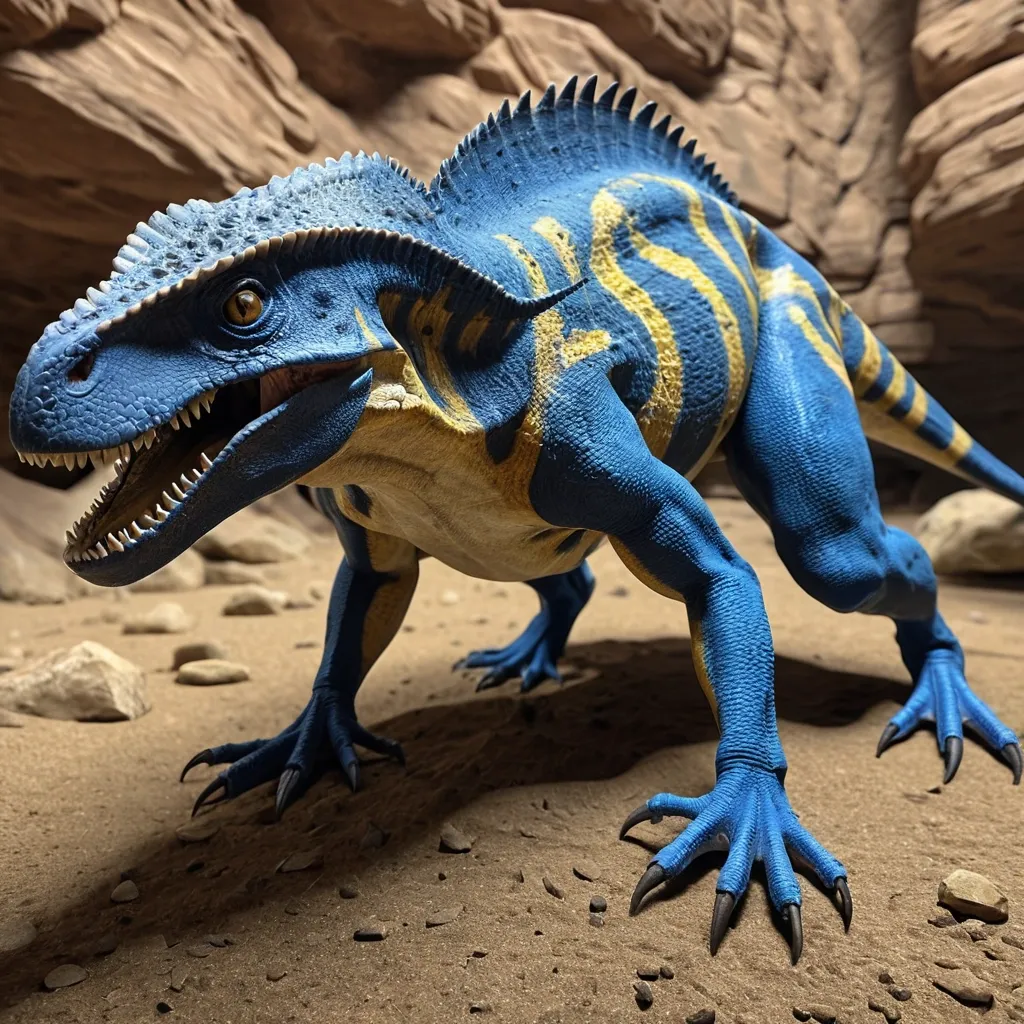
The hybrid was created by modifying the genome of a Tyrannosaurus rex , with the DNA of three other theropod species that were Utahraptor , Saurophaganax , and Giganotosaurus. Also the DNA of Quadrupes like Triceratops , and Scelidosaurus. DNA of modern animals such as Greater blue-ringed octopus , Inland Taipan , Northern Short-tailed Shrew , Komodo Dragon , Opossum , Mongoose , Gigantopithecus , Whiptail Lizard , Cuttlefish , and Tardigrades. The genome of Tyrannosaurus rex , Triceratops and Giganotosaurus was used as the base genome for the hybrid. Including the shape of the head in some parts from Giganotosaurus and Triceratops. Utahraptor DNA was added for high levels of intelligence and the ability to make plans , decisions and pack hunting. Reduced hind legs and Ape DNA added Knuckle-walking Quadruped. Triceratops , and Scelidosaurus were added to act as a biological form of armor that absorbed most of the incoming attacks. Northern short-tailed shrew , the Inland taipan's retractable fangs and the Komodo Dragon DNA was used to form the teeth of the Indominus that were used to tear through the flesh and armor of opponents. Saurophaganax and Gigantopithecus DNA added the presence of long strong arms with slashing hook claws and the use of tools. A swipe of the hybrid's claws would take down bigger opponents. While using tools for smaller elusive prey. Cuttlefish genes were intended to help the Venenosus withstand an accelerated growth , but it also added chromatophore cells in the skin so it could change the shape , color , and texture of its skin like a cuttlefish. Opossum , Mongoose and Tardigrades DNA was added for the Venenosus to be more resistant to climate changes , harmful toxins or bacterial infections , while tardigrades also added survival of extreme conditions such as exposure to extreme temperatures , extreme pressures , air deprivation , radiation , dehydration , and starvation. They have several defense mechanisms , including: A metabolic rate that gets as low as 0.01 percent of the normal rate. Organs protected by a sugary gel called trehalose. A protein that shields their DNA from radiation harm. Synthesis of cryoprotectant in chilly temperatures to prevent the development of ice crystals.Northern short-tailed shrew , the Inland Taipan , Greater blue-ringed octopus and the Komodo Dragon's DNA also added special cavities and glands in the skull that gave her infrared vision , and highly toxic saliva. Said DNA also gave her the ability to open her mandibles and jaws as wide as a snake , specifically at around 90 degrees.Lastly , DNA from a whiptail lizard was added for reproduction purposes. ,
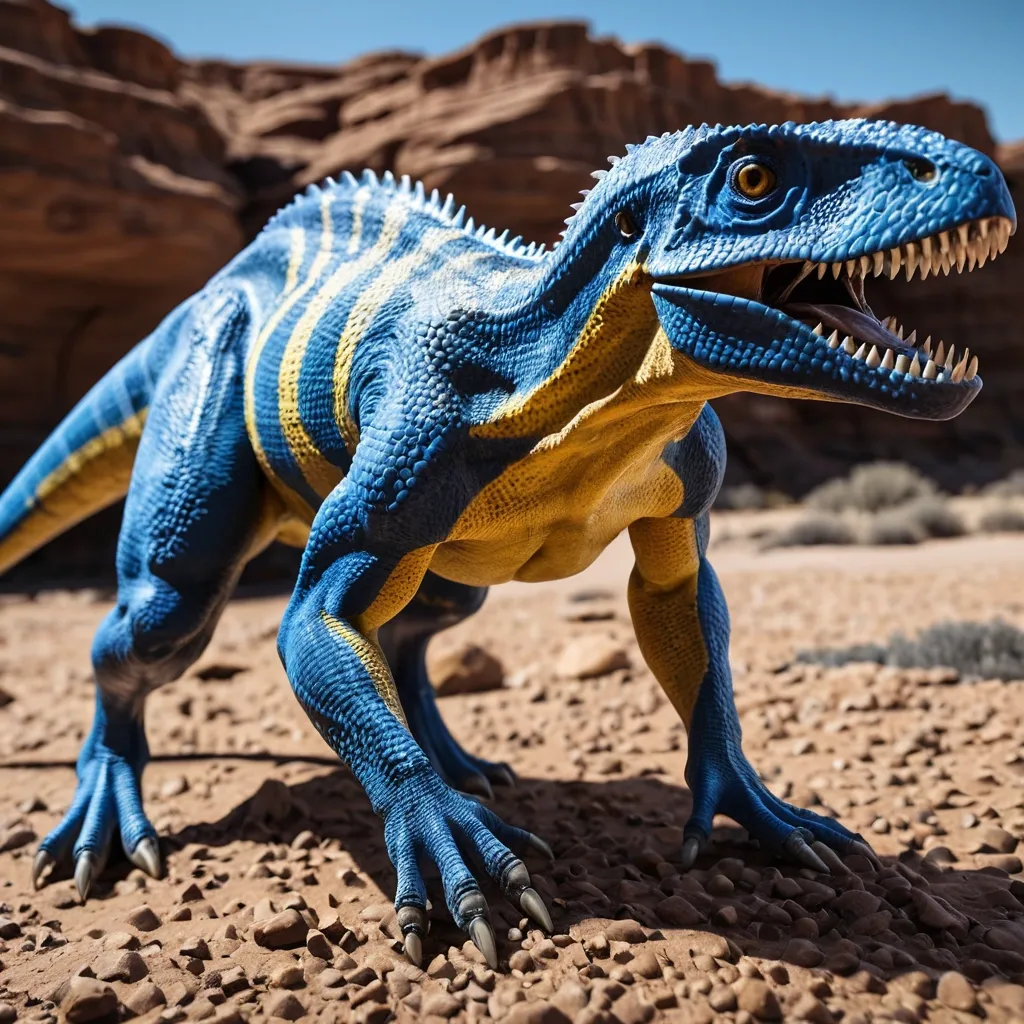
The hybrid was created by modifying the genome of a Tyrannosaurus rex , with the DNA of three other theropod species that were Utahraptor , Saurophaganax , and Giganotosaurus. Also the DNA of Quadrupes like Triceratops , and Scelidosaurus. DNA of modern animals such as Greater blue-ringed octopus , Inland Taipan , Northern Short-tailed Shrew , Komodo Dragon , Opossum , Mongoose , Gigantopithecus , Whiptail Lizard , Cuttlefish , and Tardigrades. The genome of Tyrannosaurus rex , Triceratops and Giganotosaurus was used as the base genome for the hybrid. Including the shape of the head in some parts from Giganotosaurus and Triceratops. Utahraptor DNA was added for high levels of intelligence and the ability to make plans , decisions and pack hunting. Reduced hind legs and Ape DNA added Knuckle-walking Quadruped. Triceratops , and Scelidosaurus were added to act as a biological form of armor that absorbed most of the incoming attacks. Northern short-tailed shrew , the Inland taipan's retractable fangs and the Komodo Dragon DNA was used to form the teeth of the Indominus that were used to tear through the flesh and armor of opponents. Saurophaganax and Gigantopithecus DNA added the presence of long strong arms with slashing hook claws and the use of tools. A swipe of the hybrid's claws would take down bigger opponents. While using tools for smaller elusive prey. Cuttlefish genes were intended to help the Venenosus withstand an accelerated growth , but it also added chromatophore cells in the skin so it could change the shape , color , and texture of its skin like a cuttlefish. Opossum , Mongoose and Tardigrades DNA was added for the Venenosus to be more resistant to climate changes , harmful toxins or bacterial infections , while tardigrades also added survival of extreme conditions such as exposure to extreme temperatures , extreme pressures , air deprivation , radiation , dehydration , and starvation. They have several defense mechanisms , including: A metabolic rate that gets as low as 0.01 percent of the normal rate. Organs protected by a sugary gel called trehalose. A protein that shields their DNA from radiation harm. Synthesis of cryoprotectant in chilly temperatures to prevent the development of ice crystals.Northern short-tailed shrew , the Inland Taipan , Greater blue-ringed octopus and the Komodo Dragon's DNA also added special cavities and glands in the skull that gave her infrared vision , and highly toxic saliva. Said DNA also gave her the ability to open her mandibles and jaws as wide as a snake , specifically at around 90 degrees.Lastly , DNA from a whiptail lizard was added for reproduction purposes. ,
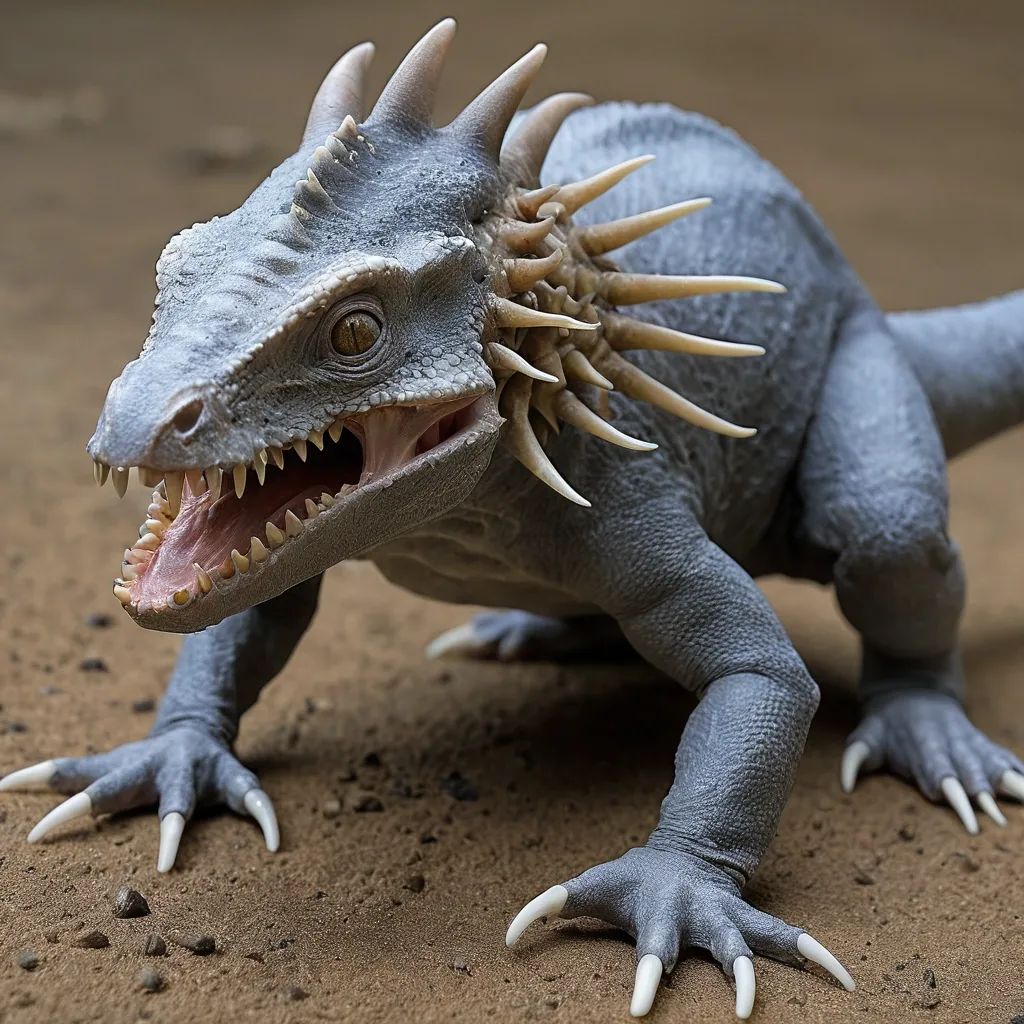
The genome of Tyrannosaurus rex , Triceratops and Giganotosaurus was used as the base genome for the hybrid. Including the shape of the head in some parts from Triceratops. Utahraptor DNA was added for high levels of intelligence and the ability to make plans , decisions and pack hunting. Reduced hind legs and Ape DNA added Knuckle-walking Quadruped. Triceratops , and Scelidosaurus were added to act as a biological form of armor that absorbed most of the incoming attacks. Northern short-tailed shrew , the Inland taipan's retractable fangs and the Komodo Dragon DNA was used to form the teeth of the Indominus that were used to tear through the flesh and armor of opponents. Saurophaganax and Gigantopithecus DNA added the presence of long strong arms with slashing hook claws and the use of tools. A swipe of the hybrid's claws would take down bigger opponents. While using tools for smaller elusive prey. Cuttlefish genes were intended to help the Venenosus withstand an accelerated growth , but it also added chromatophore cells in the skin so it could change the shape , color , and texture of its skin like a cuttlefish. Opossum , Mongoose and Tardigrades DNA was added for the Venenosus to be more resistant to climate changes , harmful toxins or bacterial infections , while tardigrades also added survival of extreme conditions such as exposure to extreme temperatures , extreme pressures , air deprivation , radiation , dehydration , and starvation. They have several defense mechanisms , including: A metabolic rate that gets as low as 0.01 percent of the normal rate. Organs protected by a sugary gel called trehalose. A protein that shields their DNA from radiation harm. Synthesis of cryoprotectant in chilly temperatures to prevent the development of ice crystals.Northern short-tailed shrew , the Inland Taipan , Greater blue-ringed octopus and the Komodo Dragon's DNA also added special cavities and glands in the skull that gave her infrared vision , and highly toxic saliva. Said DNA also gave her the ability to open her mandibles and jaws as wide as a snake , specifically at around 90 degrees.Lastly , DNA from a whiptail lizard was added for reproduction purposes. ,


