Search Results for board
Explore AI generated designs, images, art and prompts by top community artists and designers.
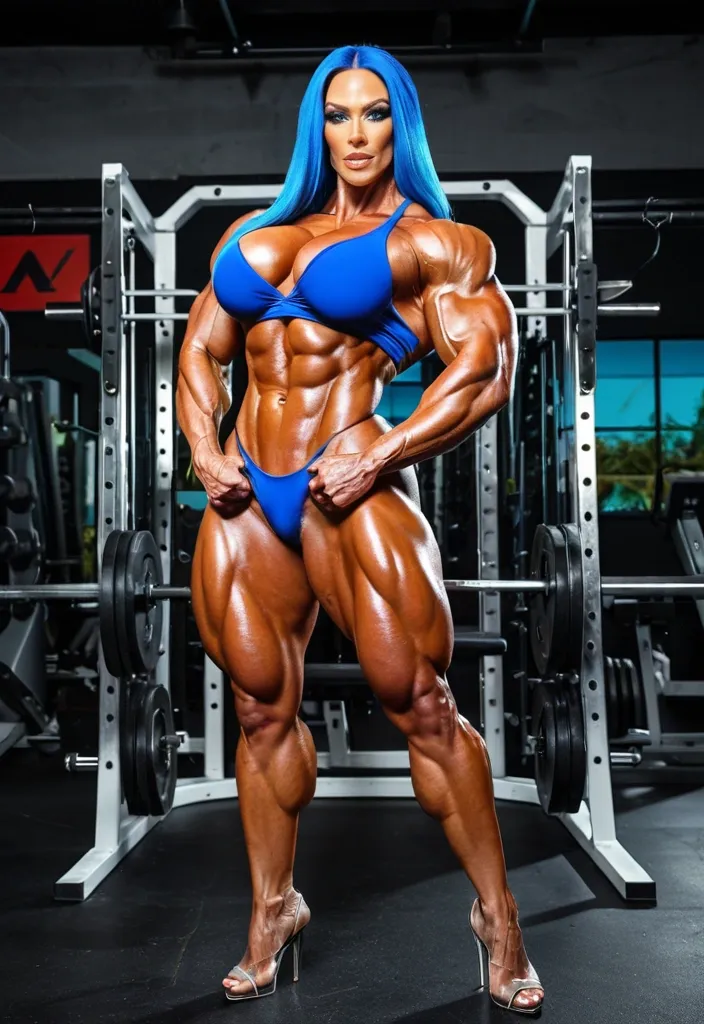

Create an image of a strikingly beautiful blue hair asian woman standing confidently in a vibrant , colorful environment , her body a hyper-realistic display of super exaggerated muscle mass and curves. She faces the viewer directly , her light blonde hair flowing loosely , framing her sharp jawline and bright , sparkling blue eyes that exude confidence and dominance. Her outfit consists of tiny , barely-there clothing that accentuates her insane physique. Her biceps are enormously large , veined , and perfectly spherical , like two massive boulders resting on her arms. They are so large that they touch her shoulders , creating an extreme , exaggerated curve in her arms. Her forearms are thick and powerful , with visible , popping veins that snake down to her large , strong hands. Her shoulders are incredibly broad and powerful , covered in a dense , rippling symphony of muscles , with deltoids that are massive , rounded , and perfectly defined , creating an extreme V-taper that narrows down to a tiny , cinched waist. Her back is a rippling symphony of muscles , with latissimus dorsi that stretch out to her sides , creating an insane amount of width and mass. Her rhomboids , traps , and lats are all perfectly defined and separated , with visible , popping veins. Her abs are a deeply carved , perfectly defined eight-pack , each muscle group distinctly separated and defined , like the ridges of a washboard , leading down to a pronounced V-line. Her obliques are perfectly defined and separated , with visible , popping veins that snake down to her hips. Her legs are thick and powerful , with quad muscles that are perfectly spherical and hard as marble. Her thighs are an insane 55 inches in circumference , creating a monstrous , round peak at the top of her legs. Her hamstrings are equally developed and visible , adding to the balanced , hyper-muscular look of her legs. Her calves are rock-hard , defined , and sculpted from stone. Despite her enormous muscle size , she maintains an hourglass figure , with a waist so small it seems to defy the laws of physics. This creates an illusion of a wasp waist that accentuates her insanely curvaceous hips and glutes , which are massive , round , and firm. Her glutes are so large and round that they create a massive , round peak at the top of her legs. Her bosom is enormously massive , round , and firm , with a staggering 85-inch circumference , defying gravity and complementing her hyper-muscular frame. They are so large and perfectly round that they strain against the tiny , barely-there bikini top she wears , threatening to spill out and defy the constraints of her clothing. Her pectorals are also perfectly defined and separated , creating an insane amount of detail and definition , with visible , popping veins that snake down to her abdomen. She strikes a powerful , confident pose , with one hand on her hip and the other resting casually on her head , showcasing her insane arm and shoulder development. The background is bright and vibrant , with colorful , lush surroundings that provide a stark contrast to her dramatic , moody physique , making her the sole focus of the scene. Her muscles are so large and defined that they seem to be exploding through her skin , creating an overwhelming sense of raw , unbridled power and strength. Every muscle group is perfectly balanced , creating a sense of harmony and perfection in her hyper-muscular physique. Her skin glistens with a thin layer of sweat , catching the light and emphasizing every insane detail and definition of her muscles. ,
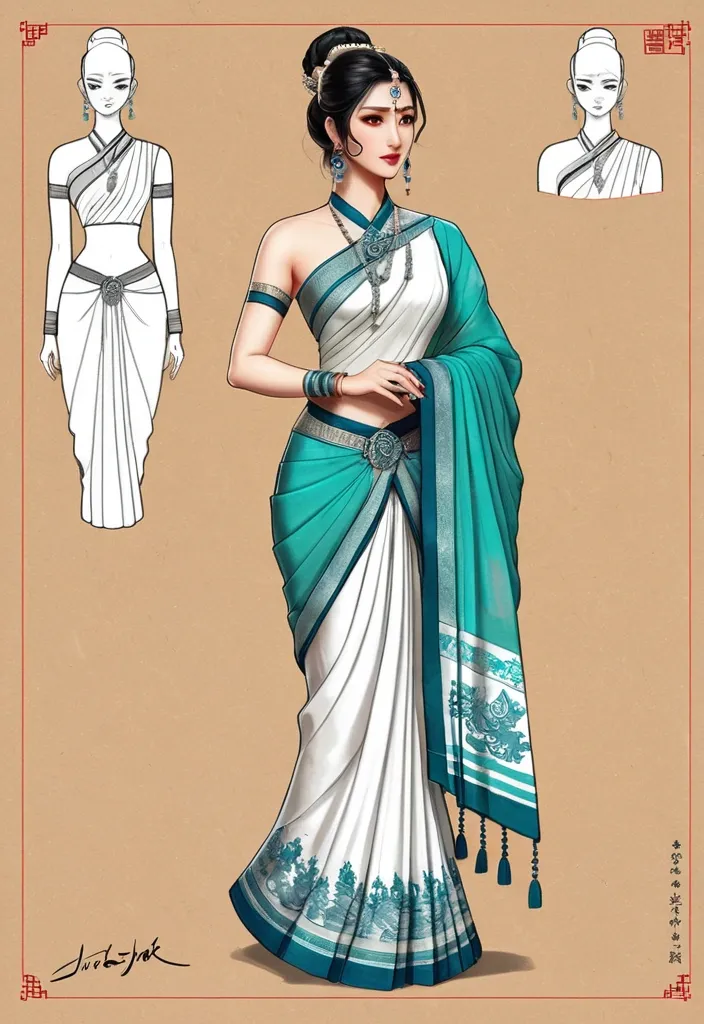
Generate an image in the style of "Paper Comes to Life · Ancient Style Exquisite Draft": Awakening of a high-end Eastern ancient-style costume design sketch , 4:5 vertical format. The scene is shot from a top-down view + slight oblique angle perspective , with a sheet of off-white costume design sketch paper clipped to a wooden drawing board , placed on a warm wood-toned design workbench. The main subject is an adult Chinese ancient-style realistic beauty , naturally awakening from the costume design sketch on the paper. The character is highly realistic , with fair and natural skin , delicate facial features , and eyes full of emotional tension. Temperament options: coquettish and lively. Costume direction options: Chinon Silk Traditional Saree. Transition method: The upper body and upper portion of the costume are a complete realistic finished product; the main Saree hem is a Chinon Silk Traditional Saree sketch that has just been painted , retaining pencil construction lines , Saree pleat lines , ribbon flow directions , and light coloring; at the very bottom of the Saree hem , one corner of the side hem , or near the shoe tips , retain a small amount of unfinished pencil sketches. Add a few handwritten annotations on the paper: LOOK 01 , sleeve volume , palave flow , Saree movement , hair ornament , and may include Indian traditional: sleeve shape , Saree hem dynamics , hair bun structure , palave flow direction. On the desk , add fabric swatches , color cards , pencils , dip pens , ceramic teacups , jade ornaments , hairpins , small sketch cards; in the bottom right corner , include a real hand-held pencil continuing to draw. Realistic photography feel , high-end Eastern aesthetics , ancient-style portrait sense , costume design sketch contrast , real paper texture , accurate shadows , clean composition. Avoid cartoonish , anime faces , plastic skin , text garbling , incorrect human proportions , fully gray-white lower body , disjointed upper and lower halves. ,
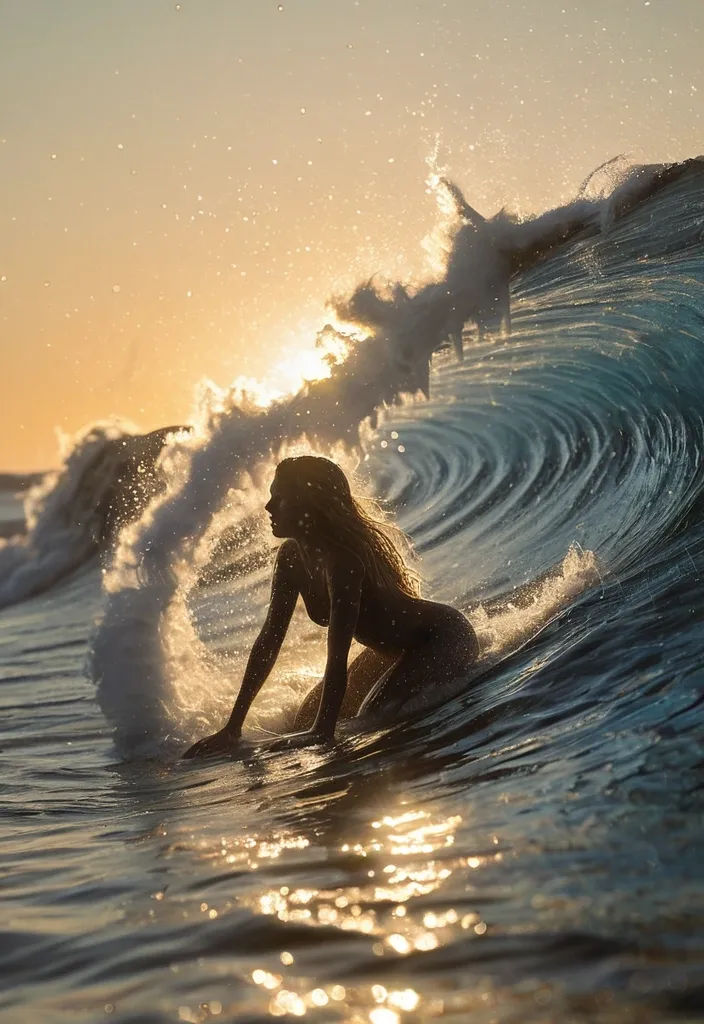
Creative ocean scene emerge into lone surfer riding along the face of a breaking wave during golden hour. The surfer is positioned near the center of the frame , crouched low on the board with arms extended for balance as water explodes around her in a curtain of sparkling droplets. Warm sunlight streams from behind , creating a luminous halo through her windblown hair and illuminating the spray with thousands of glittering highlights , with a smaller clouds flow , lighter (blue and black stippling formation behind it diminishing in size:1.0) , The foreground is filled with soft-focus water and bright reflections , while the distant horizon fades into a dreamy blur of light and atmosphere. The overall mood is serene and contemplative , showcasing the meticulous nature of stippling art. ,
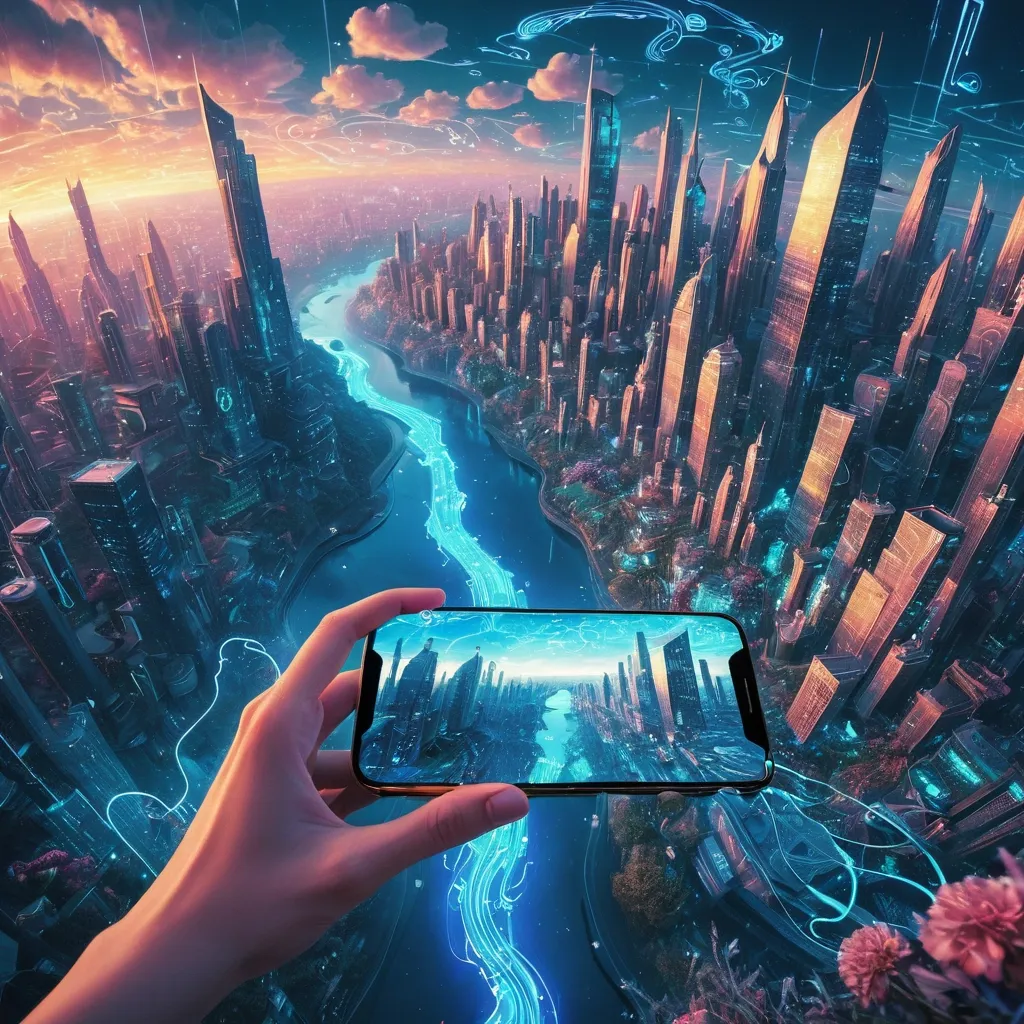
Imagine a surrealist artwork featuring a female face melting into a vivid , dreamlike landscape. Her hand reaches out , holding an iPhone that frames a fantastical cityscape. The sky is a mesmerizing blend of clouds and digital code , glowing with a soft , ethereal light. Rivers of luminous code flow through the city , merging with lush greenery , vibrant flowers , and glowing neon lights. Skyscrapers defy gravity , floating and curving in mid-air , with surfaces that shimmer like circuit boards. The scene is alive with energy , a surreal blend of the natural and the digital. The color palette balances deep blues , shimmering golds , and muted tones , evoking a sense of magic and endless possibility. ,
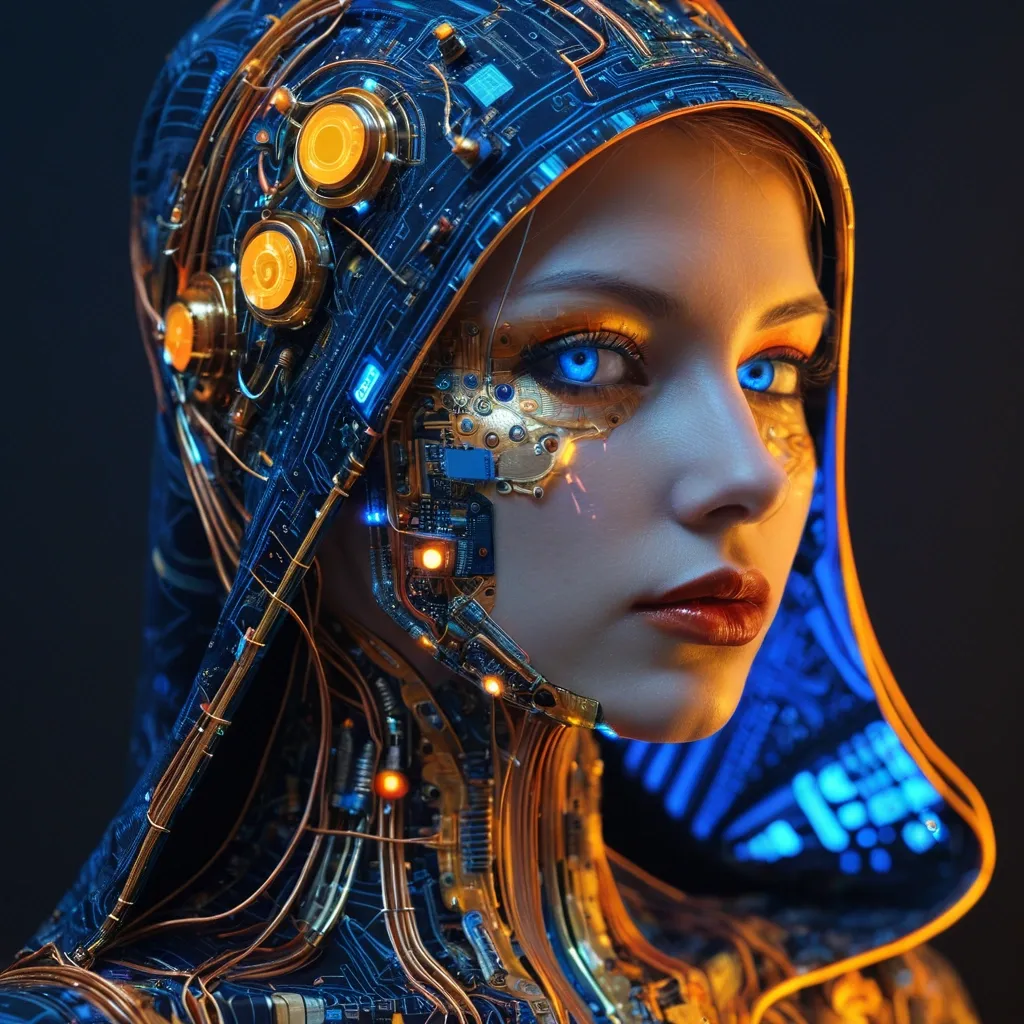
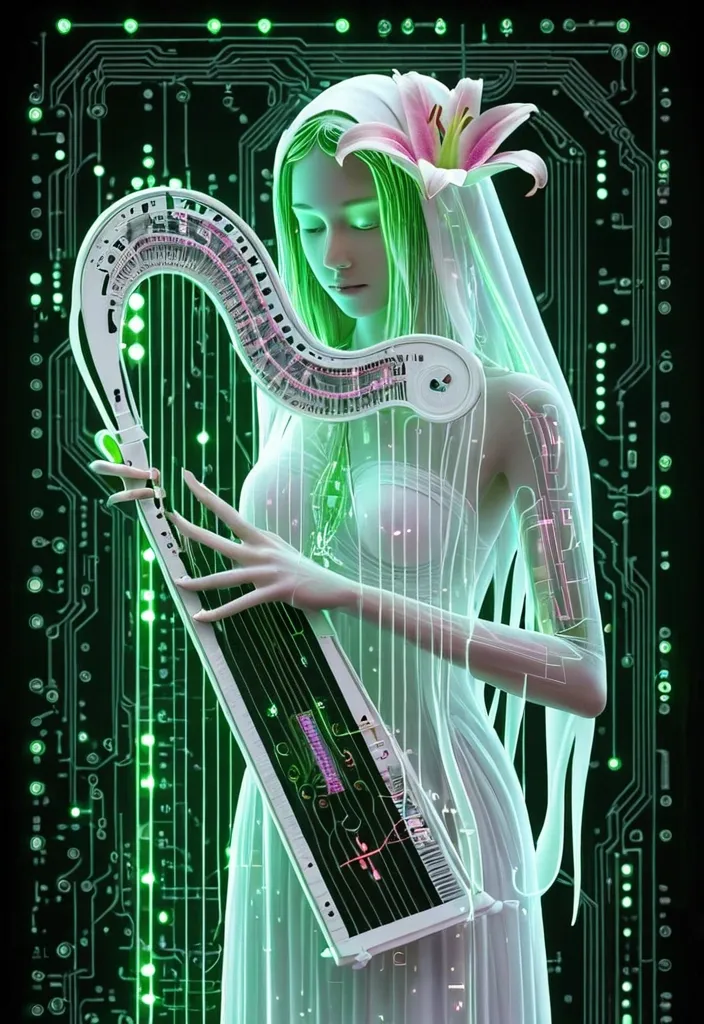
a vibrant , close up image of a woman embodying a fusion of organic and technological elements. the right side of her head is enveloped by a deep blue hood , while the left side is replaced with a highly detailed , illuminated circuit board in shades of gold and orange. her visible features include piercing blue eyes , bold eyeliner , and vibrant red lips with a subtle wire detail. she wears a form fitting , dark , patterned top that accentuates her neck. the ambient lighting in the background features soft , blurred oranges and blues. ,
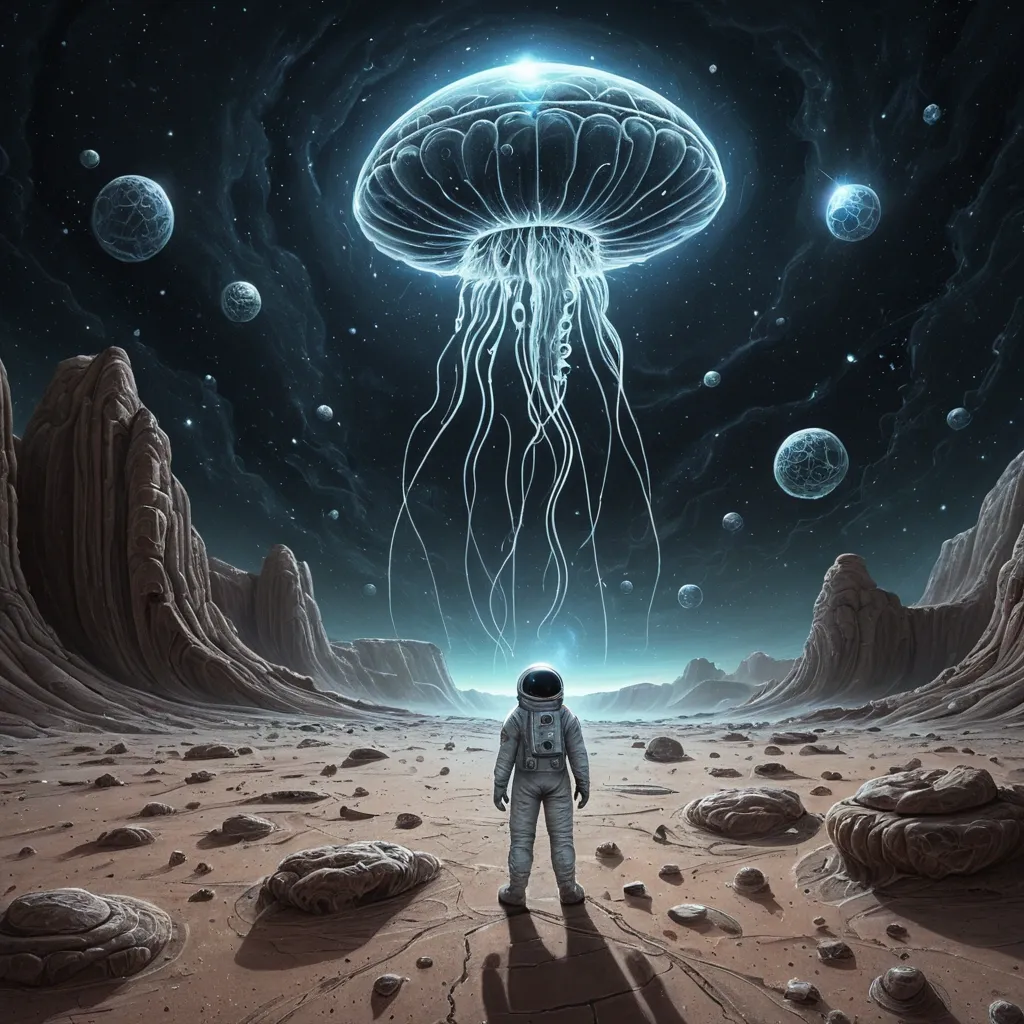
A chalk art illustration of a solitary astronaut stands on a desolate , rocky planet , gazing up at a colossal , ethereal jellyfish composed head like UFO , drifts through the void of deep space , its bioluminescent tendrils casting an otherworldly glow on the alien sky. The planet's surface is cracked and arid , with strange , geometric rock formations , created with hand-drawn chalk strokes and soft powdery textures. Visible chalk dust , blended colors , authentic blackboard surface , artistic shading , handcrafted aesthetic. ,
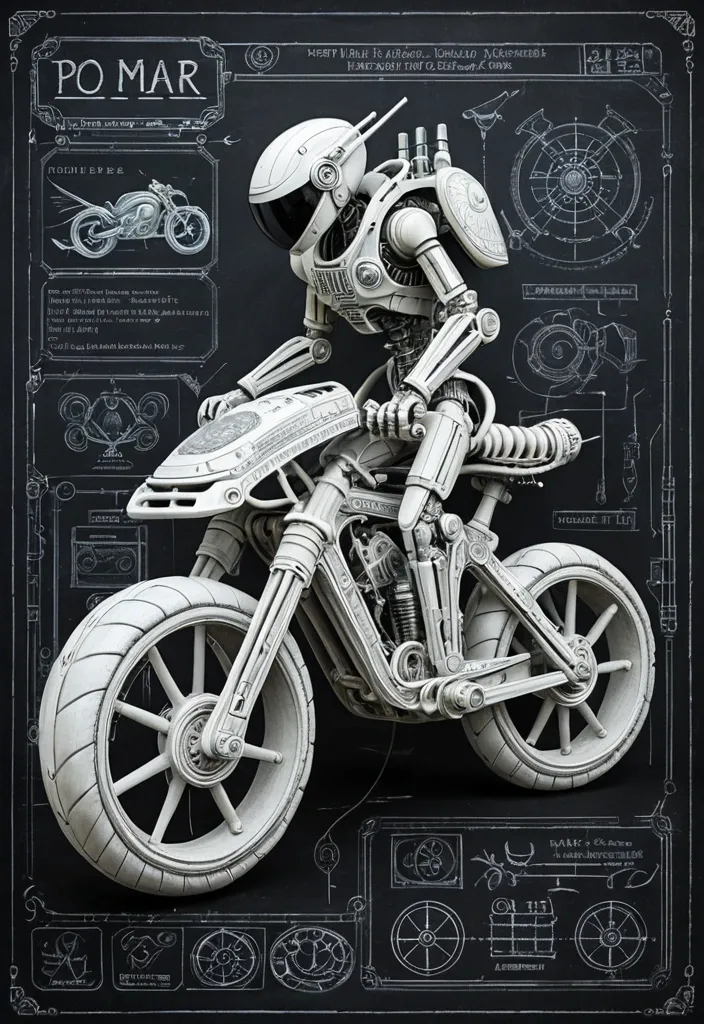
A chalk art illustration of a mysterious and flying RoboBike ((no wheels)) , the main body is finished in colossal Biomechanical RoboBike made of matte white armored components , exposed joints , hydraulic propellers , braided cables , industrial tubing , layered mechanical plates with engraved serial numbers and warning labels , alien explorer piloting a miniature , created with hand-drawn chalk strokes and soft powdery textures. Visible chalk dust , blended colors , authentic blackboard surface , artistic shading , handcrafted aesthetic. ,
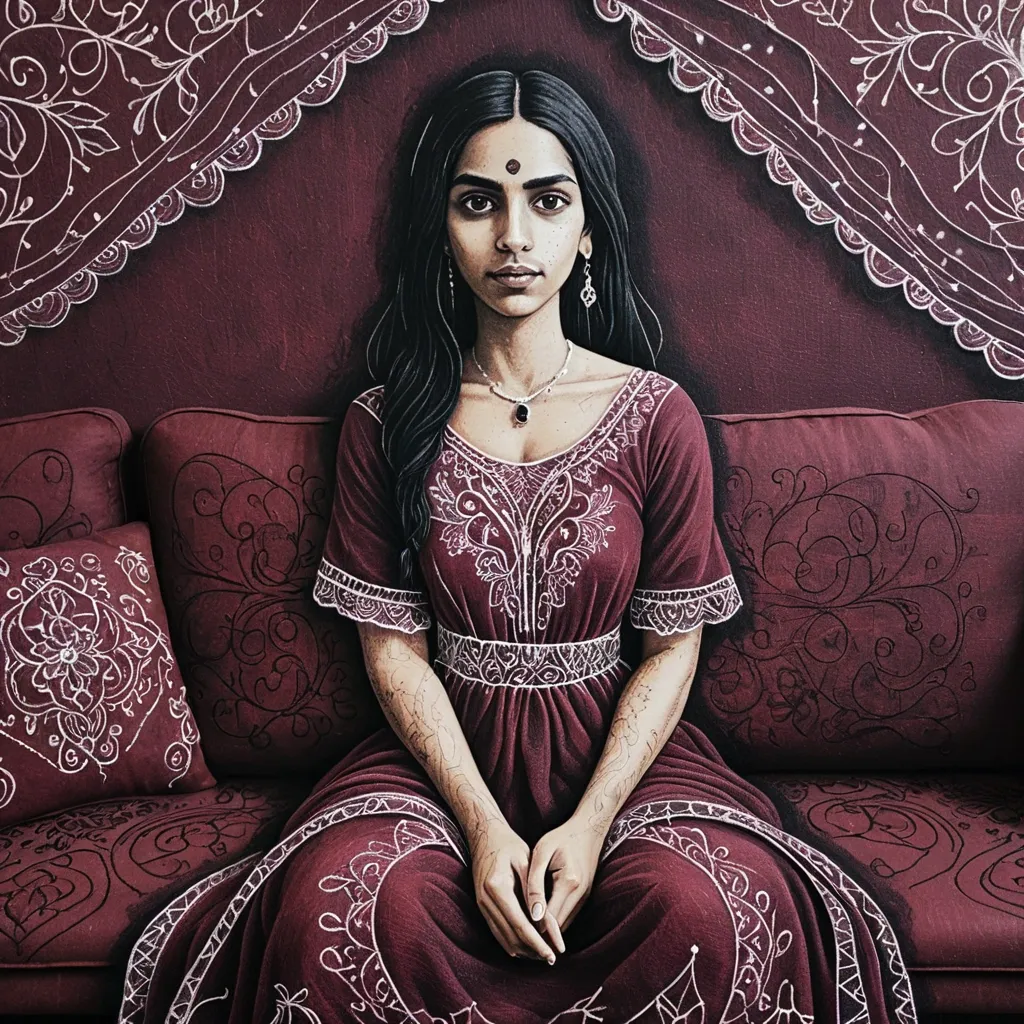
A chalk art illustration of a beautiful woman , She wears Maroon embroidered fabric partially veiling her lower head , sitting on Comfortable sofa , her dusky skin and black hair contrasting with the maroon embroidered fabric partially. created with hand-drawn chalk strokes and soft powdery textures. Visible chalk dust , blended colors , authentic blackboard surface , artistic shading , handcrafted aesthetic. ,
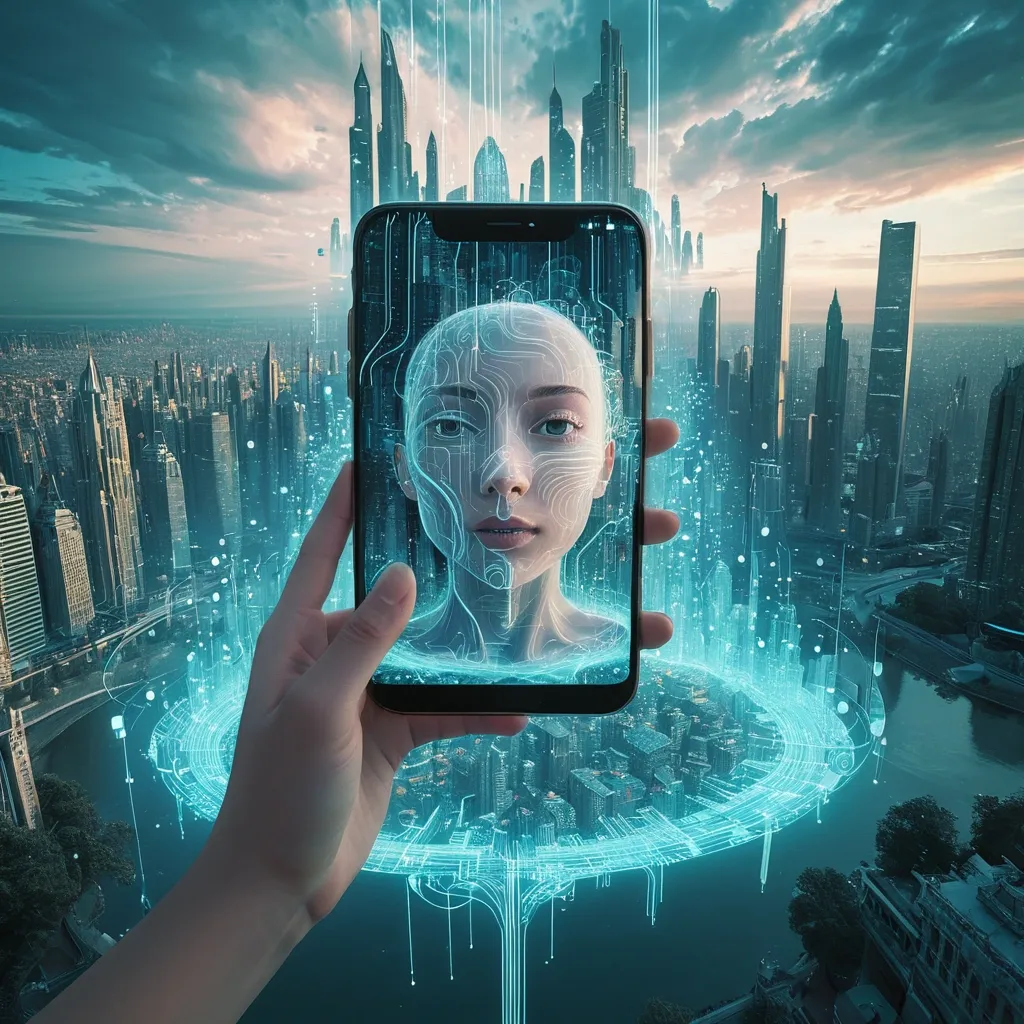
Envision a surrealist masterpiece featuring a female face dissolving into a vibrant , ethereal landscape. Her hand extends , holding an iPhone that captures a breathtaking cityscape. The sky above blends wispy clouds with digital , Matrix-inspired code , creating a mesmerizing backdrop. Rivers of glowing code flow through the city , merging with natural elements like lush greenery and flowers. The color scheme balances blues and golds with soft whites and muted tones , imbuing the scene with magic and wonder. Add surreal details such as levitating skyscrapers , circuit board patterns on buildings , and a sense of movement and energy , as if the scene is alive and pulsing with an otherworldly power. ,
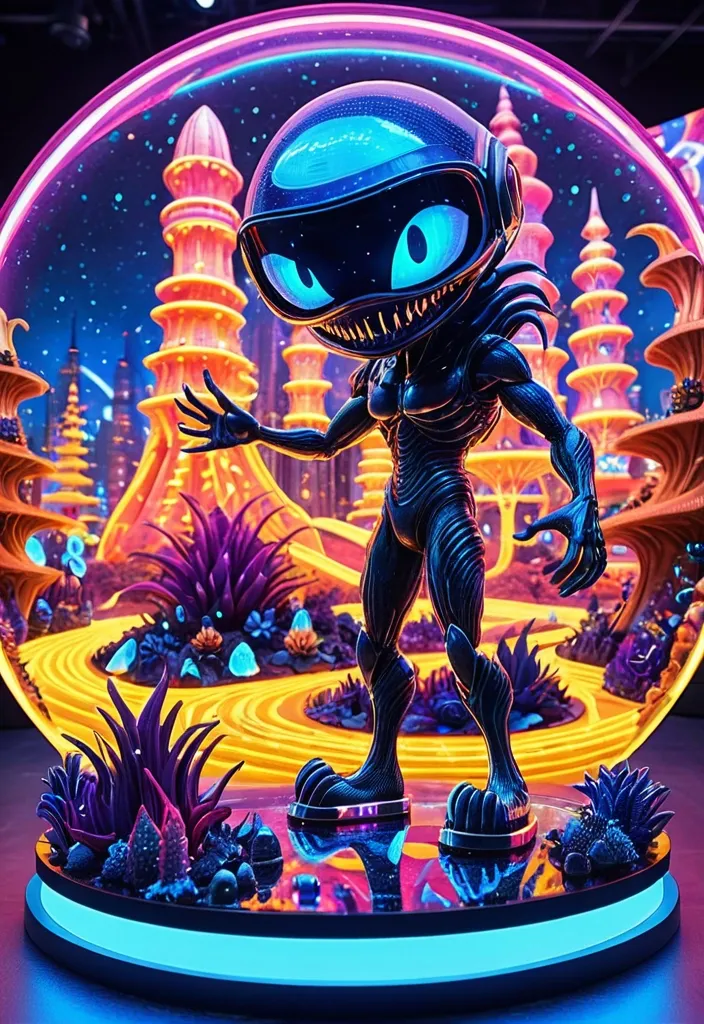
Illustrate a whimsical scene with a Xenomorph man who has flowing , fiery carpet hair that combines with playful , cartoonish alien plants. He is intrigued by a holographic display of a tiny Aladdin from the 2019 film , joyfully surfing on a bright , sparkling board. Her helmet visor reflects a lively , animated space dock. Standing on a glittering crystal platform , the Xenomorph enjoys a panoramic view of a vibrant , cartoonish city where nature and technology are humorously integrated. The style should be colorful and exaggerated , with bold lines and a lighthearted atmosphere that invites a sense of wonder and playfulness. Emphasize fun textures and vibrant colors. ,
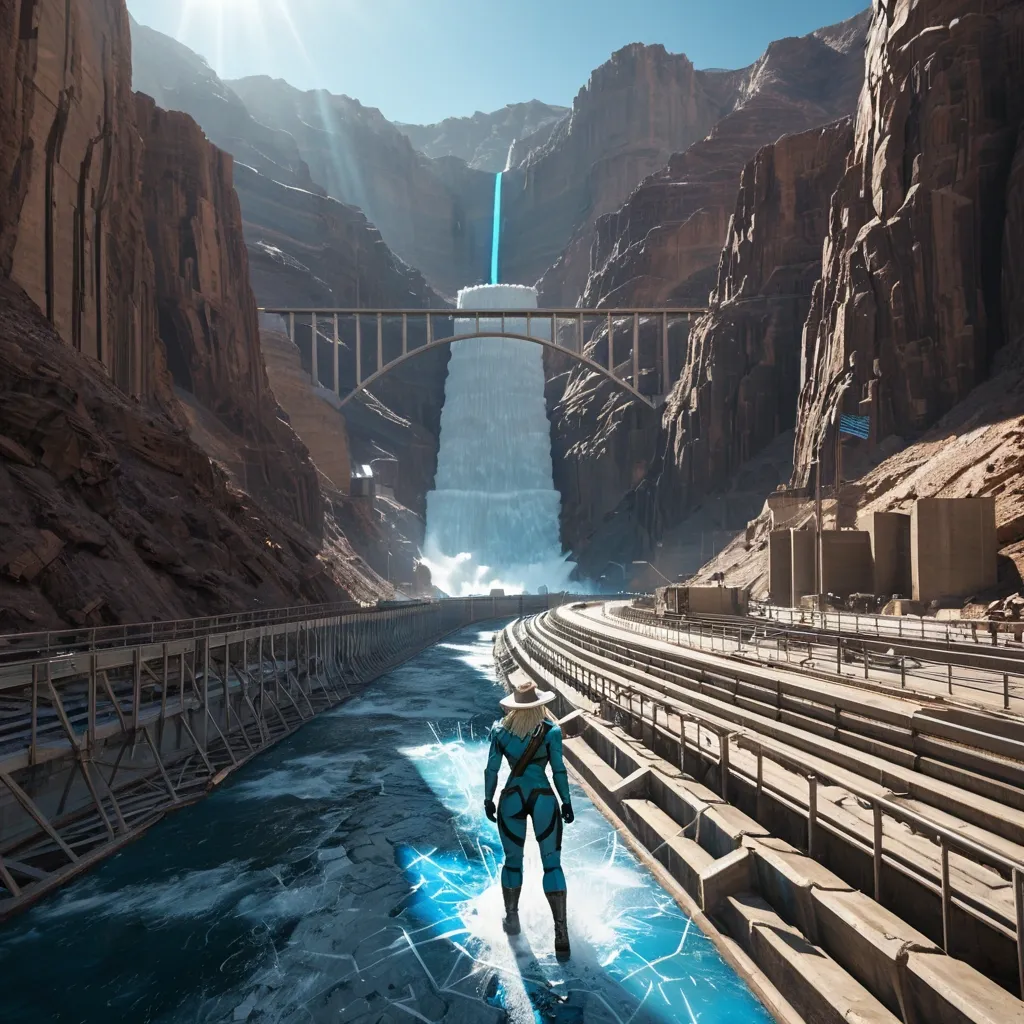
Focus on A voluptous blonde @Clare Redfield of resident evil games in tattered form-fitting long-sleeve long-pant blue latex suit sprints through a sun-soaked , post apocalyptical pavement of the top of Hoover Dam. She wear white rattan cowboy hat , and futuristic bulky wristcom. Low-angle tracking shot; rain streaks and puddle splashes; holographic billboards , AR ads and hovering traffic reflecting on slick asphalt. Motion-blur trails emphasize speed; back light outlines her silhouette; volumetric winds and light haze add depth. Ultra-detailed digital painting , cinematic composition , background is A hot summer midnoon post-apocalyptic Hoover Dam , clearly recognizable by its sweeping curved concrete wall and canyon. The central section is broken open in a jagged chasm , a simple scrap-built bridge has been added following the broken curve. Rough steel beams bolted to surviving anchor points , metal plates forming an uneven walkway. The top of the dam has become a small fortified encampment. Scrap-metal barricades line the parapets , with two lookout towers placed at natural vantage points. A few corrugated-metal shelters and canvas-covered work areas sit near the most stable parts of the dam , used for repairs and overseeing the canyon below. A few small human figures in soldier uniforms walking busily in the far distances and corners. The harsh sunlight casting white heat light on everything. The sky is azure-blue without cloud. Swirling winds passing by. Far below , only a thin , sluggish line of water remains in the canyon. Large fallen chunks of concrete still lie at the base , some stripped for usable metal. A few rope ladders and simple pulley rigs connect the dam’s edge to salvage points below , evidence of ongoing reconstruction. The whole scene feels grounded and practical: Hoover Dam still unmistakable , damaged but rebuilt just enough to serve as a functional stronghold for a surviving faction. , 8k resolution concept art by Greg Rutkowski dynamic lighting hyperdetailed intricately detailed Splash art trending on Artstation triadic colors Unreal Engine 5 volumetric lighting Alphonse Mucha WLOP Jordan Grimmer orange and teal , Hyperrealistic , splash art , concept art , mid shot , intricately detailed , color depth , dramatic , 2/3 face angle , side light , colorful background ,
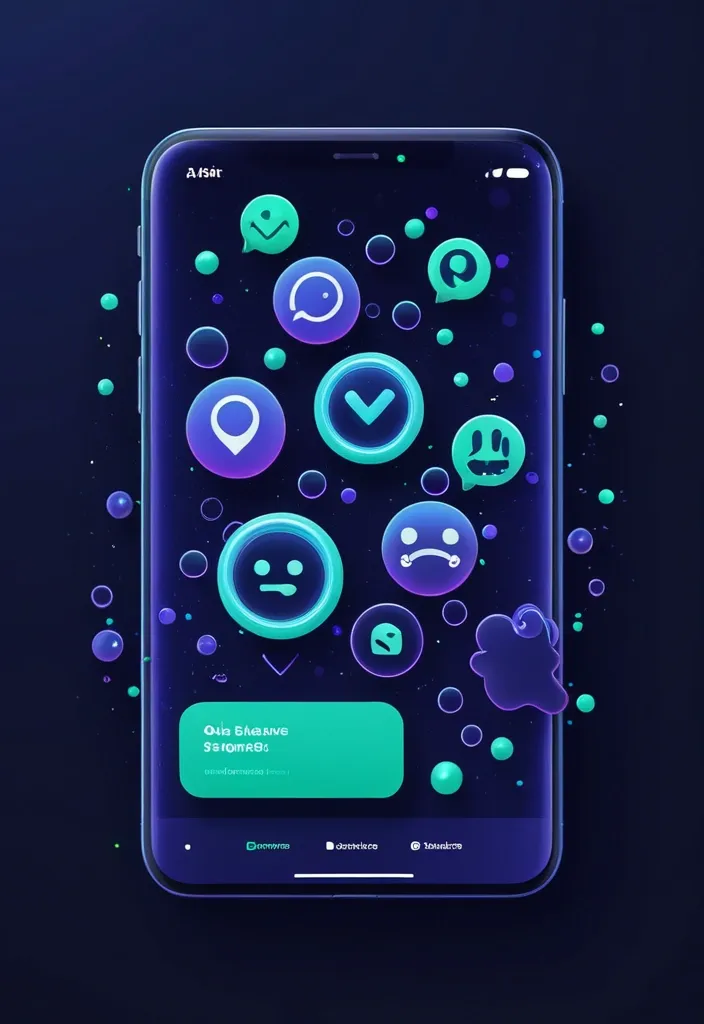
**Main Prompt (Скопируйте на английском):** > Premium 3D UI/UX illustration for a mobile app onboarding , dark mode SaaS aesthetic. Concept of safe networking , smart communication , and community building. In the center , two sleek , floating 3D chat bubbles intersecting gracefully. The chat bubbles are made of dark frosted glass with vibrant electric purple and neon cyan edge lighting. Hovering over one bubble is a glowing emerald green 3D security shield icon. Surrounding the bubbles are abstract interconnected glowing nodes and soft floating sparks. Solid deep midnight indigo navy blue background (#0F172A). Glassmorphism , soft studio lighting , dynamic composition , depth of field (bokeh effect) , dribbble trending masterpiece , 8k resolution. **Negative Prompt (Обязательно добавьте):** > smartphones , screens , text , words , letters , UI mockups , people , hands , human faces , flat vector , 2d , black background , messy , low quality , social media logos , sad emojis , angry emojis , thumbs down. ,
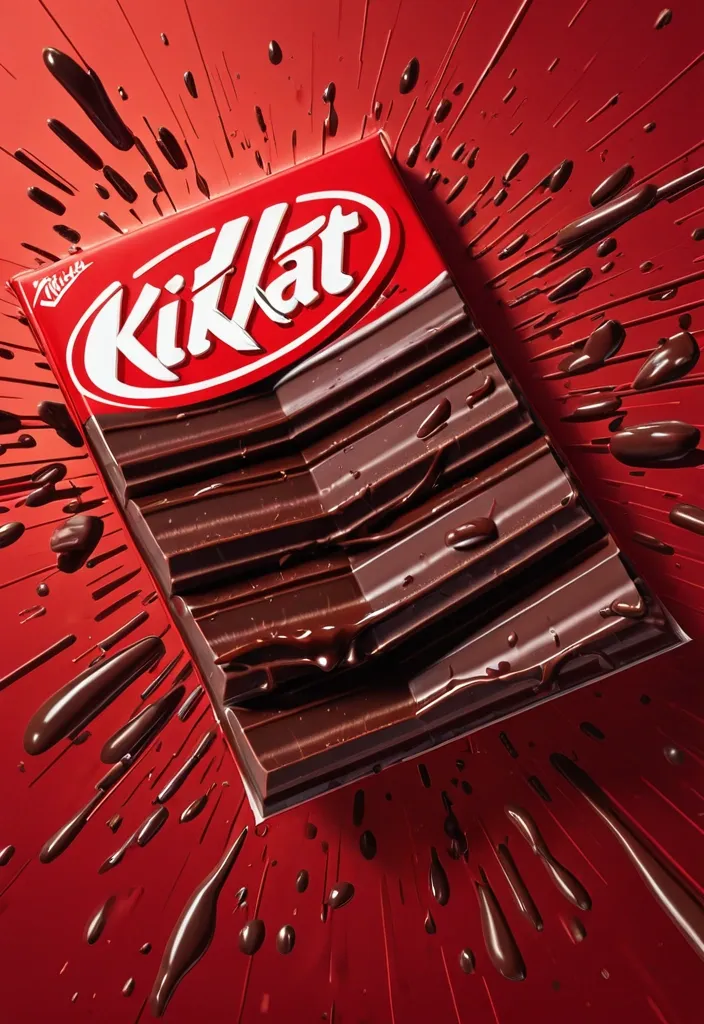
FORMAT: 4:5 vertical hyper-commercial chocolate campaign poster , ultra-high resolution (8K) , premium billboard + social media advertising ready Style: bold FMCG advertising × modern snack campaign × energetic commercial poster design × high-impact product photography 🧠 CORE IDEA: THE BREAK EVERYONE WAITS FOR. A campaign built around impact , craving , and satisfying motion. Everything in the composition reacts to the iconic KitKat snap. 🎬 MASTER COMPOSITION: BACKGROUND: Deep KitKat red environment Layered with: - rich red gradients - chocolate texture overlays - dynamic motion streaks - subtle crumb particles - repeated typography patterns - glossy studio reflections The atmosphere should feel: bold , hungry , energetic , commercially explosive. 👤 HUMAN SUBJECT: Young Gen-Z male/female model Expression: playful , confident , mid-enjoyment moment Pose: holding KitKat toward camera mid-snap action Camera angle: slightly low + close perspective for product dominance Wardrobe: modern streetwear in neutral tones allowing red palette to dominate 💥 VISUAL ENERGY: The SNAP becomes the visual explosion. At the break point: - chocolate shards flying outward - wafer crumbs suspended mid-air - liquid chocolate streaks - motion lines radiating from snap Typography physically cracks apart following the KitKat break. Feels: satisfying , punchy , commercially exaggerated. 🍫 PRODUCT HERO: [KitKat](chatgpt://generic-entity?number=0) chocolate bar + wrapper Placement: foreground center-right Angle: extreme 3/4 hero perspective Product details: - hyper-real chocolate texture - visible wafer layers - glossy melted chocolate highlights - realistic crumbs - embossed KitKat logo - premium wrapper reflections Chocolate should feel: crispy , rich , irresistible. ✍️ TYPOGRAPHY SYSTEM: MAIN HEADLINE: “BREAK TIME.” Typography style: - ultra-bold condensed sans-serif - oversized stacked layout - white typography - extremely tight spacing - cracked/distorted around snap point SECONDARY TEXT: “HAVE A BREAK. HAVE A KITKAT.” BACKGROUND TYPOGRAPHY: Repeated low-opacity words: SNAP CRUNCH BREAK CHOCOLATE WAFER MELT integrated into background layers 📦 FEATURE INFORMATION STRIP: Bottom premium feature strip: □ CRISPY WAFER □ RICH CHOCOLATE □ ICONIC SNAP □ PERFECT BREAK Minimal modern icon system. 📣 CTA SECTION: BOTTOM LEFT: “NEW SHARING PACK AVAILABLE” CTA BUTTON: solid white rectangular button TEXT: “GRAB NOW” Secondary micro CTA: “Available Online & In Stores” 🌐 WEBSITE + BRAND INFO: BOTTOM CENTER: www.kitkat BOTTOM MICROTEXT: “NESTLÉ KITKAT · 2026 EDITION” 🎨 COLOR SYSTEM: PRIMARY: KitKat red deep chocolate brown SECONDARY: white typography ACCENTS: warm chocolate highlights golden wafer tones Palette should feel: bold , delicious , high-energy , commercial. 💡 LIGHTING SYSTEM: MAIN LIGHT: strong commercial studio key light RIM LIGHT: warm chocolate highlights around product ACCENT LIGHT: soft red glow behind snap motion ATMOSPHERIC LIGHT: subtle floating particles catching light REFLECTIONS: glossy FMCG-grade reflections Lighting should feel: premium snack advertising × modern commercial photography. ✨ HYPER DETAILING: - ultra-real wafer texture - sharp chocolate break detail - floating crumb realism - melted chocolate reflections - premium wrapper texture - billboard readability maintained - ultra-clean typography edges - high-end FMCG rendering quality 📐 COMPOSITION FLOW: Upper Frame: massive typography dominance Center: snap explosion + human interaction Foreground: product hero Lower-left: CTA + features Eye flow: Headline → Snap → Product → Chocolate Motion → CTA 🎥 CAMERA & RENDER: - commercial food photography - Phase One medium format feel - 35–50mm lens - HDR commercial rendering - ultra-clean sharpness - premium FMCG color grading 🔥 FINAL FEEL: Feels like: Nike energy campaign × premium FMCG launch × modern Behance commercial food poster. ,
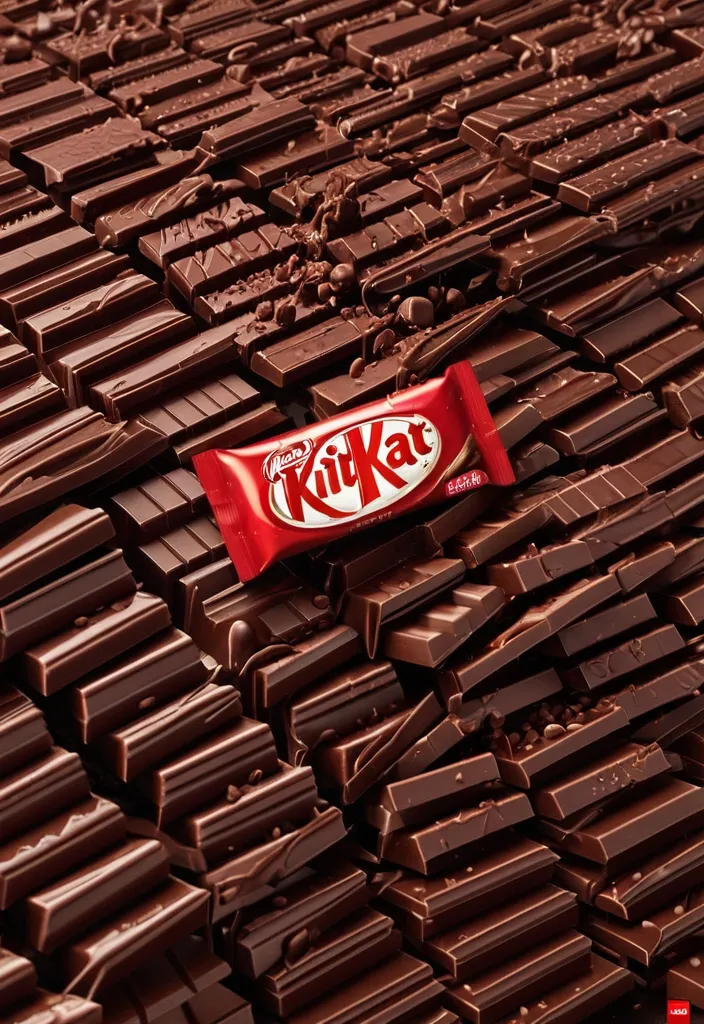
FORMAT: 4:5 vertical hyper-commercial chocolate campaign poster , ultra-high resolution (8K) , premium billboard + social media advertising ready Style: bold FMCG advertising × modern snack campaign × energetic commercial poster design × high-impact product photography 🧠 CORE IDEA: THE BREAK EVERYONE WAITS FOR. A campaign built around impact , craving , and satisfying motion. Everything in the composition reacts to the iconic KitKat snap. 🎬 MASTER COMPOSITION: BACKGROUND: Deep KitKat red environment Layered with: - rich red gradients - chocolate texture overlays - dynamic motion streaks - subtle crumb particles - repeated typography patterns - glossy studio reflections The atmosphere should feel: bold , hungry , energetic , commercially explosive. 👤 HUMAN SUBJECT: Young Gen-Z male/female model Expression: playful , confident , mid-enjoyment moment Pose: holding KitKat toward camera mid-snap action Camera angle: slightly low + close perspective for product dominance Wardrobe: modern streetwear in neutral tones allowing red palette to dominate 💥 VISUAL ENERGY: The SNAP becomes the visual explosion. At the break point: - chocolate shards flying outward - wafer crumbs suspended mid-air - liquid chocolate streaks - motion lines radiating from snap Typography physically cracks apart following the KitKat break. Feels: satisfying , punchy , commercially exaggerated. 🍫 PRODUCT HERO: [KitKat](chatgpt://generic-entity?number=0) chocolate bar + wrapper Placement: foreground center-right Angle: extreme 3/4 hero perspective Product details: - hyper-real chocolate texture - visible wafer layers - glossy melted chocolate highlights - realistic crumbs - embossed KitKat logo - premium wrapper reflections Chocolate should feel: crispy , rich , irresistible. ✍️ TYPOGRAPHY SYSTEM: MAIN HEADLINE: “BREAK TIME.” Typography style: - ultra-bold condensed sans-serif - oversized stacked layout - white typography - extremely tight spacing - cracked/distorted around snap point SECONDARY TEXT: “HAVE A BREAK. HAVE A KITKAT.” BACKGROUND TYPOGRAPHY: Repeated low-opacity words: SNAP CRUNCH BREAK CHOCOLATE WAFER MELT integrated into background layers 📦 FEATURE INFORMATION STRIP: Bottom premium feature strip: □ CRISPY WAFER □ RICH CHOCOLATE □ ICONIC SNAP □ PERFECT BREAK Minimal modern icon system. 📣 CTA SECTION: BOTTOM LEFT: “NEW SHARING PACK AVAILABLE” CTA BUTTON: solid white rectangular button TEXT: “GRAB NOW” Secondary micro CTA: “Available Online & In Stores” 🌐 WEBSITE + BRAND INFO: BOTTOM CENTER: www.kitkat BOTTOM MICROTEXT: “NESTLÉ KITKAT · 2026 EDITION” 🎨 COLOR SYSTEM: PRIMARY: KitKat red deep chocolate brown SECONDARY: white typography ACCENTS: warm chocolate highlights golden wafer tones Palette should feel: bold , delicious , high-energy , commercial. 💡 LIGHTING SYSTEM: MAIN LIGHT: strong commercial studio key light RIM LIGHT: warm chocolate highlights around product ACCENT LIGHT: soft red glow behind snap motion ATMOSPHERIC LIGHT: subtle floating particles catching light REFLECTIONS: glossy FMCG-grade reflections Lighting should feel: premium snack advertising × modern commercial photography. ✨ HYPER DETAILING: - ultra-real wafer texture - sharp chocolate break detail - floating crumb realism - melted chocolate reflections - premium wrapper texture - billboard readability maintained - ultra-clean typography edges - high-end FMCG rendering quality 📐 COMPOSITION FLOW: Upper Frame: massive typography dominance Center: snap explosion + human interaction Foreground: product hero Lower-left: CTA + features Eye flow: Headline → Snap → Product → Chocolate Motion → CTA 🎥 CAMERA & RENDER: - commercial food photography - Phase One medium format feel - 35–50mm lens - HDR commercial rendering - ultra-clean sharpness - premium FMCG color grading 🔥 FINAL FEEL: Feels like: Nike energy campaign × premium FMCG launch × modern Behance commercial food poster. ,
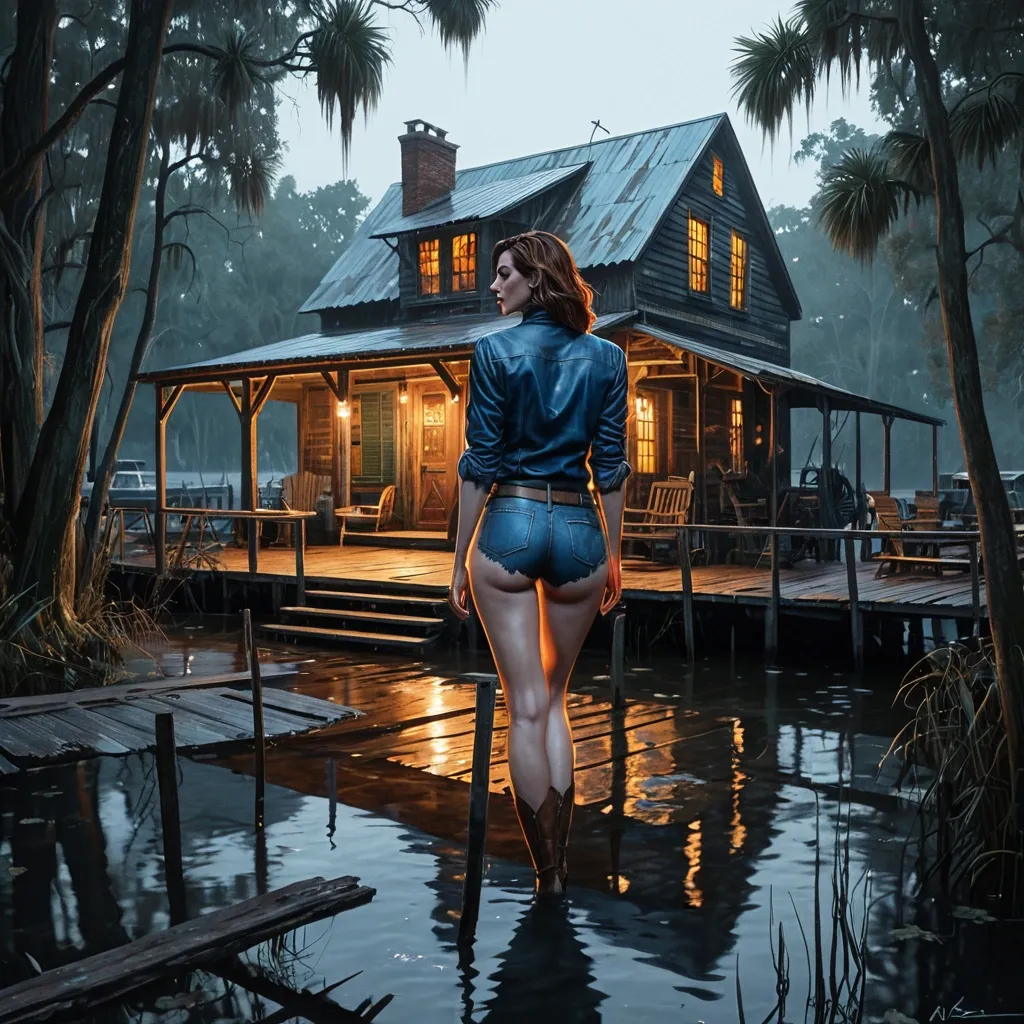
Highly Detailed Portrait Image of Gorgeous very curvy sun-hourglass physique Anne Hathaway ((perfect-likeness)) Standing up back to the camera with her arms down by her side and her legs straight together head to feet. She wearing dirty long-sleeve blue leather shirt , and a tattered jean short , and a fur scarves. Her legs are knee-deep in still dark water. painting by Jko , Norman Rockwell and Alex Ross and Gil Elvgren making a in full watercolor art style of. , , Hyperrealistic , splash art , concept art , mid shot , intricately detailed , color depth , dramatic , 2/3 face angle , side light , colorful background , Hyperrealistic , splash art , concept art , mid shot , intricately detailed , color depth , dramatic , 2/3 face angle , side light , colorful background A weathered wooden building stands elevated on stilts above dark water among white mist. Its old ancient red terracotta tiles are faded from sun and storms , and the wood siding shows years of wear. A cosy porch wraps around the front , strung with warm , glowing lights that cast a soft amber halo over the scene. With rocking Chairs , small decorations , and bits of fishing gear give it that lived‑in , come‑sit‑a‑while personality. Signs on the building identify it as "Haley Place" and "Moonshiner" , grounding it firmly in bayou country. Wooden steps lead down to a narrow boardwalk stretching over the water covered with white mist , inviting you toward boats , early mornings , and stories told with a drawl. Surrounding trees and thick vegetation frame the structure , adding to the sense of a tucked‑away riverside stop where locals gather , travellers drift through , and the night hums with crickets and slow water. It's rustic , warm , and unmistakably Southern , a little slice of bayou life glowing against the dark. , , detailed matte painting , deep color , fantastical , intricate detail , splash screen , complementary colors , fantasy concept art , 8k resolution trending on Artstation Unreal Engine 5 , detailed matte painting , deep color , fantastical , intricate detail , splash screen , complementary colors , fantasy concept art , 8k resolution trending on Artstation Unreal Engine 5 bayou , swamp cottage , bayou cottage , logcabin , fallout swamp , ,
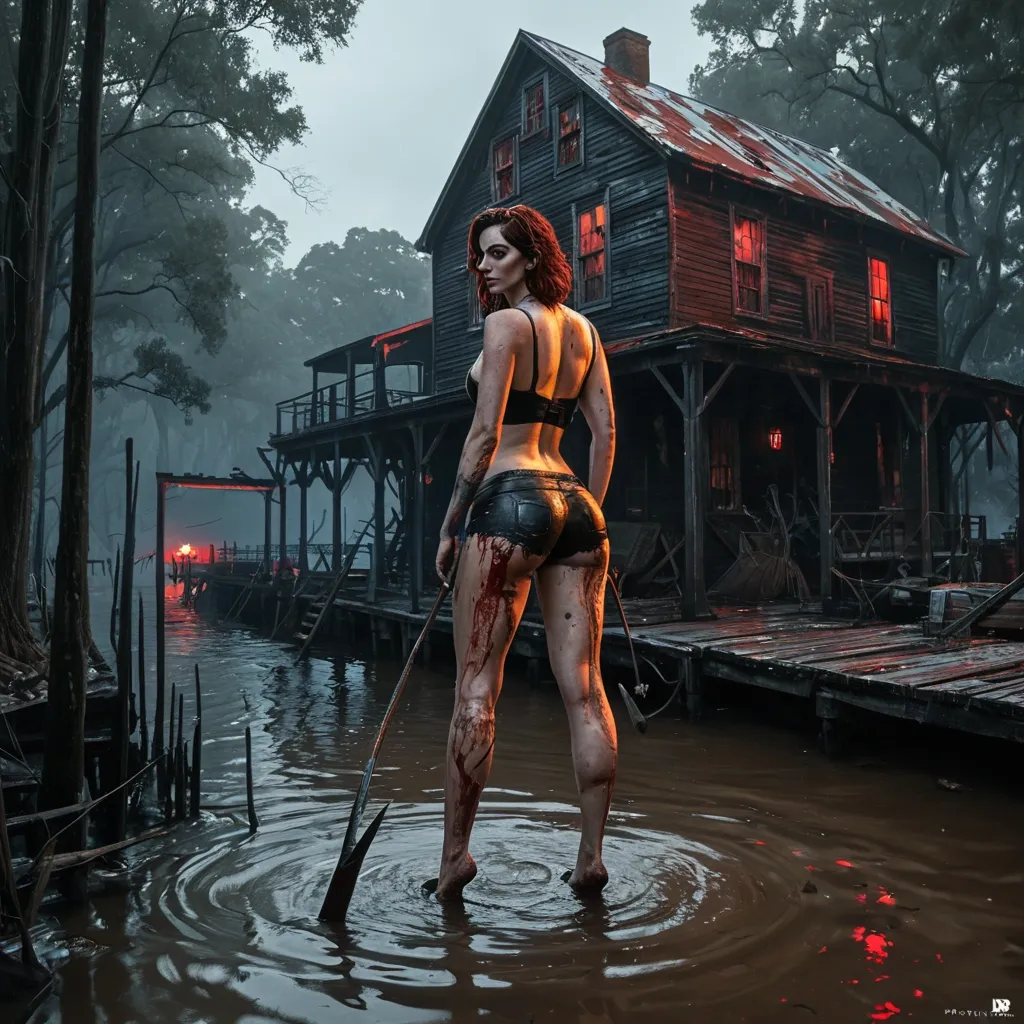
Highly Detailed Portrait Image of Gorgeous very curvy sun-hourglass physique Anne Hathaway Standing up back to the camera with her arms down by her side and her legs straight together head to feet. She dressing in worn tattered form-fitting fuzzy dog-fur metal shorts with scuff marks and utility pouches , . Her pale strong thighs are running knee-deep in still dark water. painting by Jko , Norman Rockwell and Alex Ross and Gil Elvgren making a in full watercolor art style of. , , Hyperrealistic , splash art , concept art , mid shot , intricately detailed , color depth , dramatic , 2/3 face angle , side light , colorful background , Hyperrealistic , splash art , concept art , mid shot , intricately detailed , color depth , dramatic , 2/3 face angle , side light , colorful background She holding short bloody machette running at faraway A weathered wooden building stands elevated on stilts above dark water among red mist. Its old ancient red terracotta tiles are faded from sun and storms , and the wood siding shows years of wear. An abandoned porch wraps around the front , strung with dark , out-of-power lights that cast a somber look over the scene. Broken rocking Chairs , scattered small decorations , and bits of fishing gear give it that abandoned personality. Signs on the building identify it as "Blackhall" , grounding it firmly in bayou country. Wooden steps lead down to a narrow boardwalk stretching over the water covered with red mist , inviting you toward boats , early mornings , and stories told with a drawl. Surrounding trees and thick vegetation frame the structure , adding to the sense of a tucked‑away riverside stop where locals gather , travellers drift through , and the night hums with crickets and slow water. It's menacing and unmistakably Southern , a little slice of bayou danger glowing in the dark. , , detailed matte painting , deep color , fantastical , intricate detail , splash screen , complementary colors , fantasy concept art , 8k resolution trending on Artstation Unreal Engine 5 , detailed matte painting , deep color , fantastical , intricate detail , splash screen , complementary colors , fantasy concept art , 8k resolution trending on Artstation Unreal Engine 5 ,
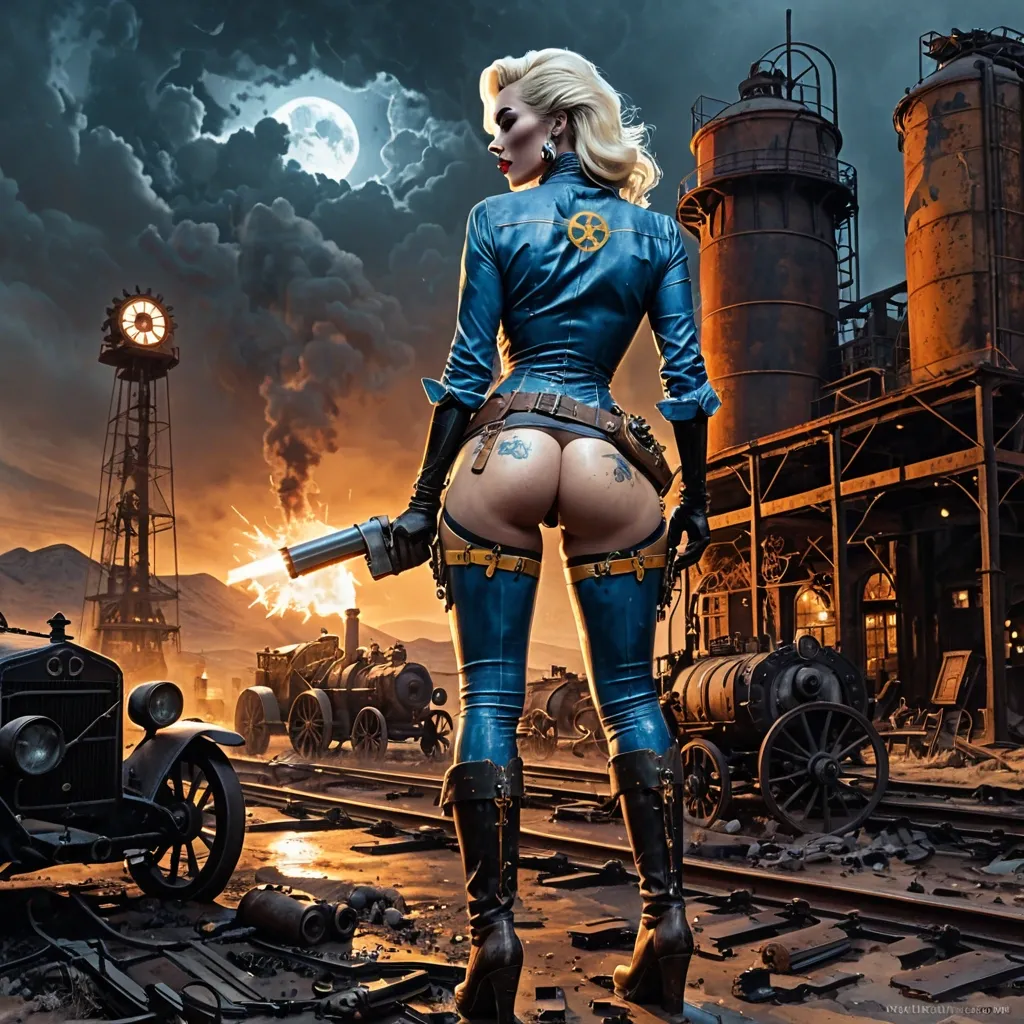
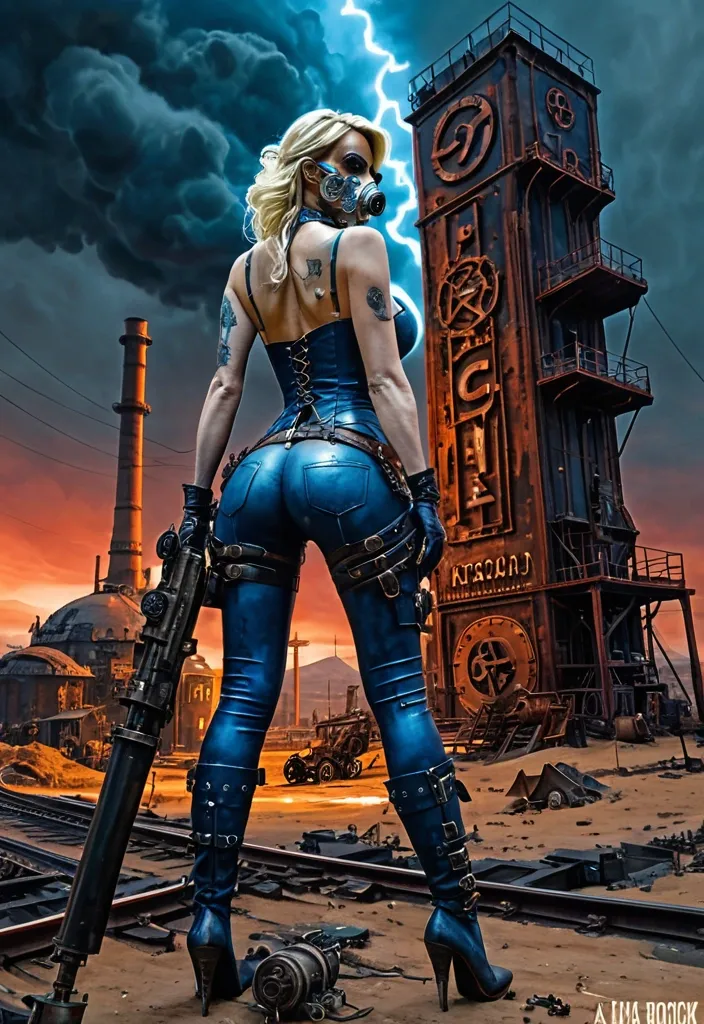
From behind view of a blonde Marilyn Monroe wearing dirty tattered form-fitting long blue latex shirt with dirty yellow "13" on her back , belt holster and pouch , pale strong thighs in blue no-pocket jean long-pant step on a steampunk gearbox , she is firing flintlock. In the background is A mysterious , abandoned desert outpost , rendered in a gritty , maximalist steampunk style. Gears , pipes , and clockwork contraptions are integrated into the architecture , suggesting a failed industrial venture. The sky is a turbulent mix of storm clouds and faint starlight , with a sense of profound mystery pervading the scene.. tiny electric arcs between gears , sparking redhot. Floodlight on tower shining across view and illuminating her body curves and corpses of cowboys on the ground. . An old billboard with gothic letter "STEEL" on the wall. The scene is rendered in a painting by Jko , Norman Rockwell and Alex Ross and Gil Elvgren making a in full watercolor art style of. with dramatic , cinematic lighting , emphasizing deep shadows and a limited , desaturated color palette. , , steampunk engine , steampunk engine ,
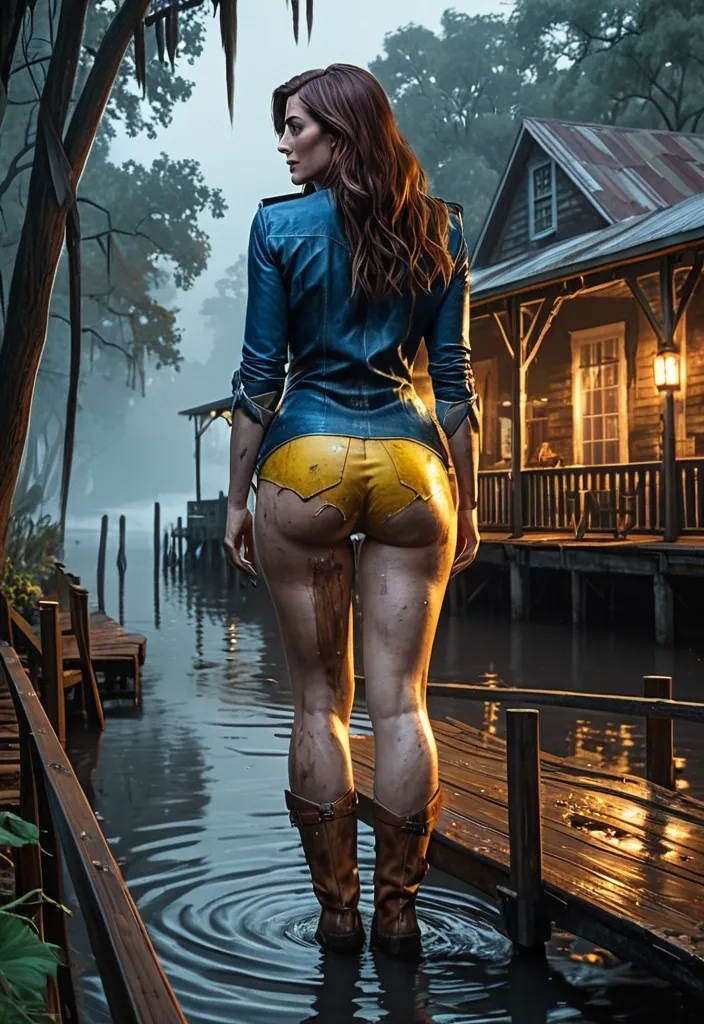
Highly Detailed Portrait Image of Gorgeous very curvy sun-hourglass physique Anne Hathaway Standing up back to the camera with her arms down by her side and her legs straight together head to feet. She wearing dirty long-sleeveblue leather shirt with dirty yellow 101 on back , and a tattered jean short , and a fur scarves. Her legs are knee-deep in still dark water. painting by Jko , Norman Rockwell and Alex Ross and Gil Elvgren making a in full watercolor art style of. , , Hyperrealistic , splash art , concept art , mid shot , intricately detailed , color depth , dramatic , 2/3 face angle , side light , colorful background , Hyperrealistic , splash art , concept art , mid shot , intricately detailed , color depth , dramatic , 2/3 face angle , side light , colorful background A weathered wooden building stands elevated on stilts above dark water among white mist. Its old ancient red terracotta tiles are faded from sun and storms , and the wood siding shows years of wear. A cosy porch wraps around the front , strung with warm , glowing lights that cast a soft amber halo over the scene. With rocking Chairs , small decorations , and bits of fishing gear give it that lived‑in , come‑sit‑a‑while personality. Signs on the building identify it as "Haley Place" and "Moonshiner" , grounding it firmly in bayou country. Wooden steps lead down to a narrow boardwalk stretching over the water covered with white mist , inviting you toward boats , early mornings , and stories told with a drawl. Surrounding trees and thick vegetation frame the structure , adding to the sense of a tucked‑away riverside stop where locals gather , travellers drift through , and the night hums with crickets and slow water. It's rustic , warm , and unmistakably Southern , a little slice of bayou life glowing against the dark. , , detailed matte painting , deep color , fantastical , intricate detail , splash screen , complementary colors , fantasy concept art , 8k resolution trending on Artstation Unreal Engine 5 , detailed matte painting , deep color , fantastical , intricate detail , splash screen , complementary colors , fantasy concept art , 8k resolution trending on Artstation Unreal Engine 5 ,
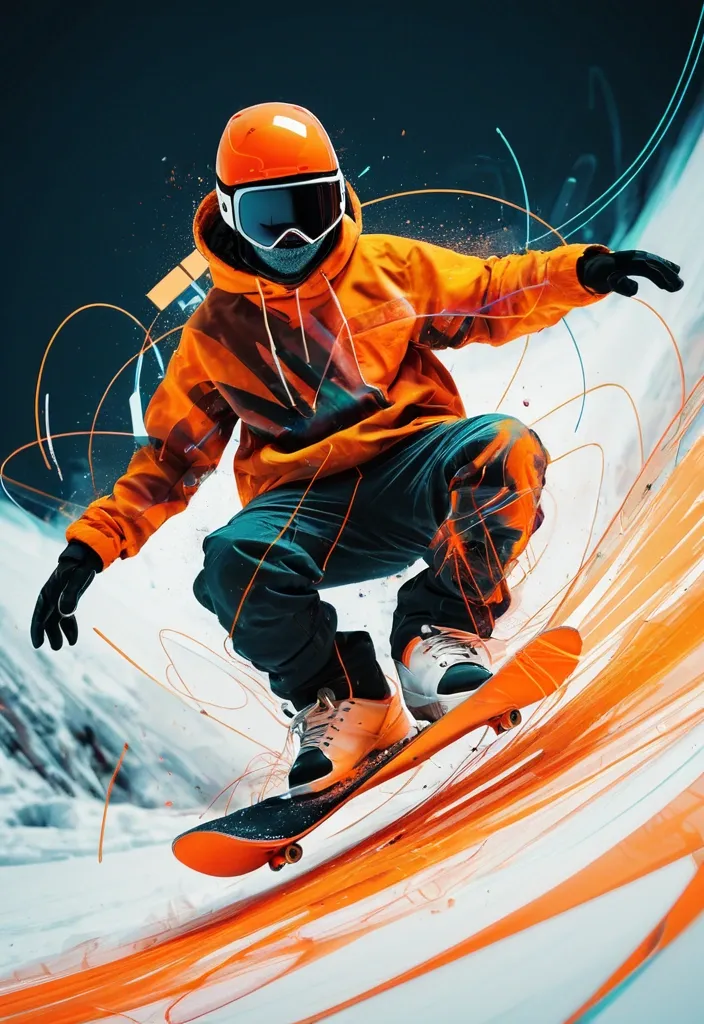
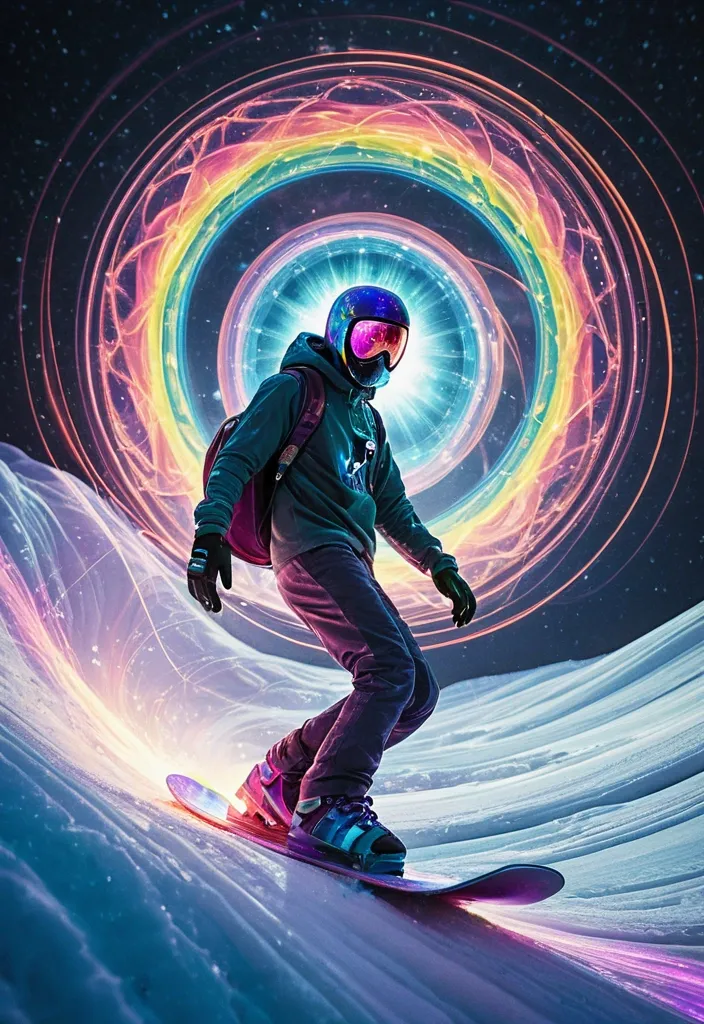
An abstract representation of a snowboarder mid-air , captured with dynamic , flowing lines and vibrant , fragments into electric waveform , infrared orange rim light , contrast duo-tone , blur on debris. The style blends abstract expressionism with elements of digital glitch art , creating a sense of chaotic energy and motion. Geometric shapes and distorted perspectives convey the thrill of extreme sports. ,
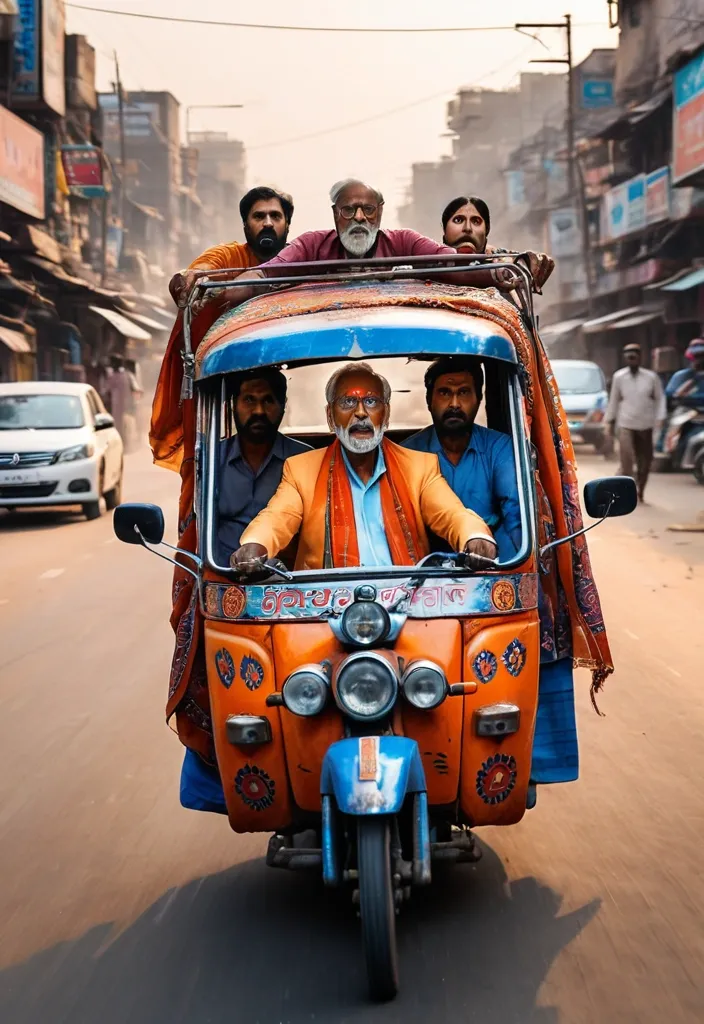
The chhakado (three-wheeler tempo) is heavily decorated with colorful Indian art , Gujarati stickers , mirrors , LED strips , and hand-painted typography saying “KUTCH EXPRESS”. IMPORTANT: clearly show that the panic mature man (Use reference photo 100% use my real faces) is driving the chhakado (three-wheeler tempo) — realistic Indian man sitting in the DRIVER seat with both front hands on the handlebar , actively steering the chhakado (three-wheeler tempo) , wearing a stylish traditional kutchi scarf blowing in the wind , funny but ultra realistic expression , visible driving posture , focus on driver controlling the vehicle. On the chhakado a funny dramatic Indian family is screaming in panic — elderly Indian man sitting beside the driver terrified , young woman in blue Saree shocked , another woman in red dupatta yelling with dupatta flying dramatically in wind , young Indian man hanging dangerously from the side of the moving auto. Busy Indian market street with Gujarati signboards , chai stalls , pani puri vendors , bikes , fruit carts , pedestrians running away in chaos , cinematic dust storm , dramatic orange sunset lighting , volumetric light rays , realistic reflections , depth of field. Hyper detailed textures , realistic Indian faces , vibrant colors , comedy action atmosphere , blockbuster Bollywood movie frame , sharp focus on the speeding auto rickshaw tempo while surroundings remain motion blurred for speed effect , photorealistic , ultra detailed , cinematic realism , 8k , vertical composition , high energy scene --ar 3:4 --stylize 300 --quality 2 ,
Generate a realistic image of a futuristic metropolis at night , with towering skyscrapers and neon-lit billboards reflecting off wet pavement. In the center , a colossal Marilyn Monroe , depicted in a luminous , exploding form , fragments into thousands of glowing , translucent rainbow gradient dots. These dots burst across the city's skyline , creating an animated light art display. Swirling nebulae and drones made of pure energy , rendered in expressive , dancing brushstrokes , traverse the buildings. This spectacle casts a kaleidoscope of fluorescent colors onto the streets below , creating an electric atmosphere with streaking white light trails. The scene embodies a sense of dynamic movement , as if the city itself is alive and celebrating its innovative spirit. ,
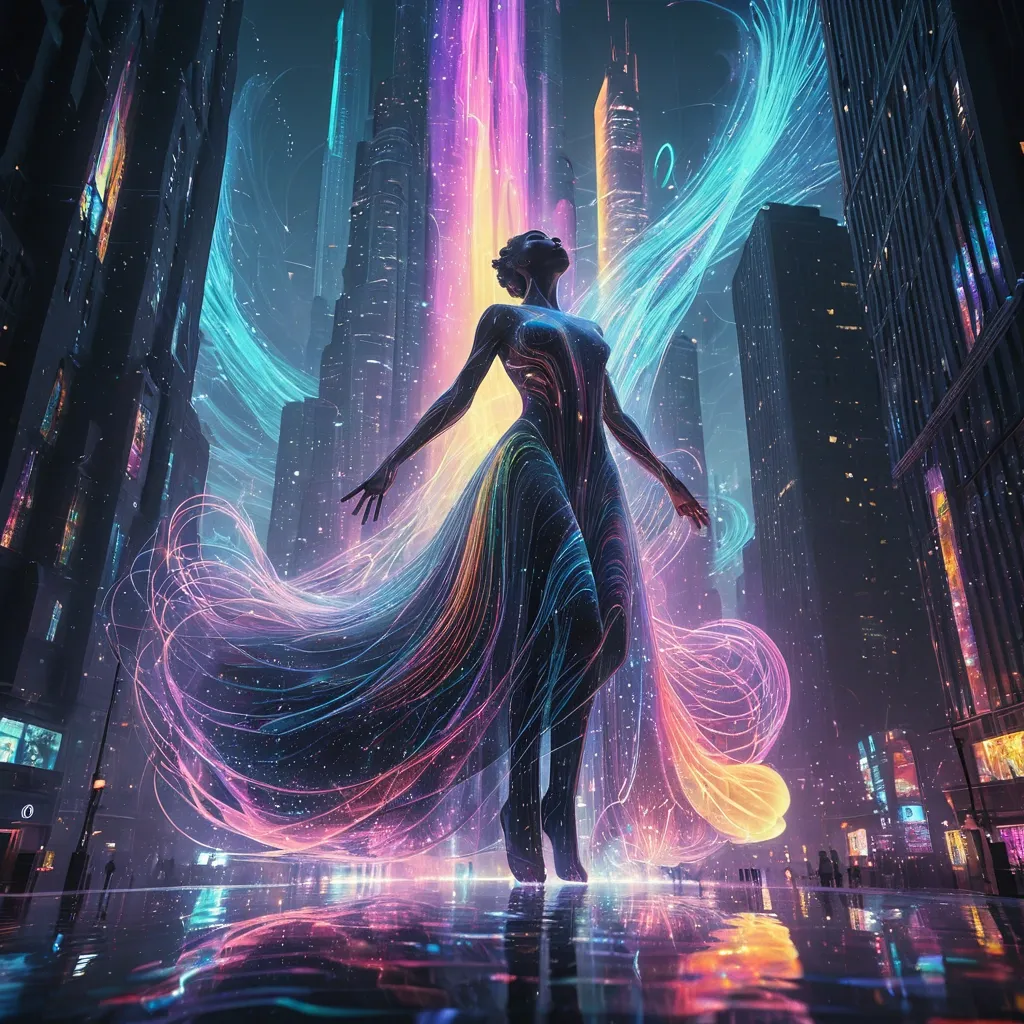
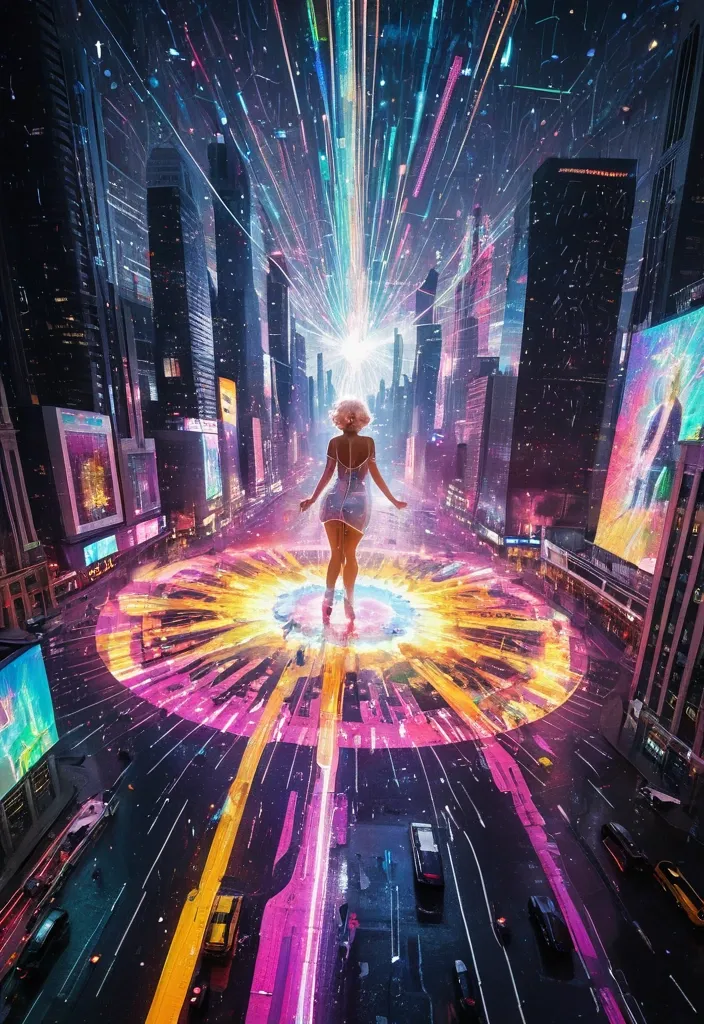
Envision a futuristic metropolis at twilight , with a colossal , A dancer in dynamic motion with luminous pointillism rendering. Thousands of glowing , translucent rainbow gradient stripes and vibrant energy forming the figure. Cascading water particle trails creating ethereal energy and movement. Dramatic vortex gown flowing across into the vortex. The city's skyline transformed into a canvas of vibrant , animated light art. Swirling nebulae and fantastical creatures made of pure energy are projected onto the building facades , illuminating the streets below with a kaleidoscope of fluorescent colors. and neon-lit billboards reflecting off the water's surface. The atmosphere is magical , with streaking white light trails and a sense of wonder. The cyclone's presence seems to energize the city night , as if it's a manifestation of the metropolis's innovative spirit. Style: Celestial , abstract , digital art. Lighting: Soft , neon glow with dramatic backlighting. Composition: Upward gaze , dynamic diagonal lines. Details: Include sparkling gray waves , wispy smoke , and a sense of movement. Quality: High detail , 4K , masterpiece , rendered in Octane. ,
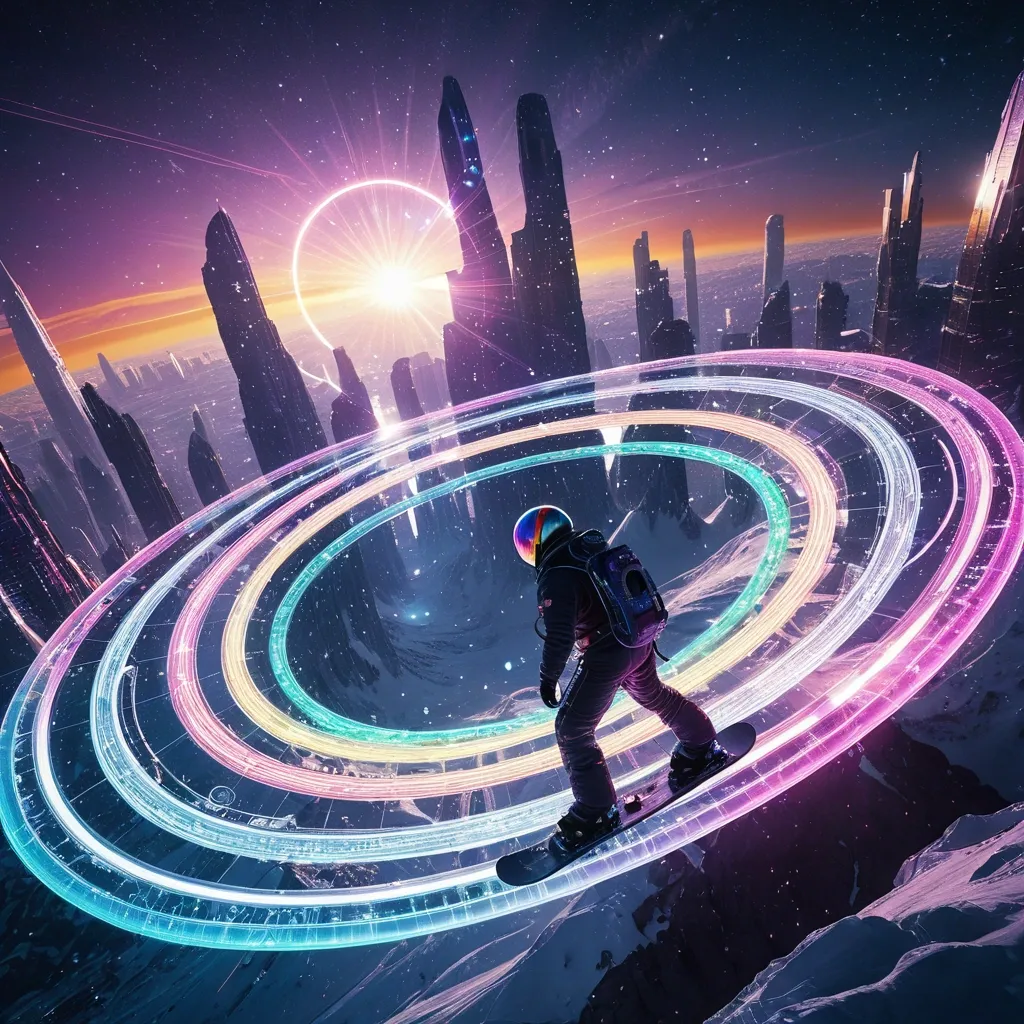
A breathtaking vista of a planetary ring system made not of ice and rock , but of intricate , shimmering data streams and celestial skyscrapers of city in full bloom. A casting ethereal light onto the rings. A astronaut surfer on a futuristic snowboard at the apex of a daring ride through ring. The snowboard emits a brilliant , ionized trail of neon-lit motion waves in vibrant , rainbow hues , creating a striking contrast against the dark. ,
Envision a planetary ring system that defies conventional reality , where iridescent , glowing data streams and fantastical , skyscraper-like structures in full bloom create a mesmerizing , dreamlike landscape. A Spider-Man surfer , wearing a flowing , cosmic cloak , navigates a shimmering , rainbow-colored snowboard through the shimmering rings , which seem to respond to his presence with dynamic , swirling patterns of light. The snowboard's ionized trail manifests as a kaleidoscope of neon hues , swirling and dancing across the dark expanse like a celestial display of fireworks. The scene is infused with a soft , ethereal light that seems to emanate from the rings themselves , casting an otherworldly glow on the surfer and his surroundings. The atmosphere is one of enchantment , curiosity , and limitless possibility. ,
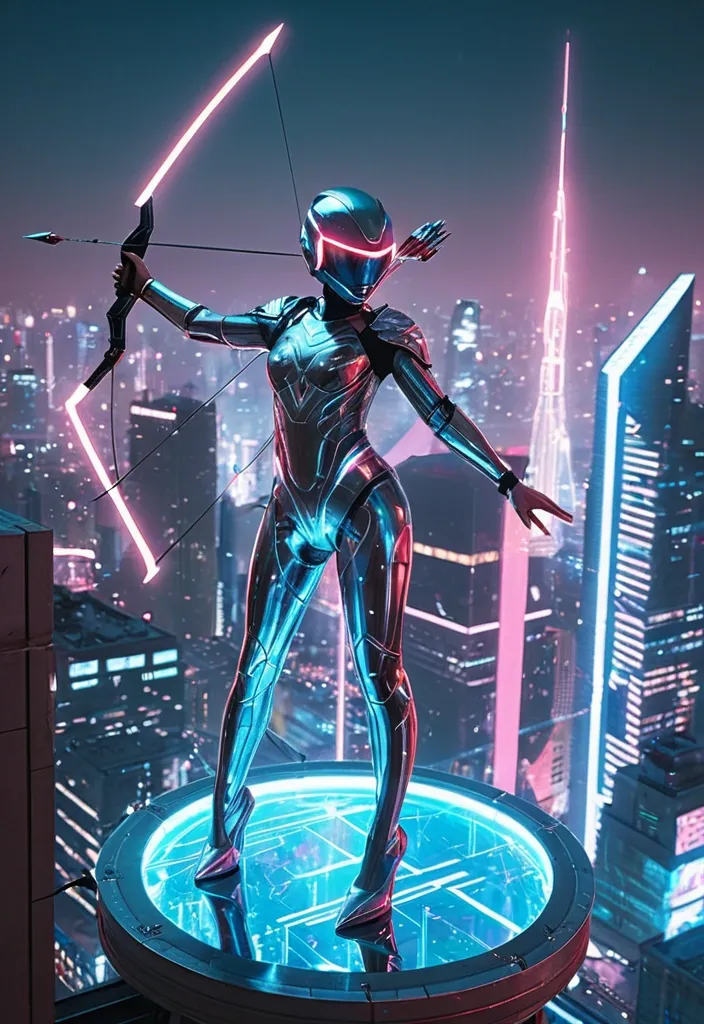
A futuristic archer in a chrome bodysuit perched on the edge of a floating platform above a neon-lit cityscape. Her bow is transparent and pulsating with energy , arrows glowing like blue comets. She wears a sleek helmet with a single red visor strip , reflecting the holograms below. Skyscrapers stretch in every direction , their surfaces covered with kinetic billboards and glowing conduits. Fog rolls between the buildings , tinged with pink and teal lights. The archer’s silhouette is poised—still as steel , a guardian of the digital skyline. ,
From behind view of a blonde Angelina Julie wearing lace mask and dirty tattered form-fitting blue leather with belt holster and pouch , pale strong thighs in blue jean long-pant step on a steampunk gearbox , she is holding a flintlock. In the background is A mysterious , abandoned desert outpost , rendered in a gritty , maximalist steampunk style. Gears , pipes , and clockwork contraptions are integrated into the architecture , suggesting a failed industrial venture. The sky is a turbulent mix of storm clouds and faint starlight , with a sense of profound mystery pervading the scene.. tiny electric arcs between gears , sparking redhot. Floodlight on tower shining across view and illuminating her body curves. An old billboard with gothic letter POSEIDON on the wall. The scene is rendered in a painting by Jko , Norman Rockwell and Alex Ross and Gil Elvgren making a in full watercolor art style of. with dramatic , cinematic lighting , emphasizing deep shadows and a limited , desaturated color palette. , , steampunk engine ,
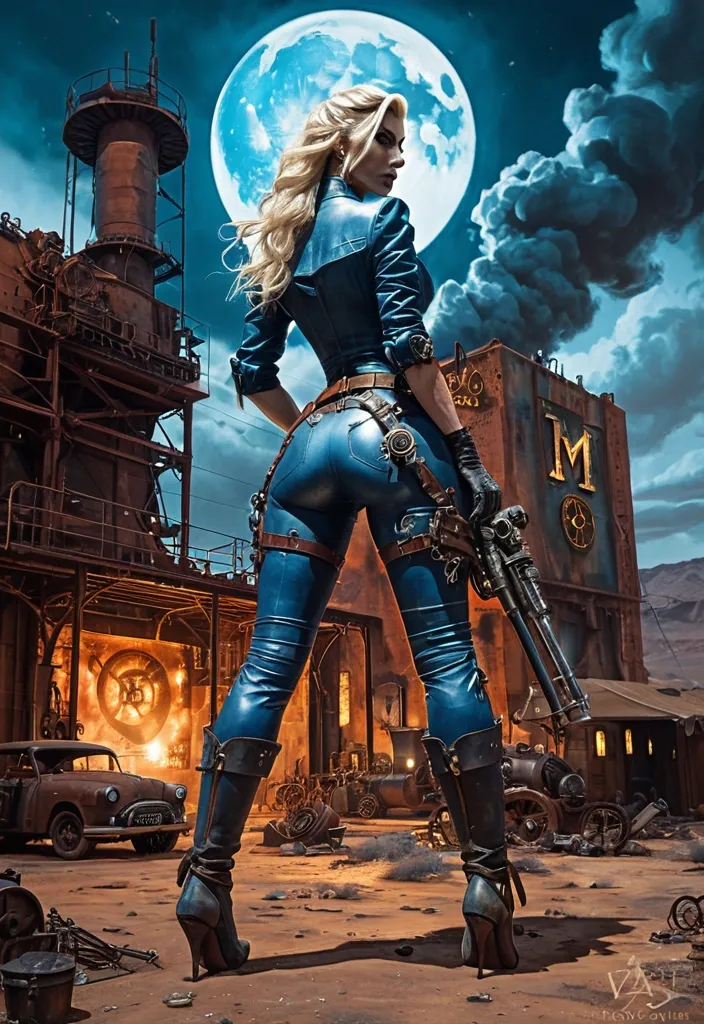
From behind view of a blonde Angelina Julie wearing dirty tattered form-fitting blue leather with belt holster and pouch , pale strong thighs in blue jean long-pant step on a steampunk gearbox , she is holding a flintlock. In the background is A mysterious , abandoned desert outpost , rendered in a gritty , maximalist steampunk style. Gears , pipes , and clockwork contraptions are integrated into the architecture , suggesting a failed industrial venture. The sky is a turbulent mix of storm clouds and faint starlight , with a sense of profound mystery pervading the scene.. tiny electric arcs between gears , sparking redhot. Floodlight on tower shining across view and illuminating her body curves. An old billboard with gothic letter POSEIDON on the wall. The scene is rendered in a painting by Jko , Norman Rockwell and Alex Ross and Gil Elvgren making a in full watercolor art style of. with dramatic , cinematic lighting , emphasizing deep shadows and a limited , desaturated color palette. , , steampunk engine ,